


 English (pdf)
 Article in xml format
 Article references
 Send this article by e-mail
 Cited by SciELO
  Cited by Google
  Similars in
SciELO
Similars in
SciELO  Similars in Google
 Permalink
1. Introduction
Clays are industrial minerals composed mainly by hydrous-aluminosilicates and in minor percentage by other minerals such as hematite, calcite, and rutile. Their physical and chemical properties make them useful in different areas like the cement industry, the ceramic industry, the foundry industry, civil engineering, cosmetics, paper, paints, oil, polymers, pharmaceuticals, catalysis fields, etc [1]. Clay production in Colombia is mainly intended for the manufacture of construction materials, as vitrified tablet, glazed tablet, tiles, bricks and crafting products [2].
The ceramic industry is the most productive economic sector in the Department of Norte de Santander, which is located in northeastern Colombia. The industry is composed of 59 companies, which are mostly family businesses that sell solid bricks, block bricks, tiles, and ornamental materials such as borders and other crafting products [3]. Due to this, the ceramic industry in the region has developed at a low technological level; 77% of companies use the beehive oven for firing clay products, resulting in low production yields [3], because of this, small clay companies do not have easy access to characterize adequately the raw materials that let them improve the technology of their products. Some studies of chemical and mineralogical characterization of clays have been made in the departments of Antioquia, Cundinamarca, Huila and Santander [4], while in Norte de Santander only physical characterization of clays has been reported [5,6].
Characterization of clays includes mineralogy, physical, thermal analysis and chemical composition. Thus, clays can be classified as high or low kaolin grade [7], which depends on its mineral composition. Likewise, the chemical composition can be used to determine the usefulness of clays according to the quantity of SiO2 and Al2O3 [8]. Physical characterization, i.e. plasticity, shrinkage, vitrification, particle size distribution, among others, determines the quality of the final product. Moreover, thermal analysis of clays provides information about the chemical and mineralogical changes during the firing process [9].
Science, Technology and Innovation legislation of Norte de Santander proposes that by 2020, the ceramic sector will be a national and international leader in the manufacturing of high quality products [10], and to meet this goal, it is essential to invest in the improvement of the technology used in the ceramic industry through the investigation of physical, chemical and thermal properties of the raw material and its products.
The purpose of this study was to determine the chemical composition, mineralogical and physical properties of ceramic Murano Mine clays, in order to call the attention of the importance of having information of the raw materials currently used in the manufacture of several products, and to contribute to establishing a quality standard of clays used in different construction materials.
2. Materials and methods
2.1. Samples
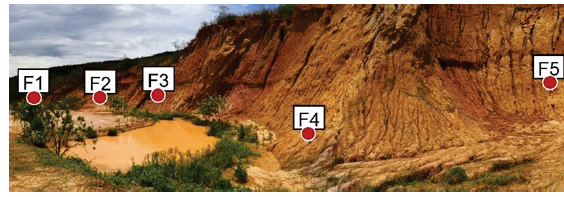
Samples were collected from the Murano Mine, located in El Zulia Municipality, Norte de Santander, 7° 55′ 57″ N, 72° 36′ 9″ W. Five samples (F1 to F5), according to the exposed mantles, were taken from one to two meters deep using a backhoe (Fig. 1). From each sampling point, the raw material was removed until weighing approximately 10 kg. Each sample was stored in a plastic bag and transported to the laboratory.
For the physical analysis the samples were crushed until they had a particle size less than two centimeters and were homogenized. After that, they were ground in a zirconium mill (Fritsch Pulverisette 6) and zipped through a mesh #100. Ground and dried samples were wetted until they contained a moisture content of 6%, and test tubes of clays were obtained by a press of 40 tons, (Gabbrielli Technology).
2.2. Chemical Analysis
Chemical compositions of samples were performed by X-ray fluorescence (XRF) using a Shimadzu EDX-800HS device with Dispersive Energy, equipped with a solid state detector Si (Li), X-ray source of Rhodium tube and a collimator of 3 mm. In order to quantify the chemical elements, the data was processed with the DXP-700E software version 1.00 Rel. 014 using Fundamental Parameters (FPM) Method. The major elements expressed as oxides and trace elements are given in mg kg-1.
2.3. Mineralogical analysis
Mineralogical analysis was determined by X-ray diffraction (XRD), using an D8 ADVANCE BRUKER diffractometer, with DaVinci Geometry under the following conditions: measurement range 3.5-70° 2θ, Radiation CuKα1, Nickel filter, Linear Lynx Eye detector, and sampling time 0.4 seconds. Samples were pulverized in an agate mortar until their size was less than 38 µm (mesh #400). The samples were installed on a sample holder of polymethylmethacrylate (PMMA).
Qualitative analysis of the established phases in the sample was performed by comparing the observed profile with the profiles reported in PDF-2 diffraction database of the International Centre for Diffraction Data (ICDD).
Quantitative analysis of the established phases in the sample was performed using the Rietveld refinement method of the observed profile when the sample is mixed with a 20% of an internal standard (Aluminum oxide, Corundum, α-phase).
2.4. Particle size analysis
Mesh # 200 (75 µm) was used to obtain 50 g of sieved and dried samples that were mixed with 200 mL of water and 20 mL of sodium hexametaphosphate (NaPO3)6 (4%) as a deflocculating agent. This suspension stood for one hour and after that, was transferred to an electrical stirring, for 5-10 min to disperse it, and then put in to a test tube with water until it reached a final volume of 1000 mL. According to international standards ASTM [11] a hydrometer 152H was used to take readings at 4, 8, 15 and 30 minutes, then 1, 2, 4 and 24 hours.
2.5. Plasticity
The plasticity index of the clay samples was measured according to international standards ASTM to obtain the Atterberbg limits [12]: liquid limit (LL), plastic limit (PL) and plasticity index (PI).
2.6. Loss on ignition
Weight loss was obtained by heating 1 g of dry sample into a crucible with a heating rate of 3.08° / minute up to a temperature of 950°C, maintaining this temperature for two hours. After that the crucible was cooled and stored in an exsiccator to determine the weight loss.
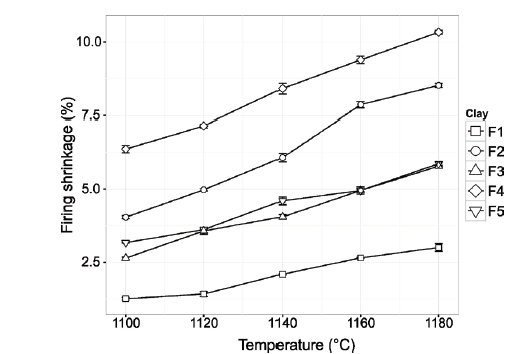
2.7. Firing shrinkage
The contraction (difference between final and initial dimensions) was measured after drying and firing the samples (clay test tubes). Drying contraction was determined after heating the samples at 105 °C during 24 hours. Firing contraction was measured after heating samples at 1100°C, 1120°C, 1140°C, 1160°C and 1180°C.
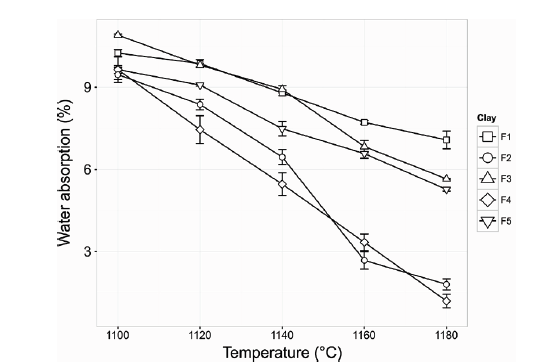
2.8. Water absorption
The fired samples were immersed in boiling water for five hours (according to the Colombian technical norm NTC 4321-3), then, left in water for 24 hours, and after that dried and weighed. The percentage of water absorption was determined from the weight difference between the samples before and after treatment.
3.1. Chemical composition
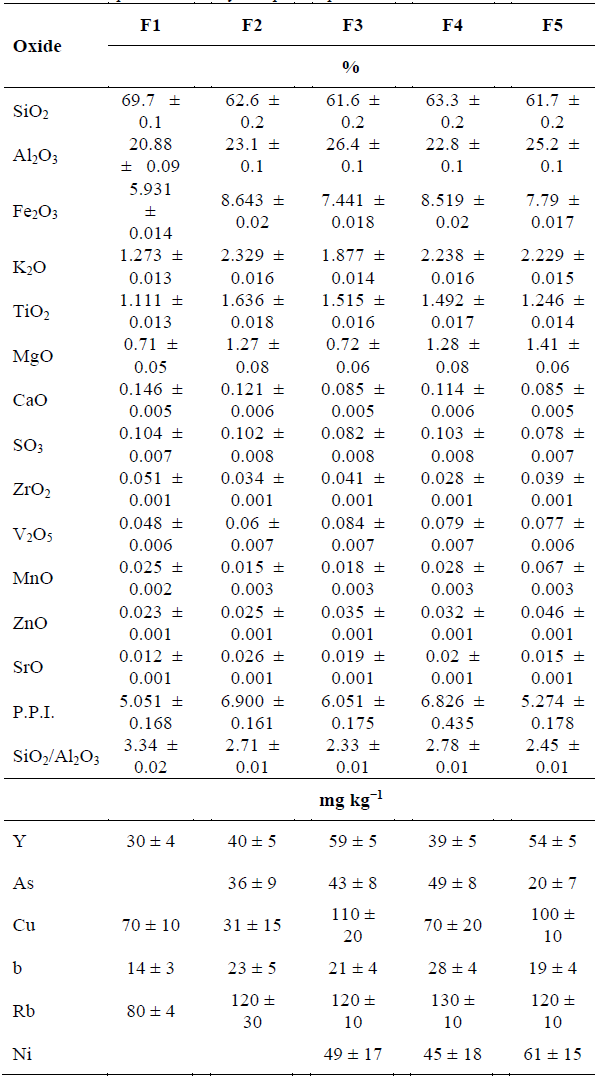
The main components in clays samples were SiO2, Al2O3 followed by Fe2O3, K2O and TiO2 (Table 1).
According to the results, the ratio SiO2/Al2O3 is higher than the theoretical ratio in kaolinite, especially in sample F1, indicating the presence of silicon in other mineral phases (possibly quartz) [13]. Furthermore, Fe2O3 content is relatively high [14], it fact could contribute to a decrease in the firing temperature of the ceramics [4]. Additionally, Al3+ cations of the octahedral layer of kaolinite might be partially substituted by Fe3+ cations [9].
The content of potassium oxide, K2O, and magnesium oxide, MgO, were low; indicating that high level of densification will not be possible at temperatures below 1000°C [15], because they are fluxing agents. In particular, the K2O in clays materials came from muscovite and potassium feldspar [16,17]. Finally, the average of this calcination loss in the samples was 6.140 ± 0.553, which is in concordance with previous studies in pressed clays [6].
Al2O3 has negative correlation with CaO (r = -0.9685, p = 0.0067), indicating that the calcium in the samples is not associated with phyllosilicates (Table 1). Conversely, a positive correlation with Al2O3 (r = 0.996, p = 0.00) was found for ytterbium, which indicates that it is associated with phyllosilicates. Moreover, K2O and rubidium have a positive correlation with Fe2O3, which are associated with the mineral phases of iron, while ZrO2 has a negative correlation with Fe2O3, CaO and SO3 has a positive and strong correlation (r = 0.90, p <0.05), corroborating that they are associated as sulphates, although in small quantities. In addition, the SrO is associated with the TiO2, which is demonstrated by the strong correlation between both. Finally, although the significances are greater than 0.05, SiO2 and Al2O3 are negatively correlated, which agrees with the value of SiO2/Al2O3 ratio.
3.2. Mineralogical analysis of clays
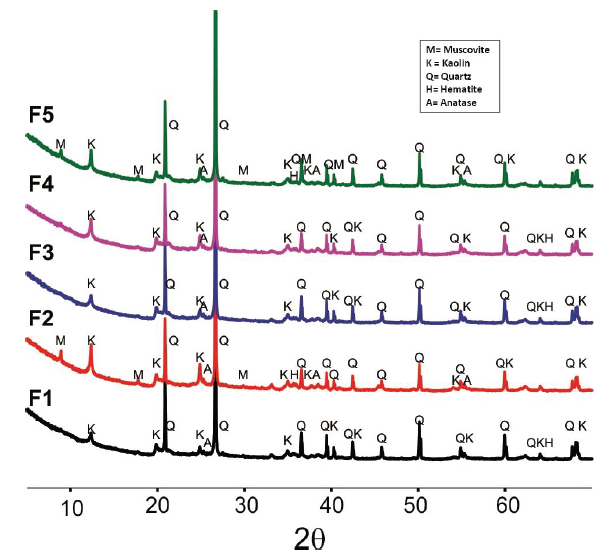
The analysed clays exhibited reflections mainly associated with kaolinite and quartz (Fig. 2), which are consistent with previous studies of clay materials from the Guayabo geological formation in Cúcuta [6] and with the Pearson correlation analysis to SiO2/Al2O3 ratio (shown in Table 1).
Source: The Authors.
Figure 2 . X-ray diffraction reveals the position of the diffractions of the raw clay samples and indicates the allocation of the main reflections
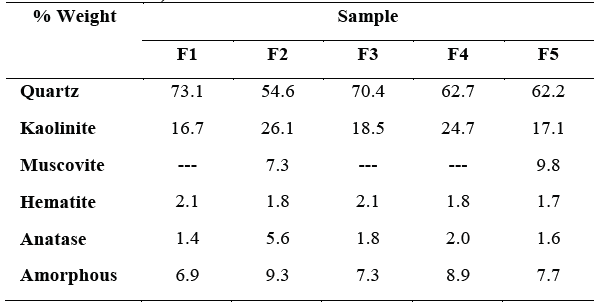
The F2 and F5 samples show the presence of muscovite, while the greater presence of potassium and iron in the results of Table 1 for these samples; could be correlated with the presence of this mineral [18]. Furthermore, all clays show small quantities of anatase and hematite. The analysis presented in Table 2 shows that the iron content as hematite (Fe2O3) is lower than that obtained by XRF (Table 1), this result sanctions the corroboration of the hypothesis that part of the iron can be structurally in the kaolinite, also in the muscovite or conformed the amorphous fraction. [9].
Table 2 Mineralogical composition of clays samples (Semi-quantitative analysis by Rietveld refinement).
Source: The Authors.
Chemical and mineralogical composition shows the presence of kaolinite as a predominant phase within the group of phyllosilicate minerals, therefore the analyzed samples could be classified as industrial kaolinite clays with a high quartz content.
3.3. Particle size distribution
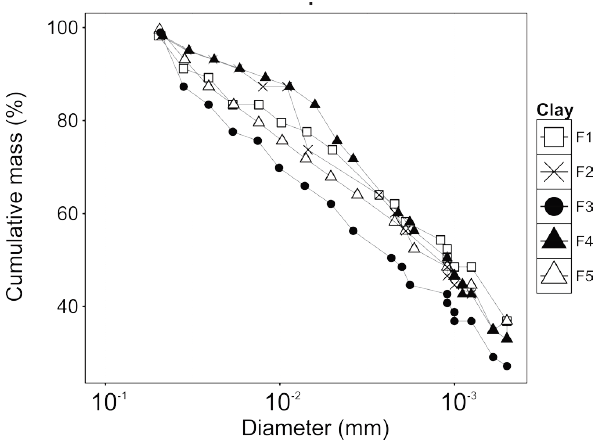
The particle size distribution analyses were adjusted according to the generalized linear model for a normal distribution (Fig. 3).
Source: The Authors.
Figure 3 Particle size distribution analysis of clay samples obtained by the hydrometer method.
The content of the fraction less than 0.002 mm for each clay sample is shown in Fig. 4. According to these results the potential use of clays is determined with the Winkler diagram [19].
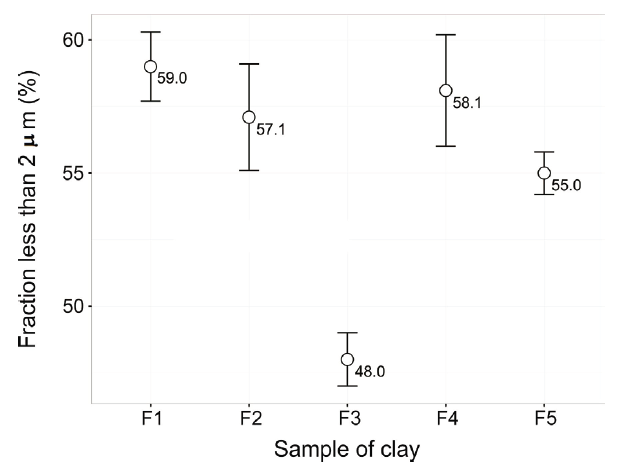
The particle size distribution analyses showed no significant differences between samples, except for F3 clay, with 48.0 ± 1.0% less than 0.002 mm.
The result obtained could be correlated with the high presence of quartz in this sample and larger phases, rich in aluminum according to the report of Tables 1 and 2.
The result of granulometry obtained for the F1 sample is interesting, because despite having a high quartz content in its structural composition, the fraction smaller than 2 microns is the highest within all the analyzed samples. This fact leads to suppose that the quartz has a very fine grain size, which could favor the reactions at high temperatures, promoting the formation of tridymite or cristobalite [20].
3.4. Uses of Clays
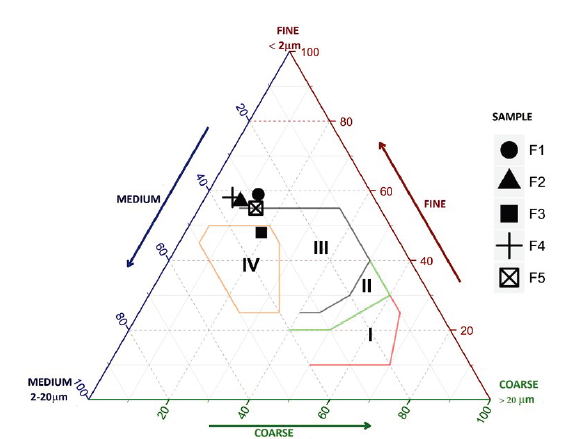
Winkler analysis of Murano Mine clays shows that clays F1, F2, F4 and F5 are suitable for the direct manufacture of tiles, while, the F3 can be used in the preparation of slabs and fine pavement (Fig. 5) [19,21,22].
Source: The Authors.
Figure 5 Winkler triangle. Zone I: solid brick; Zone II: perforated brick block; Zone III: tiles and light blocks; Zone IV: thin hollow brick wall and pavement.
However, the addition of a material with a suitable particle size distribution could modify the uses of Murano Mine clays [19]. This last fact is important if it is desired to decrease the plasticity of the ceramic paste or if it is intended to manufacture porous materials.
3.5. Plasticity
All samples are classified as inorganic of medium plasticity clays, according to its plasticity index (Table 3). Furthermore, F1 and F3 clays are in the limit of low and moderate plasticity [23].
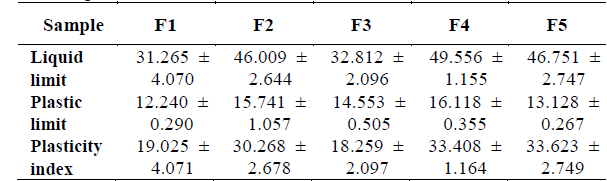
The lower plasticity of F1 and F3 can be associated to its chemical analysis (high SiO2), and by its semi-quantitative analysis of X-ray diffraction (mineralogical composition). The values of the plasticity index obtained are at an intermediate level compared to other reports found in the literature (between 15 and 49) [24], this fact highlights the potential of this material for use as a raw material in the ceramic industry.
3.6. Vitrification
The results show a direct relationship between the degree of vitrification and the characterization reports obtained. It is evidenced that the samples with greater presence of kaolinite, are those with a greater degree of densification, which presents a greater firing shrinkage (Fig. 6) and a lower percentage of water absorption (Fig. 7). The higher iron and potassium content may have played an important role in the results obtained.
Source: The Authors.
Figure 6 Firing shrinkage percentage of ceramics made with clay materials from Murano Mine at different firing temperatures.
Source: The Authors.
Figure 7 Water absorption percentage of ceramics made with clay materials from Murano Mine at different firing temperatures.
The lower vitrification of F1 may be associated with the high quartz content in the clay material and the lower concentration of flux oxides compared to F2 for example. F5 presents a level of intermediate vitrification, the presence of muscovite (rich in potassium and iron) allows for compensate of the effects of vitrification caused by the kaolinite deficit (only 17.1% compared to F2 which has 26.1%).
According to the analysis of variance (ANOVA) with 95% confidence, linear shrinkage is significantly different for clay samples and temperatures. Correspondingly, the water absorption shows the same behavior. However, a more detailed comparison test using Tukey analysis shows that between F3 and F5 samples there is not a significant difference (p = 0.524) in relation to the result of firing shrinkage. Tukey analysis shows that the F3 clay does not differ significantly from F1 (p = 0.870) and F5 (p = 0.105) clays, and F2 and F4 clays are not significantly different (p = 0.843) in relation to the behavior of the water absorption percentage.
4. Conclusions
The clays of Murano mine in the municipality of El Zulia, are suitable for the manufacture of ceramic building materials. Clays can be classified as kaolinitic raw materials. According to the data obtained for clays tested, these are suitable for direct use in the manufacture of tiles and light blocks.
Overall, the analyzed materials showed a bit variable behavior except clay F1, because it belongs to the front of this holding at the time of collection.
With the knowledge of the characteristics of these clays, companies can make better use of raw materials at the time of formulating the ceramic pastes and thus obtain higher quality products, a diversity of products, and a possible saving of time and money in the development of the ceramic process, for example, with the use of F2 it is possible to obtain products with low water absorption at a lower firing temperature.

