


 English (pdf)
 Article in xml format
 Article references
 Send this article by e-mail
 Cited by SciELO
  Cited by Google
  Similars in
SciELO
Similars in
SciELO  Similars in Google
 Permalink
Introduction
The study area lies at the south-eastern of the Cesar Sub-Basin, which is part of the Cesar-Ranchería Basin, located at the northern side of Colombia (Figure 1). The Cesar-Ranchería Basin borders to the east with the Perijá Range, to the west with the Sierra Nevada de Santa Marta, to the north with the main lineation of the Oca Fault and to the south with the trace of the Bucaramanga Fault (Barrero et al., 2007). The right side of Figure 1, the generalized column taken from Mesa and Rengifo (2011), shows the ages and thickness reported for each of the existing formations in the Cesar Sub-Basin. The stratigraphical/structural architecture, the main faults, truncated terminations, and onlap strata termination of the Cretaceous, Paleocene, and Neogene age formations are observed in the seismic lines, two-way time (Figure 2) as well as the stratigraphic position of ANH-La Loma-1 Well.
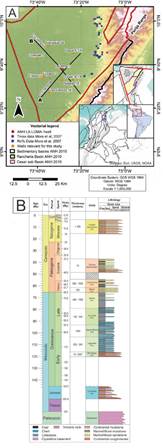
Figure 1 Location map, ANH-La Loma-1 Well, seismic lines used CV-1979-08, CV-1979-03, and wells with geochemical information. To the right, generalized stratigraphic column taken from Mesa and Rengifo (2011).
Multiple studies of potential hydrocarbon establish that this basin contains promising source rocks despite not having commercial hydrocarbon production (García et al., 2008; Hernández and Jaramillo, 2009; Mesa and Rengifo, 2011; Sánchez and Mann, 2015). Particularly, Martínez de Vivas et al. (2012) reported three maturation bands in the source rocks that increase towards the south-eastern of the Cesar-Rancheria Basin with potential for unconventional Liquid Gas type hydrocarbons. This study also highlights the subsurface “hydrocarbon shows” reported in wells within the clayey and calcareous formations of the Cretaceous, such as wet gas in the Cesar F-1 Well, light hydrocarbons in the Paso-3 and Paso-2 wells and commercial gas in the Compae Field Well.
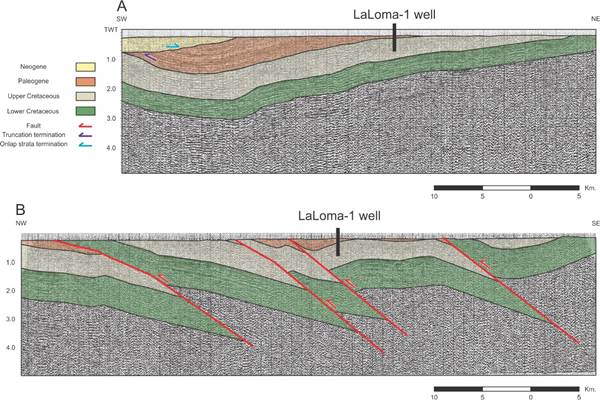
Figure 2 Interpreted 2-D seismic lines in Two-Way Time (TWT). A. CV-1979-08. B. CV-1979-03, with the location of ANH-La Loma-1 Well.
The geochemical properties of the Cesar Sub-Basin have been described in previous reports (Mesa and Rengifo, 2011) which indicate that the TOC values of the source rock vary from 0 to 5% in La Luna and Aguas Blancas formations, while Los Cuervos Formation presents TOC values of 16% in some mudstones. Aguas Blancas and La Luna formations have organic matter consisted of type II kerogen with capacity to generate liquid hydrocarbons, while Los Cuervos Formation has organic matter consisted of type III kerogen. Thermal values in La Luna, Aguas Blancas, and Lagunitas formations correspond from mature to postmature rocks (Mesa and Rengifo, 2011), with Tmax values from 430 to 475°C and 1.4 of %Ro. Likewise, Mora et al. (2007) processed 181 surface rock samples for TOC analysis and 81 surface samples for Rock-Eval pyrolysis analysis, concluding that La Luna and Ánimas formations must have mainly generated liquid hydrocarbons with gaseous in a lower proportion, while Los Cuervos Formation has favourable conditions for gas generation mainly because its organic matter consisted predominantly of type III kerogen. Correspondingly, Aguilera et al. (2010) reports that Lagunitas, Aguas Blancas, La Luna, and Molino formations have organic matter consisted of type II oil-prone kerogen, while Los Cuervos and Molino formations have organic matter consisted of type III kerogen. Furthermore, Aguas Blancas, La Luna, Molino, and Los Cuervos formations have reached early maturity to overmature conditions in the basin. Additionally, Hernández and Jaramillo (2009) processed 52 core samples for %Ro analysis in the Compae-1 Well for Aguas Blancas and Rio Negro formations and in the Diablito-1E Well for Molino Formation. Although only 7 %Ro measurements were conclusive, 4 of that data belong to the Molino Formation show values from 0.32 to 0.51%, 2 data from the Rio Negro Formation show values of 0.73 and 0.74%, and 1 data from the Aguas Blancas Formation show a value of 0.52%. These results indicate that the organic matter of the deeper samples would be in the oil window. Guo et al. (2018) made a geochemical characterization of sub-bituminous coals from Los Cuervos Formation, specifically from La Jagua and Calenturitas mines (Cesar-Ranchería Basin) and showed the results of %Ro measurements with values from 0.42 to 0.6%, TOC values from 68.5 to 86.0% and Rock-Eval pyrolysis analysis with Tmax values ranging from 419 to 435ºC, which allowed them to conclude that organic matter consisted predominantly of type III kerogen mixed with type II kerogen, the %Ro suggested that the studied coals are sub- bituminous from ranks B to A, which is confirmed by the Tmax values obtained.
This study presents new geochemical and petrographic analysis performed in core samples of source rocks from the ANH-La Loma-1 Well. The samples analysed belong to the Paleocene Los Cuervos Formation and the Upper Cretaceous Molino Formation. Geochemical data include the Rock-Eval pyrolysis of 113 samples, the TOC of 113 samples, and the vitrinite reflectance (%Ro) of 13 samples. Additionally, a petrographic characterization of 30 samples allowed the correlation of the lithology with the geochemical results. This study aims to establish the current maturity state and the potential for hydrocarbon generation (quality and quantity) of the rocks in the Los Cuervos and Molino formations. Furthermore, we would like to reproduce the burial history scenario through numerical modelling with the PetroMod® software (version 2012). The modelling is based on geochemical data, the stratigraphic/structural architecture, as interpreted by 2D seismic reflection data, and the different exhumation events of the Perijá Range (PR) reported by Kellogg (1984), Shagam et al. (1984) and Lugo and Mann (1995), that affected the burial history. It also provides insights that may help to understand the current maturity state, as well as the organic transformation ratios (TR) of other cretaceous formations underneath the Molino Formation. This is fundamental for any understanding of the organic geochemical characteristics of the Los Cuervos and Molino formations, as well as how the sub-basin was filled with sediments. It has direct implications regarding the maturation of organic matter of the units as well as the generation of hydrocarbons.
Geological setting and stratigraphy
During the early Cretaceous a basal conglomerate with gravels of metamorphic, igneous, and sedimentary composition of the Rio Negro Formation were deposited in paleo-depressions (Miller, 1962). This allows the configuration of a smooth topography that favours the deposition of carbonates towards the top of the formation (Gil and Martínez, 1990). Sarmiento-Rojas (2019) argue that the Rio Negro Formation was deposited in a fluvial to the transitional environment in an extensional rift setting, along the underlying unconformable Jurassic rocks from La Quinta Formation (Sánchez and Mann, 2015). Hernández (2003) indicated that the subsidence during the Late Aptian was continuous and that Lagunitas Formation was deposited upon an inner carbonate shelf. Lagunitas Formation corresponds to thick- bedded fossiliferous limestones and very thin-bedded calcareous shales (Sarmiento-Rojas, 2019). During the Albian to Cenomanian, Aguas Blancas Formation (Cesar-Ranchería Basin) and Maraca Formation (Maracaibo Basin) were deposited on an inner to middle marine shelf, controlled by relative sea-level changes (Sarmiento-Rojas, 2019). This transgression is evidenced by bio-micritic limestones and fossiliferous organic-rich shales, glauconitic sandstones, mudstones and sandy limestones (Mesa and Rengifo, 2011).
La Luna Formation was deposited during the Cenomanian to Coniacian on a passive margin setting (Sánchez and Mann, 2015). It corresponds to bituminous biomicrite (pelagic limestones), organic- rich calcareous mudstones, chert, concretions, and abundant content of planktonic and benthic foraminifera such as ammonites, and fish remains. It presumably occurred on an external part of the middle shelf (Mesa and Rengifo, 2011). During the Campanian and Maastrichtian, the Molino Formation was deposited in a deep marine environment that continued until the Middle Campanian (Hernández, 2003). Villamil (1999), determined that in the Maracaibo and Merida basins (Western Venezuelan) the Tres Esquinas Formation was deposited with the presence of glauconite and phosphates, which origin was from the Guyana Craton. Overlying the Tres Esquinas Member, in the area of Maracaibo and Merida basins (Western Venezuela), the Mito Juan and Colón formations were deposited upon an inner to the middle shelf (Sarmiento-Rojas, 2019). In addition, The Molino Formation has been correlated to the Colón - Mito Juan Formations of the Maracaibo Basin (Mesa and Rengifo, 2011).
During the Paleocene, the Barco and Los Cuervos formations were deposited in a continental environment as a product of a slow regression (Hernández, 2003). Barco Formation corresponds to quartz arenites with thin interlayered mudstones and coal (Mesa and Rengifo, 2011). During the Eocene, due to the Pre-Andean Orogeny, the accommodation space for the north of South America decreased significantly, accelerating the exhumation rate of the Central Mountain Range. Between the Eocene and Oligocene, the drainages of the Magdalena and Orinoco rivers took their current direction (Hoorn et al., 1995; Villamil, 1999). Throughout the Late Miocene-Pliocene, during the Andean Orogeny, the main uplift of the Serranía del Perijá was reported (Hernández, 2003). Finally, during the Pliocene-Pleistocene, fans, terraces and alluvial plains were formed covering the Cesar-Ranchería Valley (Hernández, 2003).
Data and methods
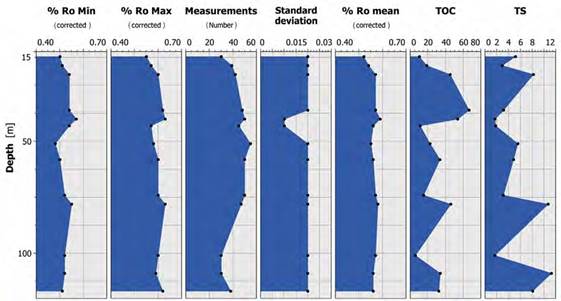
Geochemical analyses were performed to report the type of organic matter, current maturation stages, and potential to generate hydrocarbons in the Cesar Sub- Basin. Geochemical data were obtained using 113 core samples from Los Cuervos and Molino formations of ANH-La Loma-1 Well. The geochemical analyses include Rock-Eval pyrolysis analysis, TOC, and TS. Additionally, 13 vitrinite reflectance analysis (%Ro) were obtained through organic petrography. Also, 30 thin sections of samples rocks were described. Vertical sampling was not performed with symmetrical length values (Figure 3). The geochemical analysis and petrographic studies were carried out at the UIS Petroleum Geochemistry Laboratory (LGP) and UIS Petrographic Laboratory, respectively.
The petrographic studies revealed proportions of various minerals present and their spatial distributions in the rock that allowed the correlation of the petrography conditions with the geochemical results. The petrographic description method uses 300 equally spaced points across the thin section. The TOC analysis was carried out with the intention of quantifying the amount of organic matter present in the sample. To determine the percentage of TOC, the content of carbonates present in the sample was eliminated using HCl to dissolve inorganic CaCO3. After that, an automated analyzer Leco SC-144DR was used to establish the amount of TOC in each of the 113 rock samples which included both, kerogen, and bitumen. Together with the TOC, the mineral carbon content (MinC), the volume of free hydrocarbon generated before pyrolysis (S1), the amount of hydrocarbon generated during pyrolysis (S2), and the amount of emitted carbon dioxide (S3) were determined. It also allowed us to calculate the TS as well as the carbonate content. Likewise, to evaluate the quality of this organic matter, a Rock-Eval pyrolysis analysis was performed in each of the samples with Rock-Eval 6 technology equipment. This technique, presented by Barker (1974), Espitalie et al. (1977, 1985) and Behar et al. (2001), uses programmed heating steps of a small amount of rock (70 mg) or coal (30-50 mg) in an inert atmosphere (helium or nitrogen) in order to determine the quantity of free hydrocarbons present in the sample (S1 peak), as well as those that potentially can be released after maturation (S2 peak), and the amount of emitted carbon dioxide (S3). This procedure allows us to establish the Tmax and the current state of thermal maturation. Derivations of these parameters such as hydrogen index (HI), oxygen index (OI), production yield (PY) and production index (PI) were also used and calculated according to the following formulas (Law, 1999): HI = S2 / TOC × 100, OI = S3 / TOC × 100, PY = S1 + S2, and PI = S1 / S1 + S2. HI represents the amount of hydrogen relative to the amount of organic carbon present in a sample. OI represents the amount of oxygen relative to the amount of organic carbon present in a sample. The vitrinite reflectance (%Ro) was measured using Zeiss imager microscopy according to the method proposed by the ASTM D7708-14. The vitrinite reflectance analysis was carried out on core samples to evaluate the diagenetic changes of the organic matter (maturity level). The method starts after calibrating the equipment at an average of 42.61 %Ro, then readings were taken for each polished section. In the readings, the vitrinite macerals were identified on the polished surface, considering that the standard deviation of the 20 readings of %Ro per polished section must be less than 0.003. Geochemical information was plotted to visualize its distribution on profiles using free software PanPlot2 as described by Sieger and Grobe (2013). Six cross-plots, using geochemical data obtained, were made to illustrate and to interpret the results of the geochemical analysis. Interpretation of two 2D seismic lines (CV-1979-08, and CV-1979-03 provided by ANH) in two-way time (TWT) (Figure 2) were used in this research with the purpose of defining the cutting relationships between lithological units present in the basin. Additionally, they unveiled the geographic and stratigraphic position of the ANH-La Loma-1 Well used for this study.
Finally, a one-dimensional basin model was carried out with PetroMod software in order to reconstruct the burial history and thermal maturation of the geological units present in the well. This modelling used the vitrinite thermal maturation model (EASY %Ro) proposed by Sweeney and Burnham (1990), based on the Arrhenius first-order parallel-reaction approach with a distribution of activation energies. EASY %Ro was calibrated to a more rigorous model of vitrinite maturation based on the chemical properties of coal vitrinite. Previous studies, such as Mesa and Rengifo (2011), were also considered. Such studies provided the deposition ages of each unit, and the maximum and minimum thicknesses of the Rio Negro, Lagunitas, Aguas Blancas and lower part of the Molino formations. For Barco, Los Cuervos, and upper Molino formations we used the data obtained from ANH-La Loma-1 Well. The eroded thickness input for the modelling was inferred by the relation to the maximum thickness reported plus those found in the wells. The heat flow evolution was established by PetroMod software using the Mackenzie method, based on the sub-basin evolution proposed by Mesa and Rengifo (2011). It was established that the heat flow from the syn-rift stage goes from 200 to 116 mya and the post-rift stage from 116 to 20 mya, according to Mesa and Rengifo (2011). The Paleo-water depths (PWD) were estimated with biostratigraphic studies (e.g., Patarroyo et al., 2017). The PWD for La Luna and Molino formations, was estimated to be 0 m deep at 120 mya at the Rift stage according to Mesa and Rengifo (2011), which then increased to reach 100 m between 116-103 mya, then it increased to 200 m at 92 mya. Consequently, it was gradually decreased going through 100 m at 79 mya, after that 15m around 70 mya and remained around 0m to the present (Table 1). Sediment Water Interface Temperature (SWIT) was estimated using PetroMod software (e.g., Wygrala, 1989), which assumed that the current position of the study area is 11 degrees north latitude in the northernmost part of South America (Montes et al., 2019). To determine the evolution of the source rock units, the multiple kinetics based on lithologies were used (e.g., Di Primio and Horsfield, 2006). The IES_
TII_brown_limestone kinetic parameter was selected for Lagunitas, Aguas Blancas, La Luna, and Lower Molino formations, considering similarities between facies of these formations and the Brown Limestone Formation. For the middle Molino Formation, the kinetics parameter IES_TII_toarcian_shale was used since both formations present shale facies. For the Los Cuervos Formation, two different kinetic parameters were used, Handil_MahakamDelta_TIII kinetic for shales and IES_TIII_Tertiary_Coal_2C kinetic for coal facies.
Table 1 Paleo-batimetry conditions (PWD) vs time used to generate the geochemical modelling. 0 m deep during the early rift stage (120 mya) according to Mesa and Rengifo (2011).
| Age (mya) | PWD (m) |
|---|---|
| 0 | 0 |
| 50 | 0 |
| 70 | 15 |
| 79 | 100 |
| 92 | 200 |
| 103 | 100 |
| 116 | 100 |
| 120 | 0 |
Results
In this section we summarize the results obtained, corresponding to petrographic and geochemical analysis for ANH-La Loma-1 Well. Figure 3 shows a stratigraphic column with samples collected. Figures 4 and 5 show the geochemical results.
Petrographic results
The Molino Formation, in samples from LL1-1910.3-P to LL1-437.8-P (Figure 3), shows the presence of gastropods, trochospiral planktonic foraminifera, ostracods, phosphate fragments (bones), echinoderms with coating phosphate material, bryozoan shells and bivalve shells, bivalve fragments with lamellar shells, biserial benthic foraminifera shells, fragments and spicules of echinoderms, and phosphate fragments of teeth and carbonate recrystallization, with exception of some samples presenting angular quartz sandstone with straight extinction, phosphatic skeletal fragments, phosphatic intraclasts, reticulated algae, laminated ostracods fragments, bryozoan fragments, serpulid tubes, micro limestone matrix -granular and limestone cement; additionally, other samples present siltstone of angular and subangular quartz, finely laminated with flat-parallel structure, interstratified with organic material.
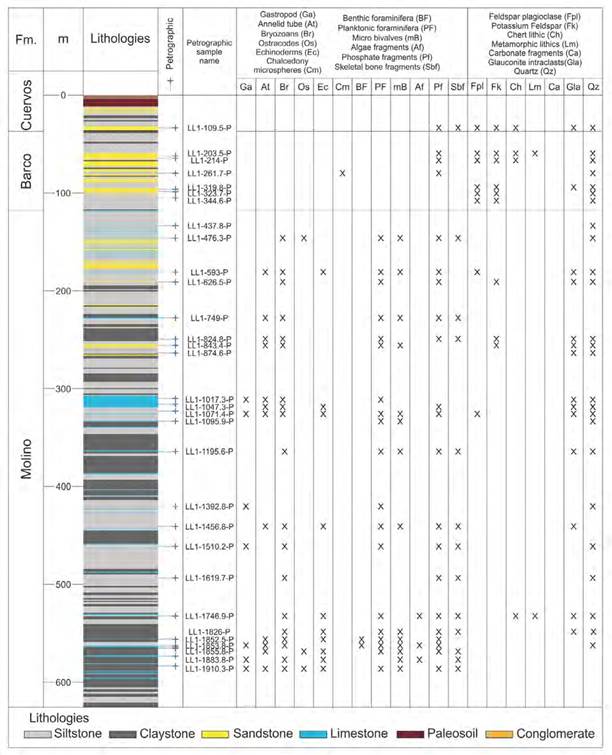
Figure 3 Lithologies, type of analysis, petrographic sample names, and main components presents in 30 thin sections from ANH-La Loma-1 Well.
From Barco Formation, in samples from LL1-344.6-P to LL1-203.5-P (Figure 3), there was presence of siltstone of angular and subangular quartz with straight extinction and feldspar with polysynthetic and Carlsbad twinning, amorphous silica, phyllosilicates, some clastic muscovite, finely laminated interstratified with organic material and sandstone of angular to sub-angular quartz, some quartz were banded, indicating that they are of metamorphic origin, there was also presence of feldspars and chert fragments, and fragments of phosphate material.
The sample LL1-109.5-P from Los Cuervos Formation (Figure 3) is composed of 40% angular and subangular quartz with straight extinction, 3% of altered kaolin feldspars, chert fragments and clastic muscovite with less than 1%, clayey siliceous matrix, phosphate fragments, 7% of chert, clastic muscovite, some fragments of phosphate bone, some zircons and glauconite.
The petrographic analysis from the Diablito-1E and Los Cerezos-1E wells, extracted from the technical report of the Drummond LTD. (2007), describes that, for the top of the Molino Formation there is presence of biomicrite, fine-grained glauconitic quartz arenites and sublitharenite, for the lower member of the Barco Formation, there is presence of mudstones with siderite and fine-grained litharenites with calcareous cement, for the upper member of the Barco Formation there is medium to fine-grained porous litharenites and sublitharenites, and for the lower member of the Los Cuervos Formation there is fine-grained micaceous and argillaceous litharenites. In the exploratory drilling carried out for the technical report of the Drummond LTD. (2007), six samples of the Verdesia- 2E well core were subjected to palynological and micropaleontological analysis; from these samples, the samples taken from 254.3 to 254.4 ft and from 384.6 to 384.7 ft presented a good recovery of palynomorphs, which indicates marine deposit environment with a high continental contribution, located within the Echimonocolpites protofranciscoi zone from Maastrichtian age, identified as the Molino Formation. In the Diablito-1E Well that crossed the Barco-Los Cuervos succession, samples were taken every 5ft for biostratigraphy analysis. The results indicate that the succession formed by the Barco and Los Cuervos formations is of Paleocene age. In addition, for the La Luna-3E Well, this document reported that the Molino Formation was drilled and traverses a monotonous range of dark gray, laminar shales, with algae fragments and echinoderms. Then, there is a sequence of dark biomicrite (packstones), more concentrated towards the top, and towards the base wackestones and mudstones, with the presence of uniserial planktonic and benthic foraminifera; additionally, bivalve shells and pyritization of foraminifera were reported. Ayala-Calvo (2009) states that the Molino Formation has siliceous laminar mudstone facies, packstones/ grainstones facies of bioclasts with glauconite and phosphates. The Molino Formation presents a predominance of siliceous mudstones and decreasing grain bioturbated calcareous cycles and packstones with glauconite and phosphates.
Lithologies and petrographic analysis from the ANH- La Loma-1 Well, compared against the existing bibliography for the Cesar Sub-Basin, indicate that the well crosses a sequence that goes from the Molino Formation to the base from Late Cretaceous age, followed by the Barco Formation from Early Paleocene age, ending up at the top with the Los Cuervos Formation from the middle to late Paleocene age.
Geochemical data
The geochemical values obtained from the Los Cuervos and Barco Formations in ANH- La Loma-1 Well samples were: S1 peak, indicating the volume of free hydrocarbon generated before pyrolysis, which varied from 0.03 to 10.71 mg HC/g rock. S2 values, indicating the amount of hydrocarbon generated during pyrolysis, showing variations from 0.15 to 256.14 mg HC/g rock, and S3 values, indicating the amount of carbon dioxide emitted, showing variations from 0.16 to 2.71 mgCO2/g rock.
The organic richness of the Los Cuervos and Barco Formations ranged from poor to excellent, according to Lewan and Allison (1996). The Paleocene rocks (12.4 to 127m depth) shows TOC values that range from 0.29 to 66.65%. The OI and HI were the most important parameters, of which the correlation indicated the kerogen type of source rocks. The OI value, as calculated, varied from 23.28 to 384.3 mg CO2/g TOC. The HI value, as calculated, varied from 3.88 to 73.9 mg HC/g TOC.
The TS is an important consideration in coal utilization. The TS obtained varied from 0.022 to 11.291 % w/w. The PY was the total amount of hydrocarbon generated/ liberated under the pyrolysis S1 and S2 curves (Ghori, 1998). This index helped to categorize the target horizon in terms of total petroleum-generation potential (Hazra et al., 2019). The PY values, as calculated, varied from 0.21 to 266.85 mg HC/g.
The PI value was taken from a ratio between S1 and S2, which indicated the relationship between the number of free hydrocarbons before pyrolysis with respect to the amount of hydrocarbon generated during pyrolysis, similar to Rock-Eval and Tmax. PI was used as a maturity proxy (Hazra et al., 2019). The PI values, as calculated in ANH- La Loma-1 Well, varied from 0.01 to 0.29 TOC. According to Peters (1986), source rocks with PI values lower than 0.1 TOC are considered thermally immature, while those from 0.1 and 0.4 TOC are considered thermally mature. According to Nuñez-Betelu and Baceta (1994), there is no depletion in the values of these two pyrolysis peaks since the samples were taken from the core and had not been exposed to weathering.
The Tmax values correspond to the maximum hydrocarbon generation point during the pyrolysis (S2), which is widely used as a thermal maturity indicator (Hazra et al., 2019). According to Peters and Cassa (1994) any value of Tmax lower than 435ºC is considered thermally immature (Figure 4). Tmax values obtained ranged from 416 to 436ºC, which indicated that Paleocene rocks are thermally immature, bordering on the limit of 435ºC.
The geochemical values obtained from the Cretaceous rocks in ANH- La Loma-1 Well samples were: S1 peak, as obtained, which varied from 0.03 to 0.85 mg HC/g rock. S2 values, which showed variations from 0.14 to 2.68 mg HC/g rock, and S3 values, which ranged from 0.13 to 1.42 mgCO2/g rock.
The organic richness of the Cretaceous rocks ranged from poor to very good, according to Lewan and Allison (1996). The Cretaceous rocks (131 to 625.8m depth) showed TOC values that ranged from 0.23 to 2.28%. The OI value, as calculated, ranged from 17.48 to 239.05 mg CO2/g TOC. The HI value, as calculated, varied from 16.45 to 238.42 mg HC/g TOC. The TS values obtained ranged from 0.001 to 1.391% w/w. The PY values, as calculated, ranged from 0.18 to 2.8 mg HC/g. The PI ranged from 0.04 to 0.46 %TOC. The Tmax values ranged from 413 to 442ºC which indicates that some Cretaceous rocks are in the inmature oil window, and some Cretaceous rocks are generating oil, according to Peters and Cassa (1994), both of them bordering on the limit of 435ºC (Figure 4).
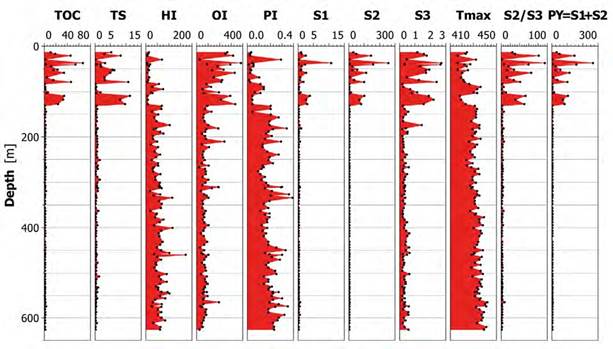
Figure 4 Graphic distribution of TOC, TS, and Rock-Eval pyrolysis from ANH-La Loma-1 Well core samples at the Cesar Sub-Basin.
The vitrinite reflectance analysis of 13 core samples in ANH- La Loma-1 Well are presented in Figure 5. The %Ro values, as obtained, varied from 0.49 to 0.59, with a standard deviation (sd) ranging from 0.01 to 0.02. The TS values, as obtained, varied from 1.61 to 11.29%.
The %Ro values correction was made due to suppression of vitrinite generated by presence greater than 1% of TS. The data correlation of TS vs %Ro was performed to determine the reflectance of suppressed vitrinite, according to Mukhopadhyay (1994), who established that the suppression occurs between values of 0.2 to 1.4 %Ro due to excess sulphur of more than 1% w/w. According to Carr (2000), who established that in some situations, vitrinite reflectance values may be either ‘suppressed’ or ‘enhanced’.
Data analysis and discussion
The geochemical data obtained indicate that Cretaceous rocks are mostly thermally mature, according to Peters (1986). The low vitrinite reflectance of vitrinite suppression may be caused by perhydrous vitrinite, impregnation of vitrinite with hydrogen-rich amorphous material, and in coals with high sulphur content (Carr, 2000). The data correlation of %Ro vs Tmax is presented in Figure 6 to show the change in thermal maturity of Los Cuervos Formation in the La Loma-1Well. Figure 6 shows a good correlation between data. The data of thermal maturation (%Ro and Tmax) reaching values from 415 to 425ºC, show a lithostatic charge of at least 3 kilometres of quartz sandstones, after the deposition of Los Cuervos Formation. Therefore, it is suggested that there was a continuous accumulation of sediments in the sub-basin. This accumulation of sediments ended in the Middle Eocene, when the uplift of Serranía de Perijá began, according to García et al. (2008)
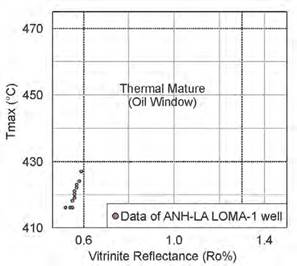
Figure 6 Data correlation of maximum pyrolysis temperature (Tmax) vs vitrinite reflectance (%Ro), to indicate source rock thermal maturity in the ANH-La Loma-1 Well rocks at the Cesar Sub-Basin.
Quality of organic matter
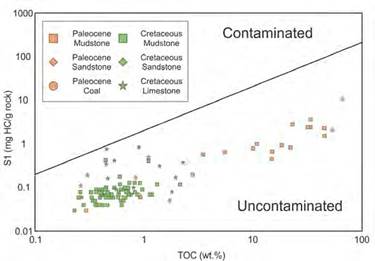
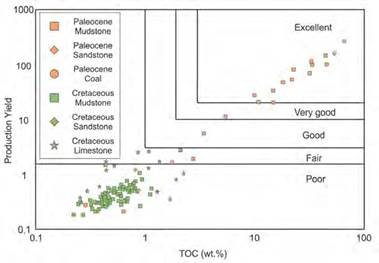
The cross-plot of S1 vs TOC (Figure 7) was used to evaluate the origin of the hydrocarbon in the Cesar Sub-Basin, using examples of the ANH-La Loma- 1 Well, based on the methodology of Fakhri et al. (2013). It was established that the Cretaceous and Paleocene rocks were no contaminated with migrated hydrocarbons. The hydrocarbon generation potential was proven using the cross-plot of PY vs TOC (Figure 8), based on the proposition by Ghori and Haines (2007). It concludes that the Paleocene mudstones had from good to excellent potential, the Paleocene coals had excellent potential, the Cretaceous limestones had from poor to fair potential, the Cretaceous sandstones had poor potential, and the Cretaceous mudstones had from poor to fair potential.
To assess the kerogen type, the data obtained from ANH-La Loma-1 Well were plotted on HI vs OI diagram, and the modified Van Krevelen diagram (Espitalie et al., 1985) (Figure 9). It concludes that the Cretaceous mudstones and limestones have the type II (oil/gas prone) and III (gas prone) kerogen, and the Paleocene rocks predominantly have type III kerogen (gas prone).
To assess the maturity and kerogen type, the data obtained were plotted on HI vs Tmax diagram (e.g., Peters and Cassa, 1994) (Figure 10). This showed the source rocks with more evolved organic matter, higher Tmax values, more thermally mature stage (Barker, 1974; Espitalie, 1986). It was concluded that, in the Cesar Sub-Basin rocks, the maturation stages increase with age. Both, Paleocene mudstones and coals with values of Tmax from 400 to 425ºC, have not reached the oil generation window, but they would have the capacity to generate mainly gas-type hydrocarbons due to its organic matter type III kerogen. Both, Cretaceous- aged mudstones and limestones with values of Tmax from 425 to 450ºC, are in the gas generation due to its organic matter type III kerogen (gas prone).
These findings are in concordance with Mesa and Rengifo (2011), who affirmed that the Cretaceous sequence, Lagunitas, Aguas Blancas, La Luna, and Molino formations, show very good characteristics as source rocks due to its organic matter type II/ III kerogen, and TOC values higher than 1%. These findings agree with the results reported by Mora et al. (2007), who stated that Los Cuervos Formation has favourable conditions for the generation of gas due to its organic matter, mainly type III kerogen, and it can generate some liquid hydrocarbons due to its organic matter type II kerogen.
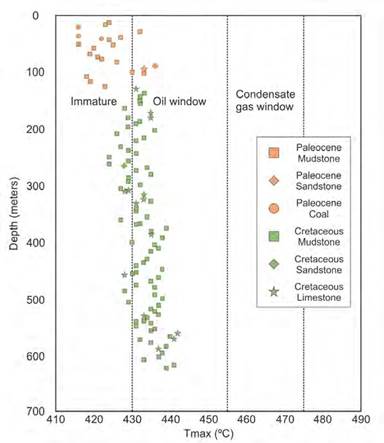
The cross plot of Tmax (ºC) vs PI as proposed by Katz (1995) was used to assess the maturation condition of the formations in the Cesar Sub-Basin (Figure 11). It can be seen that the Paleocene mudstone, sandstones and coal samples (with the exception of one case) occupy the immature area, which reinforce the immaturity of the Paleocene rocks of the sub- basin. Most of the Cretaceous mudstone, sandstones and limestone samples occupy the mature area. Tmax (ºC) data vs depth (Figure 12) as done by Peters and Cassa (1994), showed that there was no repetition of the sedimentary sequences in the ANH-La Loma-1 Well, and that there was no presence of displacement due to geological faults; a situation confirmed by the information obtained from the seismic interpretation, as well as from the drilling report.
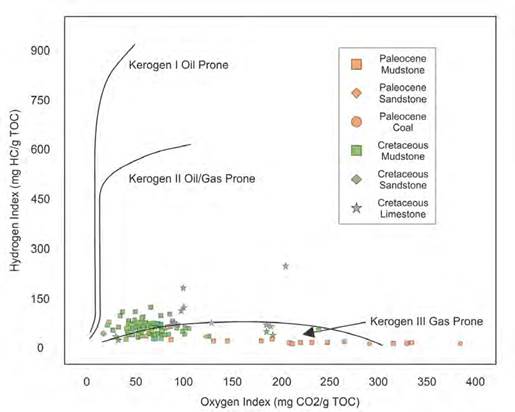
Figure 9 Van Krevelen diagram, cross-plot of hydrogen index vs oxygen index of ANH-La Loma-1 Well in the Cesar Sub-Basin.
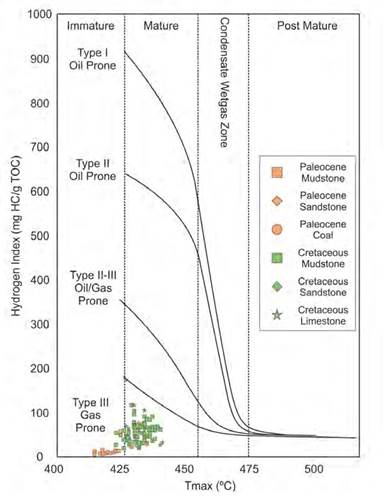
Figure 10 Cross-plot between Tmax (ºC) vs the hydrogen index (HI) of ANH-La Loma-1 Well in the Cesar Sub-Basin.
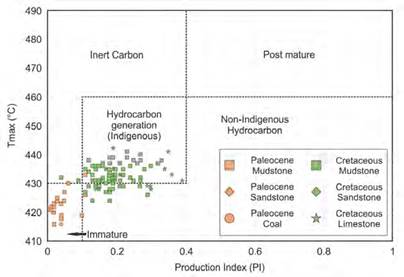
Figure 11 Cross-plot between production index (PI) vs pyrolysis Tmax (ºC) to identify source rock maturity for the ANH-La Loma-1 Well (Cesar Sub-Basin).
Geochemical Modelling
A one-dimensional model of burial history was performed in the location of the ANH-La Loma-1 Well using the information obtained from the interpretation of the seismic lines in time, the boundary conditions heat flow, the paleo-water depth, the SWIT (Figure 13) and the bottom hole temperature (BHT) of the wells (Figure 15B).
The geological input parameters used in the modelling of burial history are presented in Table 2. Initially, the Lower Cretaceous Rio Negro Formation has 220 m of continental conglomerates and mudstones intercalation deposited from 120 to 116 mya. It is overlain by 371 m of limestones and marine/littoral mudstones intercalation from Lagunitas Formation from 116 to 103 mya. Then, 198 m of limestones and marine/ littoral mudstones and sandstones from Aguas Blancas Formation deposited from 103 to 92 mya. From 92 to 79 mya, 340 m intercalation of limestones, cherts, and marine/littoral mudstones with some calcareous concretions from La Luna Formation were deposited. Then, 521 m of marine/littoral mudstones, limestones and sandstones from Molino Formation was deposited from 79 to 65.5 mya. Around 65.5 mya, a large erosive event occurred that eroded 100 m from the Molino Formation. From 63 to 55 mya, 998 m of the non- marine sandstones, claystones and siltstones of Barco and Los Cuervos formations were deposited, with 78 and 920 m thickness, respectively. Then, during the erosional event of the Middle Eocene, 900m of the Los Cuervos Formation were eroded. From 48.6 to 37.2 mya, 3200 m of the Eocene Sedimentites Unit were deposited. Then, from 37 to 21 mya, in the location of ANH-La Loma-1 Well, an erosive event occurred related to the uplift of the Serranía de Perijá eroding the Eocene Sedimentites Unit. From 16 to 12 mya, 200m of the Cuesta Formation was deposited, and finally, from 12 mya to the present the whole record of this formation was eroded.
Table 2 Geological input parameters used for one-dimensional modelling of ANH-La Loma-1 Well.
| Layer | Thick. (m) | Eroded (m) | Depo. from (mya) | Depo. to (mya) | Eroded from (mya) | Eroded to (mya) | Lithology (mya) |
|---|---|---|---|---|---|---|---|
| Cuesta Fm | 0 | 200 | 16 | 12 | 12 | 0 | 0 Conglomerate (typical) |
| Eocene sedimentites | 0 | 2600 | 48.6 | 37.2 | 37.2 | 21.79 | Sandstone (typical) |
| Los Cuervos Fm. | 7 | 900 | 61.53 | 55.8 | 21.79 | 16 | Shale (typical) |
| Los Cuervos Fm. [Paleosol] | 8 | - | 61.58 | 61.53 | - | - | Sandstone (typical) |
| Los Cuervos Fm. [Coal] 1 | 1 | - | 61.59 | 61.58 | - | - | Coal (pure) |
| Los Cuervos Fm. [Mudstone] | 13 | - | 61.66 | 61.59 | - | - | Shale (organic rich, 20% TOC) |
| Los Cuervos Fm. | 6 | - | 61.71 | 61.66 | - | - | Siltstone (organic lean) |
| Barco Fm. [Sandstone] | 23 | - | 62.09 | 61.71 | - | - | Sandstone (typical) |
| Barco Fm. [Siltstone] | 6 | - | 62.19 | 62.09 | - | - | Siltstone (organic lean) |
| Barco Fm. [Mudstone] | 49 | - | 63 | 62.19 | - | - | Shale (organic rich, 1% TOC) |
| Upper Molino Fm. | 0 | 100 | 69.3 | 65.5 | 65.5 | 63 | Shale (typical) |
| Middle Molino Fm. | 17 | - | 69.6 | 69.3 | - | - | Sandstone (typical) |
| Middle Molino Fm. [Mudstone] | 44 | - | 70.5 | 69.6 | - | - | Shale (organic rich 1-2%, typical) |
| Middle Molino Fm. | 134 | - | 72.8 | 70.5 | - | - | Siltstone (organic lean) |
| Middle Molino Fm. [Limestone] | 7 | - | 72.9 | 72.8 | - | - | Limestone (organic rich - typical) |
| Lower Molino Fm. [Limestone] | 30 | - | 73.5 | 72.9 | - | - | Limestone (organic rich 1-2% TOC) |
| Lower Molino Fm. | 159 | - | 76.5 | 73.5 | - | - | Siltstone (organic lean) |
| Lower Molino Fm. | 130 | - | 79 | 76.5 | - | - | Shale (organic rich, typical) |
| Upper La Luna Fm. | 57 | - | 82 | 79 | - | - | Chert |
| Middle La Luna Fm. | 185 | - | 88 | 82 | - | - | Shale (organic rich, 8% TOC) |
| Lower La Luna Fm. | 98 | - | 92 | 88 | - | - | Limestone (Chalk, typical) |
| Upper Aguas Blancas Fm. 66 | 66 | - | 95 | 92 | - | - | Limestone (Chalk, typical) |
| Middle Aguas Blancas Fm. | 66 | - | 100 | 95 | - | - | Sandstone (typical) |
| Lower Aguas Blancas Fm. | 66 | - | 103 | 100 | - | - | Shale (organic rich, 2% TOC) |
| Upper Lagunitas Fm. | 166 | - | 107 | 103 | - | - | Limestone (Chalk, typical) |
| Middle Lagunitas Fm. | 70 | - | 110 | 107 | - | - | Limestone (micrite) |
| Lower Lagunitas Fm. | 135 | - | 116 | 110 | - | - | Limestone (Chalk, typical) |
| Upper Rio Negro Fm | 80 | - | 117 | 116 | - | - | Conglomerate (typical) |
| Middle Rio Negro Fm | 60 | - | 119 | 117 | - | - | Siltstone (organic lean) |
| Lower Rio Negro Fm | 80 | - | 120 | 119 | - | - | Conglomerate (typical) |
| 120 |
The Heat Flow (HF) values were calculated using the Mckenzie crystal model option (McKenzie, 1978), considering that the heat flow for the Cesar Sub-Basin is conditioned by local tectonic dynamics. The syn-rift phase goes from 200 to 116 mya (Mesa and Rengifo, 2011) and ends with the deposition of the Rio Negro Formation; the greatest heat flow occurred during this phase, reaching 57.88 mW⁄m2 (milliWatt per square meter) during the Lower Cretaceous. After this, the basin entered the post- rift stage and gradually cooled down until it reached the current heat flow of approximately 34.65 mW⁄m2 (Figure 13). The EASY %Ro was calibrated with paleo- geothermometer data (%Ro and Tmax) using samples extracted from the Los Cuervos Formation (Figure 14A and 14B). Figure 14A shows an excellent fit of the values modelled and measured for %Ro and Tmax.
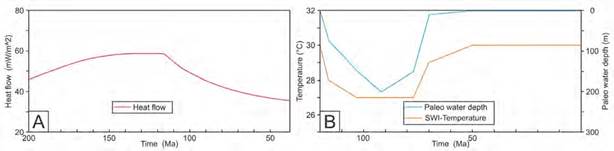
Figure 13 Boundary conditions: A. Heat flow. B. Paleo water depth and SWIT, used for 1D modelling of burial history of the lithological units in the ANH-La Loma-1 Well.
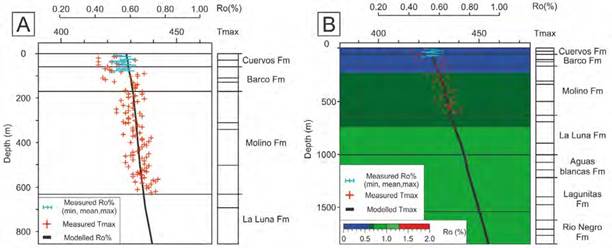
Figure 14 A. Calibration of measured %Ro and Tmax with depth in ANH-La Loma-1 Well. B. Calibration of measured %Ro and Tmax in-depth projection.
The model of burial history (Figure 15), shows that, around 60 mya, the Lagunitas Formation entered in the early oil window. Towards 45 mya, it approached the peak of the increase in values of %Ro. Around 60 mya, the Aguas Blancas Formation entered in the early oil window, and around 40 mya, it approached the peak of hydrocarbon generation, according to the %Ro. Around 40 mya, La Luna Formation approached the oil window, and around 30 mya, it approached the hydrocarbon generation peak, according to the %Ro. Finally, from 40 mya to 0, the Molino Formation entered into the early oil window. According to the vitrinite reflectance diagram (Figure 14B and 15) and, it is expected that the Molino Formation and upper part of the La Luna Formation would be in the early oil window since before the Upper Eocene uplift event. While Aguas Blancas and Lagunitas formations would be at the oil window since the Late Paleocene. After this time, it is expected that its thermal maturation did not progress any further. Additionally, the Los Cuervos Formation is immature in the well. The higher maturation levels in the ANH-La Loma-1 Well might have been reached for the other source rock of Cretaceous formations.
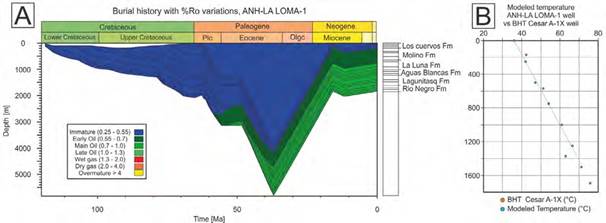
Figure 15 A. Burial history with respect to the increase in %Ro in the time expected for ANH-La Loma-1 Well. This figure is an in-depth projection of ANH-La Loma-1 Well. B. BHT modelled of ANH-La Loma-1 and Cesar A-1X wells.
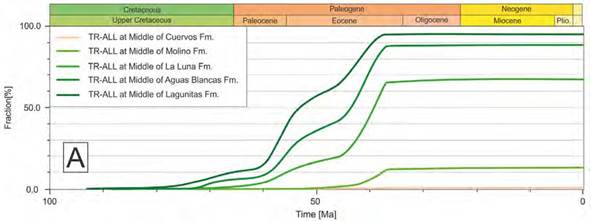
The thermal stress can be measured using the Tmax and %Ro values, which is necessary to evaluate the amount of organic matter transformed into hydrocarbon (Pepper and Corvi, 1995). This has could be to explain the scatter in the transformation rates (TR) observed in Figure 16. As a result, the TR were not expected in the study area for Los Cuervos Formation. The TR estimated for the Cretaceous Lagunillas, Aguas Blanca, La Luna, and Molino formations in the ANR-La Loma-1 Well had values of 94, 89, 68, and 12%, respectively. The Lower Cretaceous formations have a greater advance in their TR value at the end of the Paleocene, while the Upper Cretaceous units had almost all their TR increase during the Eocene. This establishes two pulses of hydrocarbon generation in the Paleocene and the Eocene, respectively. This shows that the study area in the Los Cuervos Formation is not in the oil window.
Conclusions
The mudstone of the Los Cuervos Formation, with 15 samples analysed, showed 20.72% TOC value on average and the presence of organic matter consisting of mixed type III kerogen. It supported a good source rock potential to produce gas type hydrocarbons.
The coals of the Los Cuervos Formation, with 2 sample analysed, presented an average of 60.16% TOC value and the presence of organic matter consisting of type III kerogen. The intervals indicated evidence of excellent gas-generating hydrocarbon.
The mudstones of the Barco Formation, with 8 sample analysed, presented an average of 1.61% TOC value and the presence of organic matter consisting of type III kerogen. It supported a good source rock potential to produce gas type hydrocarbons.
The limestone of the Molino Formation, with 14 sample analysed, presented an average of 0.84% TOC value and the presence of organic matter consisting of type II/III kerogen. Evidence of poor to fair source rock potential to produce oil/gas type hydrocarbons.
The mudstone of the Molino Formation, with 70 samples analysed, presented an average of 0.57% TOC value and the presence of organic matter type II/III kerogen. It supported a poor source rock potential to produce oil/gas type hydrocarbons.
The Los Cuervos Formation in the ANH-La Loma- 1 Well is in the immature stage, but close to the oil window. The Molino Formation in the ANH-La Loma- 1 Well is in the mature stage, but close to the main oil window.
According to the modelling carried out to the ANH- La Loma-1 Well, the Cretaceous formations (Rio Negro, Lagunitas, Aguas Blancas, La Luna, Molino) entered the hydrocarbon generation phase between 60 and 40 mya. The Lagunitas, Aguas Blancas, and La Luna formations approached the peak of hydrocarbon generation between 40 and 30 mya.
Similarly, through the modelling and with %Ro and Tmax data, it is concluded that La Luna formation is in the generation phase and has transformation ratios of 68%, while Lagunitas and Aguas Blancas formations are in the generation phase and have transformation rates of 89% and 94%, respectively.
The petrographic analysis indicates that the Molino Formation was deposited in a marine environment under oxidizing conditions, indicated by the presence of mainly benthic microfossils. Although, the environment was marine, the potential for preservation of organic matter is low because there were no anoxic conditions at the bottom. Petrographic analysis indicate that the rocks from the Molino Formation are fine-grained rocks with hydrocarbon potential, but geochemical data indicate that the Molino Formation is not proven to be a good source rock.

