


 text in
  English (pdf)
 Article in xml format
 Article references
 Send this article by e-mail
 Cited by SciELO
  Cited by Google
  Similars in
SciELO
Similars in
SciELO  Similars in Google
 Permalink
Introduction
Nonalcoholic fatty liver disease (NAFLD) or fatty liver disease is characterized by excessive fat accumulation in the liver and is associated with insulin resistance1. A histological analysis defines it as the presence of steatosis in 5% or more of the hepatocytes. Fatty liver disease is diagnosed through biopsy or imaging and radiology, usually after detecting fat through ultrasound and after ruling out secondary causes of hepatic steatosis such as alcohol consumption greater than 20 g/day for men and greater than 10 g/day for women, hepatotoxic drugs intake, hepatitis B and C virus, hemochromatosis, autoimmunity, and other chronic liver disease causes2.
Fatty liver disease is associated with obesity, diabetes mellitus (DM), dyslipidemia, and high blood pressure and is considered the hepatic manifestation of metabolic syndrome (MS)3. Most patients with fatty liver disease have hepatic steatosis without fibrosis in its initial phase and a good long-term prognosis4. Other patients have fibrosis and inflammation or steatohepatitis (intermediate phase) and may progress to the final stage of fibrosis or cirrhosis with an additional risk of developing hepatocellular carcinoma (HCC)5.
It is important to identify patients with fatty liver during the disease’s different stages and, according to findings, provide them with a treatment to prevent the progression of fibrosis. Given their poor prognosis, complications such as esophageal varicose veins, hepatic impairment, and HCC should be evaluated in patients with cirrhosis6,7. Currently, liver biopsy has remained the gold standard for assessing the degree of liver fibrosis8. However, since this is an invasive test, it can cause pain, bleeding, and even death9. Therefore, non-invasive methods to assess the degree of fibrosis in patients with fatty liver disease are becoming increasingly common due to the invasive nature of biopsy and its complications10.
There are several clinical scoring systems and non-invasive methods in medical practice. Some of these methods include the aspartate aminotransferase index (AST)/platelet count11, the relationship between AST/alanine aminotransferase (ALT)12, transient elastography (FibroScan), magnetic resonance elastography (MRE), and real-time elastography (RTE)13 or SuperSonic; the latter is a non-invasive test recently used in Colombia. The RTE test determines liver elasticity and calculates the grade of liver fibrosis. Sometimes, the RTE test supersedes liver biopsy and is useful for monitoring most patients with hepatopathies14.
The objective of this study is to evaluate the association between body mass index (BMI) and the degree of liver fibrosis in patients diagnosed with fatty liver in a hepatology center in Bogotá, Colombia.
Patients and methods
Population
Between January 1 and December 30, 2017, a case-control study of patients diagnosed with fatty liver disease was conducted through ultrasound or other imaging methods during hepatology consultation check-ups that would have undergone real-time elastography (SuperSonic) at Centro de Enfermedades Hepáticas y Digestivas (CEHYD) in Bogotá. We considered cases of patients who showed some degree of fibrosis and performed controls on participants with fatty liver without fibrosis determined as F0. We excluded patients who reported alcohol consumption (> 10 g in women and > 20 g in men per day), positive markers for hepatitis B virus (HBV) and hepatitis C virus (HCV), autoimmunity, hemochromatosis confirmed through a genetic study, or hepatotoxic drugs intake.
Variables
The variables included age, gender, metabolic syndrome condition, high blood pressure, BMI, transaminase level, AST/ALT ratio, dyslipidemia, glycemia, insulin, and degree of fibrosis.
Operational definitions were made according to the following criteria: the presence of metabolic syndrome and dyslipidemia, according to the Adult Treatment Panel III guidelines (ATP III)15; high blood pressure, according to the JNC8 guidelines; DM, according to the American Diabetes Association criteria (ADA)16; overweight and obesity, according to the World Health Organization criteria (WHO)17. Liver fibrosis determination was performed through real-time elastography (SuperSonic) using the Aixplorer ultrasound system (SuperSonic Imagine S. A. Aix-en-Provence, France) with a convex broadband probe (SC6-1). Values between 5.1 and 6.8 kPa, F2 between 7.2 and 8.3 kPa, F3 between 9.2 and 10.1, and F4 between 12.8 and 18.8 kPa were considered F0-F1.
Source of information
Project format: we used patients’ medical records as a secondary source in a consultation at a hepatology center in Bogotá.
Data collection plan and analysis
We used a format proposed for the data collection study that included the variables. Data was tabulated using the Stata 12 program and the Excel program database, creating the tables with their statistics and graphs, respectively.
Information was taken from patients diagnosed with fatty liver disease who met inclusion criteria to establish the degree of fibrosis and its relationship with BMI.
Continuous variables were described using measures of central tendency and standard deviation. Categorical variables were described with numbers and percentages. A 95% confidence interval (CI) was considered statistically significant.
Results
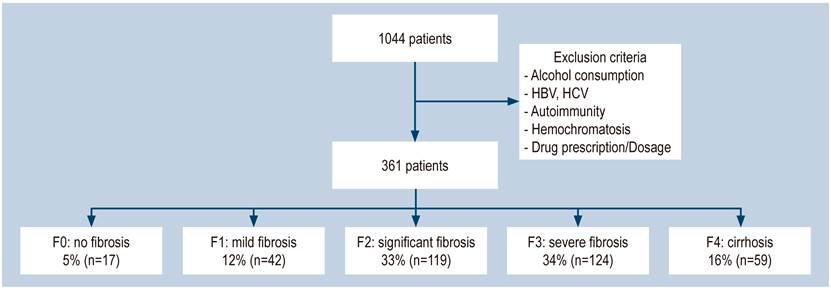
We excluded 683 patients from a group of 1044 seen between January and December 2017 because they did not meet the inclusion criteria or their information was incomplete. Included in the study were 361 patients (Figure 1), from whom 58% were women, with an average age of 57 years, a minimum age of 16 years, and a maximum of 90 years.
The overweight prevalence in this study was 49.2% (n = 177), with a BMI average of 26 ± 3.9, while the obesity prevalence was 20.7% (n = 75). The mean abdominal perimeter was 94 ± 10 cm. Twenty-seven percent (n = 99) had a complete metabolic syndrome. High blood pressure was observed in 28% (n = 101), DM, 17.7% (n = 64); impaired fasting glycemia (IFG), 27.9% (n = 101), and hyperinsulinemia in 56.9% (n = 205) (Table 1).
Table 1 Demographic, biochemical, metabolic, and diagnostic characteristics of liver fibrosis disease
| Variable | Men | Women |
|---|---|---|
| Age (years) | 41.3 (149) | 58.7 (212) |
| Mean BMI (kg/m2) | 27 | 27 |
| MS (%/n) | 72.6 (262) | 27.4 (99) |
| HBP (%/n) | 72 (260) | 28 (101) |
| DM (%/n) | 82.2 (297) | 17.7 (64) |
| Glycemia > 100 mg/dL | 72 (260) | 28 (101) |
| HDL< 40 mg/dl (%/n) | 42.7 (154) | 57.3 (207) |
| TGs>150 mgs/dl (%/n) | 55.7 (201) | 44.3 (160) |
| Degree of fibrosis | ||
| F0 | 41.2 (7) | 58.8 (10) |
| F1 | 42.9 (18) | 57.1 (24) |
| F2 | 39.5 (47) | 60.5 (72) |
| F3 | 41.9 (52) | 58.1 (72) |
| F4 | 42.4 (25) | 57.6 (34) |
| Total | 146 | 212 |
| BMI classification | ||
| % | n | |
| Healthy weight | 30.1 | 109 |
| Overweight | 49.2 | 177 |
| Obesity | 20.7 | 75 |
| Total | 100 | 361 |
DM: diabetes mellitus; HDL: high-density lipoprotein; HBP: high blood pressure; BMI: body mass index; MS: metabolic syndrome; TGs: triglycerides.
We found 207 (57.3%) patients with a decreased HDL level and 160 (44%) of patients had > 150 mg/dL triglycerides levels. 81.5% (n = 294) of patients had a > 1 ALT/AST ratio, which is an indicator of liver fibrosis.
When measuring fibrosis with real-time elastography, 95.2% (n = 344) of the patients showed an alteration (11% mild fibrosis, 32% significant fibrosis, 34% severe fibrosis, and 16% cirrhosis), and only 4% of the patients showed a completely normal liver.
No statistically significant differences were found between the degree of fibrosis and gender (odds ratio (OR): 0.9; CI: 0.3-2.9). Unhealthy weight is associated with severe fibrosis F3 (OR: 3.24; CI: 1.03-10) and cirrhosis F4 (OR: 2.33; CI: 2.33-42.99) (Figure 2). No statistically significant differences were found between BMI impairment and any degree of fibrosis (OR: 2.74; CI: 0.90-8.40). Risk probability estimation between fibrosis and obesity was impossible because this group lacked fibrosis-free checks.
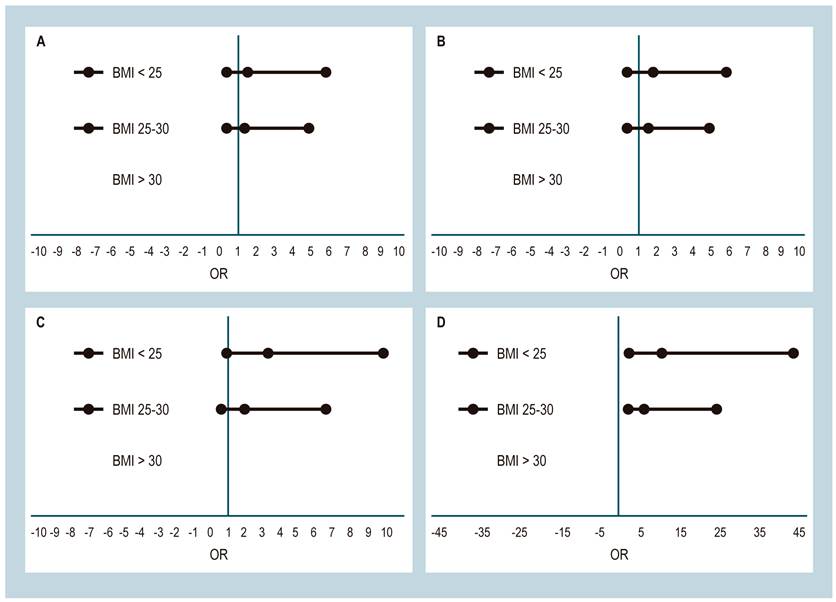
Figure 2 Association between liver fibrosis and BMI. A. Association between mild fibrosis and BMI. B. Association between significant fibrosis and BMI. C. Association between severe fibrosis and BMI. D. Association between cirrhosis and BMI.
Women and men with larger abdominal circumference are 9.4-fold more likely to increase the risk of cirrhosis (CI: 2.41-39.64). High blood pressure was not associated with developing fibrosis to any degree, while the presence of DM has a 10-fold risk of ending in F4 cirrhosis, especially in patients with poor disease control (OR: 5.16; CI: 1.23-30.33). These values were unchanged with the logistic regression model (Table 2).
Table 2 Association between degrees of liver fibrosis and BMI
| Dependent/independent variable | Adjusted OR | 95%CI |
|---|---|---|
| Fibrosis/Gender | 0.99 | 0.37-2.67 |
| Fibrosis/BMI | 2.74 | 1.02-7.31 |
| Fibrosis/overweight | 1.90 | 0.71-5.08 |
| Fibrosis/obesity | NA | |
| F1 fibrosis/BMI | 1.64 | 0.53-5.14 |
| F1 fibrosis/overweight | 1.32 | 0.61-4.11 |
| F1 fibrosis/obesity | NA | |
| F2 fibrosis/BMI | 1.85 | 0.66-5.14 |
| F2 fibrosis/overweight | 1.57 | 0.54-4.34 |
| F2 fibrosis /obesity | NA | |
| F3 fibrosis/BMI | 3.24 | 1.15-9.09 |
| F3 fibrosis/overweight | 2.03 | 0.71-5.80 |
| F3 fibrosis /obesity | NA | |
| F4 cirrhosis/BMI | 9.93 | 2.78-35.48 |
| F4 cirrhosis/overweight | 5.25 | 1.43-19.22 |
| F4 cirrhosis/obesity | NA | |
| Fibrosis/DM | 3.58 | 0.46-27.55 |
| F1 fibrosis/DM | 2.16 | 0.23-20.02 |
| F2 fibrosis/DM | 1.74 | 0.21-14.74 |
| F3 fibrosis/DM | 3.64 | 0.45-28.8 |
| F4 cirrhosis/DM | 10.22 | 1.26-82.3 |
| Fibrosis/Glyc > 100 mg/dL | 1.85 | 0.52-6.61 |
| F1 fibrosis/Glyc > 100 mg/dL | 1.09 | 0.25-4.75 |
| F2 fibrosis/Glyc > 100 mg/dL | 1.24 | 0.33-4.55 |
| F3 fibrosis/Glyc > 100 mg/dL | 1.76 | 0.47-6.51 |
| Cirrhosis F4/Glyc > 100 mg/dL | 5.16 | 1.26-2.39 |
Discussion
Fatty liver disease is a metabolic disorder with a 20%-40% prevalence in Western countries18, 12%-30% in Asia19, and an overall prevalence between 20% and 25%20,21. The disease severity increases with risk factors, which is found in 10%-20% of individuals with healthy weight, 50% overweight, and 80% with obesity22.
Non-alcoholic fatty liver disease is a condition ranging across a spectrum of liver damage from steatosis to steatohepatitis with variable fibrosis and leading to cirrhosis with normal or elevated ALT values23. This disease is associated with some conditions, including metabolic syndrome, DM, obesity, high blood pressure, and dyslipidemia24. The metabolic syndrome is characterized by a group of risk factors that favor insulin resistance25; among these, BMI alteration is an important factor for developing NAFLD26. Additionally, we found that, among patients with fatty liver disease, 30.1% had a < 25 kg/m2 BMI; 49.2%, had between a 25 and 30 kg/m2 BMI, and 20.7%, had a > 30 kg/m2 BMI. Furthermore, this study showed an association between BMI alteration and the development of severe and advanced fibrosis, which was statistically significant (Table 2).
Several studies showed the association between fatty liver disease and DM27. An Italian study with 458 patients found that DM was the most important marker for fatty liver disease and a higher degree of fibrosis (OR: 1.97; 95%CI: 1.2-3.7)28. This study shows that 82.2% of men and 17.7% of women had DM. When adjusting the data for the association between severe fibrosis F3 and cirrhosis, we found an association between DM (OR: 10.22; 95 % CI: 1.36-44.6) and impaired fasting glycemia (OR: 5.16; 95 % CI: 1.23-30.33).
This study confirmed that fatty liver could occur at any age, though it is not a risk factor4 since no statistically significant association between age and sex was found in our patients.
In addition, 20% of patients with NAFLD develop cirrhosis29. In this study, cirrhosis was found in 16.3% of the entire series, with a slight predominance in women: 57.6% versus 42.4%.
However, this study is limited since it was a case-control study, and there was a selection bias in the check-ups group because all the participants were overweight or obese. In future studies, we can improve this aspect by increasing the number of participants. In summary, it was impossible to evaluate the association between abdominal perimeter and cirrhosis due to under-reporting in the medical histories.
Conclusions
The study found a statistically significant association between an abnormal BMI and glycemic profile and severe and advanced fibrosis development. Therefore, further surveillance and evaluation of patients with fatty liver disease are necessary for clinical practice to prevent fibrosis progression.

