


 English (pdf)
 Article in xml format
 Article references
 Send this article by e-mail
 Cited by SciELO
  Cited by Google
  Similars in
SciELO
Similars in
SciELO  Similars in Google
 Permalink
1. Introduction
Mining-induced surface deformation will cause geological disasters, such as collapse pits, cracks, and subsided steps on the surface, and damage to surface structures, water bodies, and railways, seriously affecting residents' normal production and life in mining areas. Therefore, real-time and high-precision monitoring, prediction, and early warning of surface disasters are significant for safe and efficient production and environmental protection in mining areas (Chen et al., 2018; Yang et al., 2022).
It is a traditional way to monitor the surface deformation of mines
by laying out observation lines based on the strike and dip of the working panel (He, Yang, & Ling, 1991). This method has high measurement accuracy but is costly, time-consuming, and highly labor intensive, with a small and non-continuous monitoring range (Zhu, Yang, & Li, 2019). At the same time, it uses "point" to an "area" to study the subsidence law of the working panel, which may reduce the monitoring reliability (Zebker, & Goldstein, 1986).
InSAR technology can realize all-day, large-scale monitoring and is not easily affected by climate. It has been applied to synthesize topographic maps and obtain surface deformation values over time intervals. However, its limitations must be addressed (Gabriel, Goldstein, & Zebker, 1989; Wang, Zhao, & Yin, 2018).). Under the influence of atmospheric effects, microwave signals are easily affected by humidity, temperature, electron number, and other factors in the atmosphere during propagation in the air. On the other hand, they may be affected by the incoherence phenomenon, which is mainly divided into time incoherence, geometric incoherence, Doppler center incoherence, volume scattering incoherence, and so on (Zhang et al., 2023; Liu et al., 2017). The maximum deformation could be obtained by Formula 1 (Chen, & Zebker, 2002).
Where,
S max ,LOS refers to the maximum deformation in the line of sight; g-esolution is the bottom resolution unit of the SAR sensor; W is the radius of the deformation gradient; and I is the sensor wavelength.
InSAR technology extends the traditional monitoring method to three-dimensional monitoring in the mining areas and becomes the research hotspot of deformation monitoring. However, the subsidence in some mining areas has a large scale and large subsidence gradient over time. Surface subsidence experiences the initial period, main period, and residual period. In the main subsidence period, the surface subsidence in the satellite revisit period exceeds the maximum deformation gradient monitored by D-InSAR technology. Therefore, using D-InSAR technology for mining subsidence monitoring leads to the incoherence of images and cannot obtain accurate deformation information. Fan et al. (2014; 2015) found that it was difficult to obtain large deformation of mining areas by only using D-InSAR technology (Wang, & Zhang, 2017; Gao et al., 2009; Wang et al., 2019). Based on a small amount of surface observation data using D-InSAR technology and the probability integral method, the relative error of the maximum subsidence point was about 8.3%, which was much better than that of the conventional D-InSAR technique. Yang et al. (2016) utilized LOS deformation values of SAR data to predict probability integration parameters. By analyzing mining subsidence law, Diao et al. (2016) proposed a method of combining D-InSAR with the subsidence prediction model based on PIM to carry out real 3D deformation monitoring.
In this paper, to solve the above problems, the accuracy of the subsidence values in the initial and residual stages of mining subsidence monitoring will be obtained by using the SAR data. By combining the Knothe time model function with the probability integral method, the InSAR-PEK model will be constructed to obtain the dynamic predicted parameters of mining subsidence monitoring to calculate the subsidence values in the main subsidence period.
The remainder of this paper is organized as follows: The second section illustrates the InSAR-PEK model construction method. The third section carries on the simulation experiment and verifies the model precision. The fourth section verifies the proposed method through an engineering example, followed by the conclusion in the fifth section (Sen, 2022; Yang et al., 2016; Chen et al., 2018; Chen, 2015; Liu, Mei, & Sun, 2022).
2. Model construction
2.1. Probability integral method
The probability integral method (PIM) is based on random medium theory and is widely used in mining subsidence prediction. It applies granular medium mechanics in discontinuous medium mechanics to study strata and surface movement. From a macro point of view, the law of strata and surface movement caused by mining is similar to that described by the granular medium model as a random medium (Chen et al., 2018). The formula of surface subsidence at any point W(x, y) caused by mining is as follows:
Where q is subsidence coefficient, r is the main influencing radius, Y = H 0 / tanb, H 0 is the average mining depth, tanb is the tangent value of the main influence angle, (xi , y i ) planar coordinates for mining unit i, (x, y) is the coordinate of any surface point.
2.2. Power exponent Knothe function model
Knothe time function model was proposed by Knothe, a Polish scholar, in 1952. The model is used to describe the dynamic process of surface subsidence. During the mining of the working panel, the subsidence value is assumed to be 0. The power exponential Knothe time function model can be expressed as follows:

Where w(t) is the subsidence value at a certain time, c is the time influence coefficient related to mining conditions of the working panel and characteristics of overlying strata; k is the fitting parameter of the model.
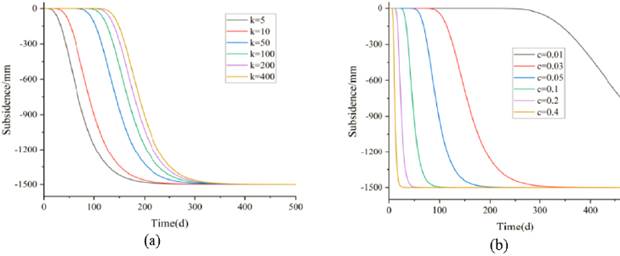
The power exponential Knothe function has three parameters to be estimated, namely, the maximum subsidence value wm, and the constant parameters c and k. c and k mainly affect the shape of the function image (Yang et al., 2016). Suppose w m= 1000mm, as shown in Fig 1(a), when c = 0.03, k values are taken as 5, 10, 50, 100, 200 and 400, respectively. It can be seen that the larger the parameter k is, the longer the initial subsidence time is, and the longer the time to reach the maximum subsidence value is, but the shape of the function image is roughly unchanged. As shown in Fig 1(b), when k = 70, c values are 0.01, 0.03, 0.05, 0.1, 0.2 and 0.4 respectively. It can be seen that the smaller the parameter c is, the faster the surface subsidence speed is, but the change of c value has a greater impact on the shape of the function image (Diao et al., 2016).
2.3. Construction of InSAR-PEK Model
a. Subsidence values of InSAR data
Chen et al. (2018) achieved large-gradient deformation monitoring by using lidar to repair the hole field of SAR data. They proposed that when the coherence coefficient was lower than 0.32, the maximum detectable deformation gradient of D-InSAR was close to 0. To obtain the interferogram with high coherence coefficient, the coherence threshold of phase unwrapping was set to 0.45 in SAR data processing of the working panel, and the interferogram with a "cavity field" was formed.
The double track method was used to obtain the LOS deformation values of the sentinel data, with the assumption that the relative subsidence value between the two scenes of the InSAR Data was ∆W los = [W los 2-1 , W los 3-2 , W los 4-3 , L, W los 42-41 ], and the vertical subsidence value of the mining area extracted by the LOS three-dimensional decomposition method was W sar =[W sar 2-1, W sar 3-2 , W sar 4-3 , L, W sar 42-41]. Among them, the SAR data in the main subsidence period were removed due to the influence of large-gradient strain.
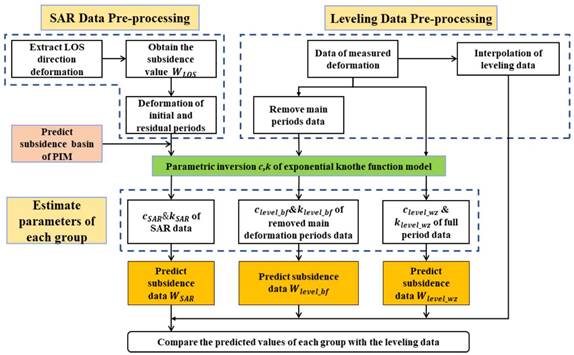
b. Fitting parameters
1) PIM predicted the maximum subsidence value of the working panel according to geological and mining conditions. Assuming that the initial subsidence value was 0 mm, the initial subsidence values were accumulated to obtain the data of the initial period;
2) PIM predicted the final subsidence value, and the data in residual period were obtained by accumulating the final SAR data;
3) The power exponent Knothe time function model was used for parameter inversion:
(1) The first group of parameters c level_wz and k level_wz were obtained from the complete leveling observation values;
(2) The parameters c level_bf and k level_bf were obtained from the leveling data excluding the data in the main settlement period;
(3) The parameters c sar and k sar of SAR Data were obtained.
4) The RMSEs were calculated by comparing the predicted subsidence values of the main subsidence period and the subsidence values of the whole observation period with the leveling data.
c. Accuracy of parameters
Based on the calculated parameters, the subsidence values of each period were estimated and compared with the measured values at the same time, and the fitting accuracy of the three parameters was analyzed. The specific method flow is shown in Figure 2.
3. Simulation experiment
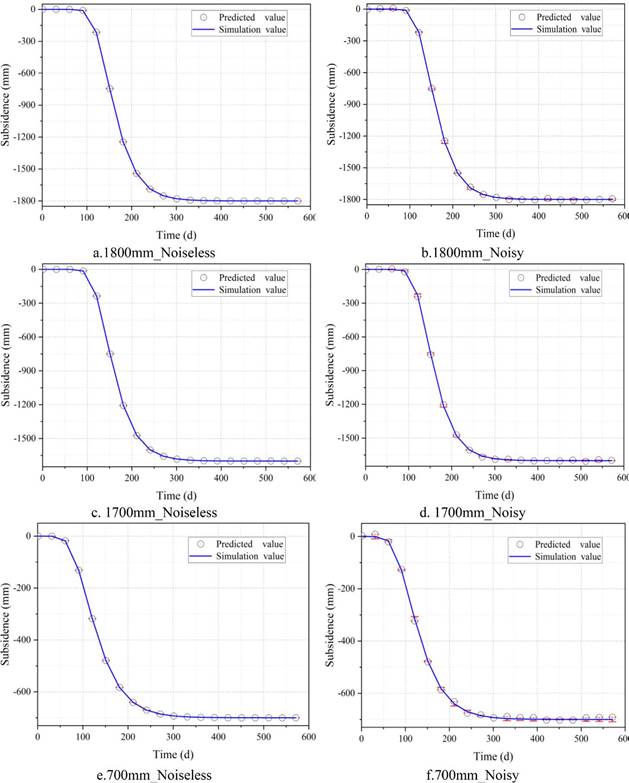
According to the actual subsidence of the mining area's working panel, the surface movement duration was 597 days until Jan. 7, 2019. The maximum subsidence of the dip line was 1770.9mm, and the maximum subsidence along the strike was 1843.3 mm. The maximum subsidence values of 700 mm, 1700mm and 1800mm were taken to conduct simulation experiments to analyze the function characteristics. The parameters of the simulation experiment are shown in Table 1. Taking the simulation experiment with the maximum subsidence value of 1800 mm as an example, the subsidence duration was set as 600 days. Taking 30 days as an observation period, 20 observation points were selected, and the subsidence values in the main period were eliminated. The observation points from the 5th (121 days) to the 8th (211 days) were eliminated.
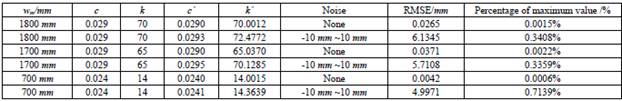
As shown in Figure 3(a), the blue line is the simulated subsidence value point, and the black point is the corresponding predicted subsidence value point. The RMSE was 0.0265 mm, accounting for 0.0015% of the maximum subsidence value. As shown in Figure 3(b), to get better simulation effects, random noise of -10mm ~10mm was added to the simulated subsidence value. Then, 20 observation points were selected for 30 days, and the subsidence values of corresponding points were estimated with the RMSE of 6.1345mm, accounting for 0.3408% of the maximum subsidence. Through the simulation experiment, it could be seen that the subsidence in the main period had little effect on the parametric inversion of the Knothe function, while the data of the initial period and the residual period had greater effects on the parameter inversion of the power exponential Knothe time function. Through the comparison of the three groups of experiments, it could be concluded that the parameter inversion could be carried out by using the fusion PIM to estimate the maximum value of the subsidence basin. Relatively reliable subsidence values of the main period could be obtained.
4. Engineering project
4.1. Introduction to the experimental area and SAR data
The experimental area is located in a coal mining panel in Huainan city, Anhui province. The mining of the working panel began on Mar. 26, 2017, and finished on Dec. 25, 2017. The hydraulic support was shipped out by the end of Jan. 2018. Actual stoping length of the working panel was about 1528 m (including 8m width of open cut) and width 251m (including transport and track paths).The mining lasted for 275 days, the average mining speed was 5.56m/d, and the coal output was 1.428 million tons. The thickness of the working panel was 1.0 ~ 4.2m, with an average of 2.8 m and an average mining height of 2.9m. The dip angle was 0 ~ 6°with an average of 3°, belonging to a nearly horizontal coal seam. The buried depth of the coal seam was 618 ~ 723 m, with an average of 668 m. The floor elevation of the coal seam was -564.1 -712.8m. The Cenozoic loose bed was about 420 m thick and belonged to the super thick loose bed. The surface above the working panel was flat with farmlands, roads and ditches, and the elevation was between 18.0m and 23.0m, with an average of 21.5m. The surface movement lasted for 597 days. The initial period of surface movement was short, about 7 days, the active period was 123 days, and the recession period was 467 days. The subsidence in the active stage accounted for 92.2% of the total subsidence.
The image data were Sentinel-1A data, C-band fully-polarized SAR image, and the data modes were SW, IW and EW. The experiment adopted IW polarization mode, with a resolution of 20 m and a standard width of 250 km. The revisit period was 12 days, and the revisit period among some images was 24 days. The subsidence values in initial period and residual settlement period were obtained from 41-scene Sentinel-1A data from May 8, 2017 to Jan. 10, 2019.
4.2. Subsidence prediction by PIM
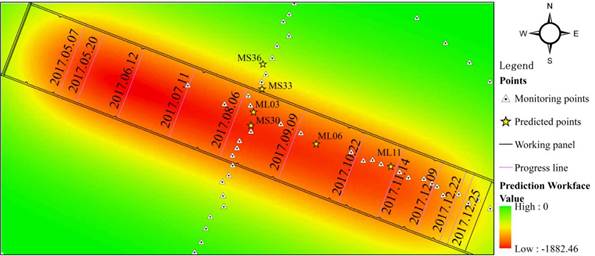
Due to the thick loose layer in the working panel, PIM was used to predict the subsidence coefficient q =1.1, in which the horizontal movement coefficient b =0.32, which affected the propagation angle q = 86°. The tangent of the main influence angle tg = 1.70. The expected subsidence is shown in Fig. 4. The maximum subsidence value was 1882.46 mm. The black rectangular box is the working panel range, and the black line is the mining progress and the corresponding time. The mining of the working panel, was stopped on Mar. 26, 2017, while the first observation was made on May 4, 2017. The first observation points along the strike line were located near the drawdown on July 11, 2017. Six research points were selected in the research area, namely, three strike points ML03, ML06 and ML11, and three dip points MS30, MS33 and MS36, among which ML03 was at the intersection of strike and dip.
4.3. Data pre-processing
4.3.1 SAR data extraction
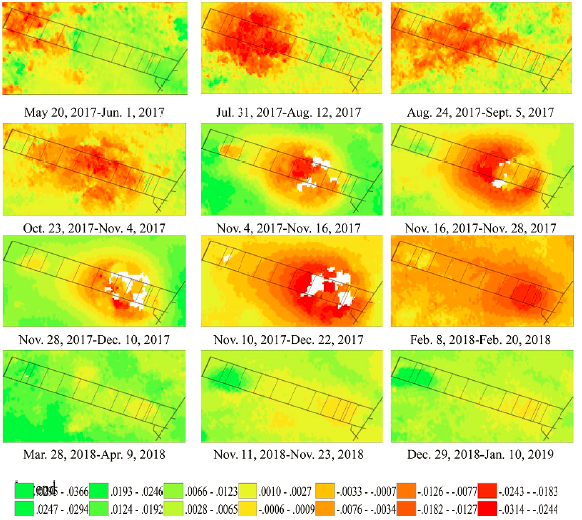
The double-track method was used to process the images, and the LOS deformation values were extracted and converted into vertical settlement values by Equation (4). As shown in Fig. 5, the blank area is the empty field formed by the unwrapping errors in the processing of images. The working panel advanced from northwest to southeast, and the displacement area expanded to southeast. Due to large-gradient subsidence during the two periods, some images formed void fields. The mining of the working panel was finished on Dec. 25, 2017, and the images of February 8, 2018 solstice and February 20, 2018 still subsided near the stoping line, and then tended to be stable with slight subsidence, which was within the measurable range of InSAR data.
The first leveling observation was conducted on May 4, 2017. The first SAR data were extracted between May 8, 2017 and May 20, 2017. The last leveling observation was carried out on Jan. 7,2019, the last SAR data were extracted between Jan. 10, 2019 and Dec. 29,2018, ∆w los = [W los 2-1 , W los 3-2 , W los 4-3 , L, W los n-(n-1) ].
Assuming that the initial subsidence value was 0 mm, the subsidence values were continuously accumulated until the false value. The subsidence values predicted by PIM were taken as the final subsidence values, and they were accumulated forward from the final SAR data to the false value. Taking Point ML03 as an example, the data of this point were accumulated from May 8, 2017 to July 19, 2017, based on the default initial value of 0 mm, and then the maximum subsidence value predicted by PIM of 1674.3mm was taken as the benchmark, and then accumulated forward from Jan. 10, 2019 to Nov.4, 2017. The data were available in initial period and residual period, while the data of main period was missing.
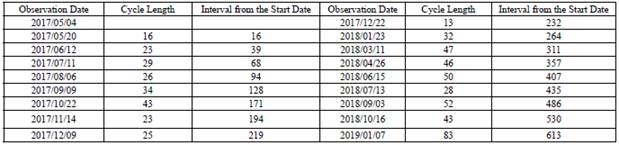
4.3.2 Interpolation processing of measured data
The measured time of leveling is shown in Table 2. The discrete monitoring data were interpolated to extract the subsidence values consistent with the time of SAR data, W’ level = [W’ level-1 , W’ level-2 , W’ level-3 ,L, W’ level-n ]. As shown in Fig. 6, ML03, ML06, ML11, MS30, MS33 and MS36 are interpolated data.
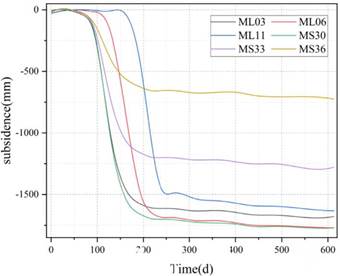
4.4. Dynamical prediction by the exponential Knothe function model
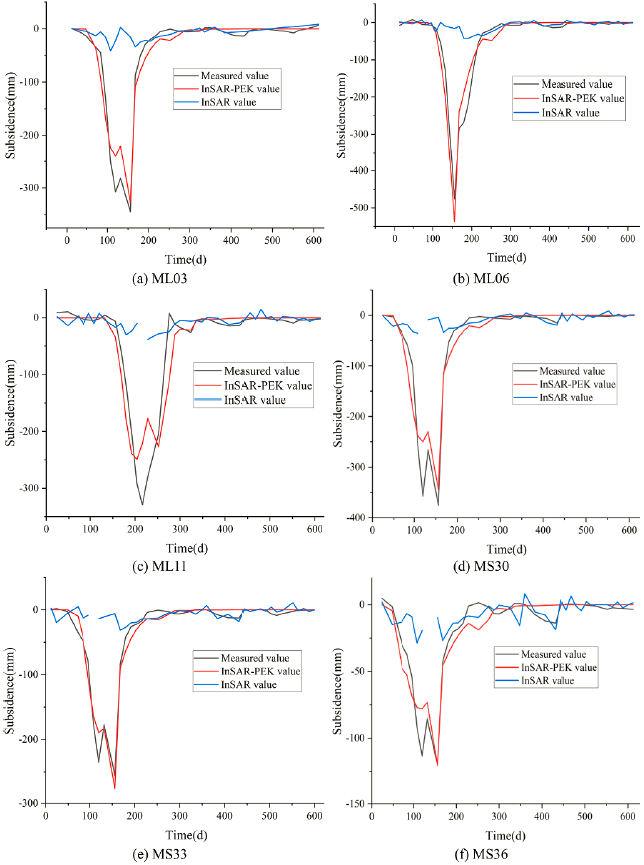
Two observation lines were arranged along the strike and dip of the working face, with three points on each line. There were 18 monitoring periods. As shown in Fig. 7, the data in main subsidence period were obtained by InSAR-PEK method and compared with the measured data.
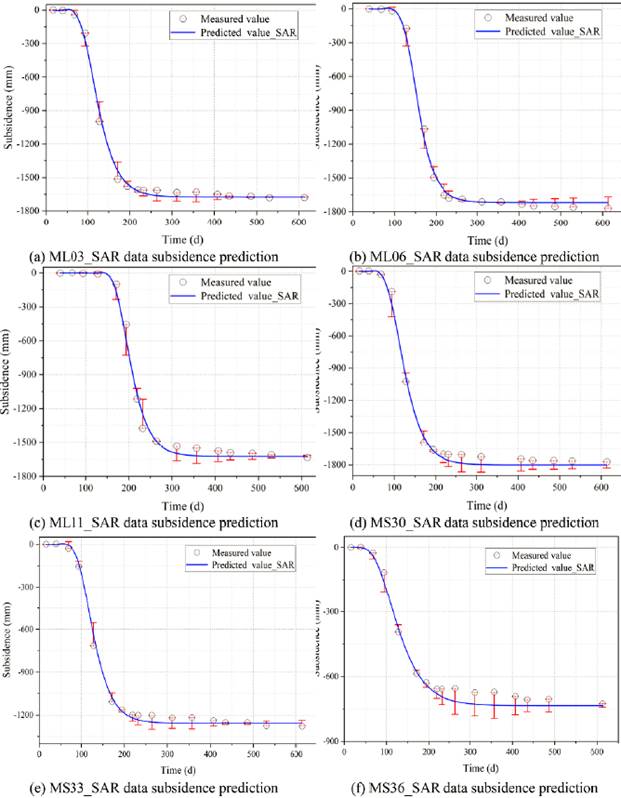
Table 3 shows the comparison of RMSEs of the three groups of tests at each point in the main period and the whole observation period. The minimum RMSE obtained by InSAR-PEK method was 28.1273 mm and the maximum was 91.6846 mm in the main settlement period. The minimum RMSE was 30.9307 mm and the maximum was 58.7326 mm in the whole period. The maximum and minimum predicted RMSEs of the measured data were 21.5255 mm and 148.2012 mm in the main period, respectively. They are 28.2700mm and 87.2497mm in the whole period, respectively. The measured data were eliminated in the main period, and the minimum and maximum RMSEs were 48.6616 mm and 212.6215 mm. While they were 31.6467 mm and 120.5947 mm in the whole period, respectively.
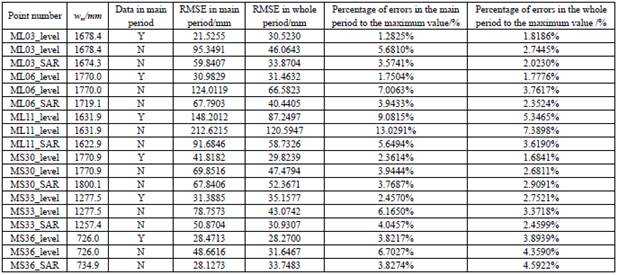
The accuracy values of ML03 and ML06 points were slightly lower than the calculated inverse results of the complete measured data, but better than those in main settlement period without the measured data. Among them, the RMSEs obtained by ML11 InSAR-PEK method were better than the predicted results after eliminating the measured data in the main settlement period and the complete measured data. Although the predicted accuracy values ofMS30, MS33 and MS36 were slightly lower than the calculated reverse results of the complete measured data, they were all better than those in the main settlement period excluding measured data. Among them, the prediction accuracy ofMS36 in the main subsidence period was slightly higher than that of the complete measured data, and the accuracy of MS33 point was also slightly higher.
The reason for the low prediction accuracy of ML11 point may be that there is no encryption monitoring, which can not better reflect the subsidence of the whole time period. However, data can be extracted from SAR data in the whole period, and there is still a large amount of data after eliminating false values in the main period, so the predicted accuracy is slightly higher than that of the measured data.
As shown in Figure 8, by comparing the predicted values obtained by the InSAR-PEK method and the extracted values from SAR data with measured values at each point, the extracted values of SAR had a large gap with the measured values in the main subsidence period, which were false values. However, the predicted values by the InSAR-PEK method were close to the measured values, which could meet the mining subsidence prediction requirements.
5. Conclusion
As the main coal-producing area in Huainan region of China, ground subsidence is extremely serious, so the effective subsidence monitoring and study of subsidence law can better predict the extent and range of ground subsidence. Based on large-gradient deformation values in the mining area obtained by InSAR-PEK method, the following conclusions are drawn:
The prediction accuracy by InSAR-PEK method was mainly related to the prediction accuracy of the maximum subsidence value by PIM. The closer the maximum subsidence to the measured value, the higher the accuracy will be.
The subsidence values were stable and accurate in the initial and residual periods obtained by SAR data. The accuracy values of the subsidence obtained by InSAR-PEK method were higher in the main period, and the prediction accuracy values of some points were better than those of the leveling data.
In the case of large-gradient deformation of the working panel, compared with the subsidence values extracted by D-InSAR technology, the subsidence values predicted by InSAR-PEK method were close to the measured values, which could provide a feasible method for SAR data to independently obtain subsidence values in the main subsidence period.
With the development of UAV technology and the maturity of 3D modeling technology, DEM data of the first observation and the last observation can be obtained, and errors of the last maximum subsidence value predicted by PIM can be avoided. In the future, the experiments will be carried out with the combination of 3D modeling of UAV.

