


 text in
  English (pdf)
 Article in xml format
 Article references
 Send this article by e-mail
 Cited by SciELO
  Cited by Google
  Similars in
SciELO
Similars in
SciELO  Similars in Google
 Permalink
INTRODUCTION
Environmental management applied to the case of coastal lagoons enables the use of different technical and technological mechanisms both to diagnose and analyze current and future needs and to design and implement action steps allowing for the coexistence of anthropic activities (e.g., tourism, agriculture, fishing, recreation, industry, among other) and the preservation of these territories’ natural values (García-Ayllón, 2017). It has been well documented that these bodies of water are frequently subjected to diverse environmental issues, as a product of their interaction with said human activity. This entails habitat perturbation, fragmentation, and degradation processes with a potential to affect ecosystem biodiversity and stability (Kennish, 2015; Pelletier et al., 2020; De Wit et al., 2021; Scapin et al., 2022). The degree of affectation in the territory surrounding these coastal environments also has an impact on ecosystem stability as a result of human intervention in these protective areas. This happens through river deviations, the dam construction, basin construction, erosion and marine sedimentation control works, the development of housing and recreational buildings, road construction, mouth closure, mangrove destruction, the installation of salt extraction and shrimp fishing operations, channel dredging, landfills for urban and industrial expansion, waste deposits, climate change, among others (Anthony et al., 2009; Ansari et al., 2011; Glibert et al., 2014; Friedland et al., 2019; Lenzi and Cianchi, 2022).
The issue of pollution in lentic ecosystems depends on pollutant assimilation capabilities, which are dictated by lakes’ self-purification capacity according to their natural defense mechanisms (Semenov et al., 2019). This ability to absorb, dampen, and resist the biotic and abiotic changes that occur after natural or anthropogenic perturbations is defined as ecological resilience, an indicator that allows identifying, monitoring, and developing management and conservation strategies (Holling, 1973; Ludwig et al., 1996; Gunderson, 2000, 2010; Bellwood et al., 2004; Baho et al., 2017; García-Ayllón, 2017). These recovery or dampening capabilities are determined by specific variables associated with regeneration, such as plant composition, biological productivity, biomass, nutrient accumulation, and ecological diversity (Pimm, 1999).
To estimate ecological resilience in natural environments, different approaches have been employed, including i) the study and understanding of the mechanisms through which robustness is developed (this concept is understood as the persistence of systemic characteristics for which there are no mathematical tools where stability theory is applied) (Jen, 2003); ii) the application of the concepts of ecological resilience, adaptive cycles, and panarchy in comparing community, ecological, and human systems (Gunderson, 2010); iii) the quantification and description of ecosystem services, including changes in the risks of harmful algae blooms, for which two integrating resilience indicators are proposed: the extension of submerged aquatic vegetation and the spatial distribution of fish (Wainger et al., 2017); iv) a qualitative approach to measure and evaluate resilience, with the purpose of closing the gaps between science, policies, and management while considering complementary attributes (scales, adaptation capabilities, thresholds, and alternative regimes) encompassing ecosystems’ inherent complexity (Baho et al., 2017); and v) a multidisciplinary approach using integrated GIS-LiDAR analysis (Geographic Information Systems-Light Detection and Ranging), which proposes a comprehensive evaluation of the situations and challenges faced by these environments and helps to resolve their current issues (García-Ayllón, 2017). The latter appears as an innovative tool that allows generating objective results via a quantitative analysis of the impacts, effects, and threats caused by human activities on aquatic ecosystems, applying a simple and relatively precise methodology.
The objective of this work was to estimate the ecological resilience of Las Peonías lagoon (Zulia, Venezuela) between 2011 and 2019, by means of integrated GIS-LiDAR analysis. To this effect, the dimensions of the anthropic activity areas were determined, and terrain transformation and anthropic impact indicators were calculated (coastal occupation, agricultural affectation, mixed incidence, and average annual terrain transformation), as well as those derived from transformation (impact fragmentation, coastal regeneration, and ecological resilience). This, in order to understand the degree of ecosystem stability and contribute with technical tools for environmental recovery and the integral management of water resources. The adoption of this methodology, together with indicators allowing to carry out global diagnostics comparable to those of other lagoons in other parts of the world, allows highlighting these ecosystems’ ability to absorb the impacts of the activities surrounding them, as well as steering their future management (García-Ayllón, 2017).
STUDY AREA
Las Peonías lagoon is geographically located between the 19N zone, UTM projection coordinates 1,191,049.27 − 210,319.57 N and 1,189,178.13 − 193,657.96 W, in the northwestern sector of the Maracaibo Strait, between the municipalities of Maracaibo and Mara in the state of Zulia (Venezuela). This lagoon is part of the Lake Maracaibo hydrographic basin (Figure 1). It is a mainland, shallow eutrophic body of water (approximately 60-67 cm) partially separated from El Tablazo bay by a littoral barrier, offering narrow channels such as the Araguato channel (approx. 1 km long, 4.0 m wide, and 2.5 m deep), which allow it to communicate with the lake according to tidal cycles while maintaining a fluctuating salinity regime and a high phytoplankton productivity (Acevedo and Cañas, 1980; Iclam, 1988, 2000, 2005; Mora, 2009).
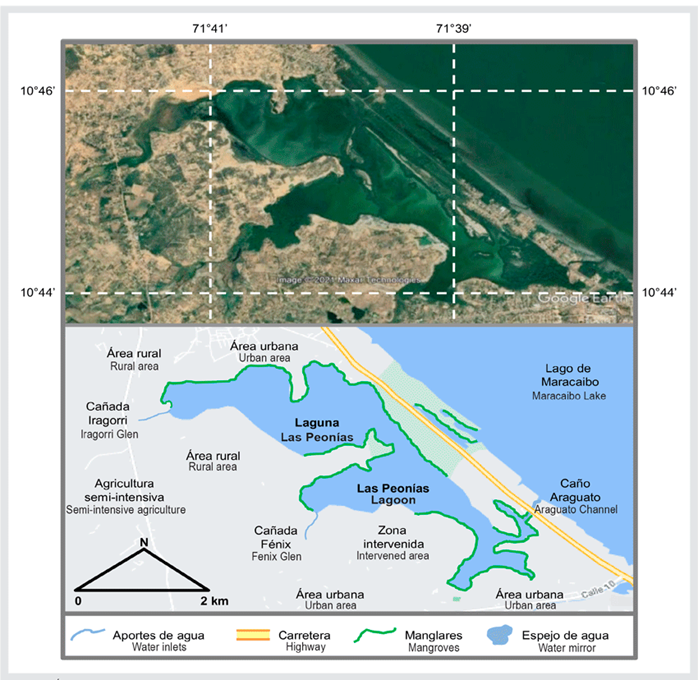
Figure 1 Study area. Geographical location of Las Peonías lagoon (Zulia, Venezuela) and characteristics of the surrounding area (modified from Google Earth).
It has a surface area of approximately 6.3 km2, a maximum length of 5,900 m, and a maximum width of 2,200 m. Its relief its mainly flat, with altitudes varying between 0 and 2 masl (meters above sea level)., and it has a hydraulic vessel volume of about (Iclam, 1988, 2000, 2005; González et al., 2007). The shape of the lagoon is irregular; the formation of intermediate lands (islets) with natural landscapes where the vegetation creates narrow passages and open spaces with great proportions of water. The perimeter of the lagoon is defined by mangrove vegetation, which also serves as a habitat for a wide variety of flora and fauna (Iclam, 1988, 2004, 2005).
In recent decades this lagoon has experienced a decline in its environmental quality as a result from anthropic influence in its water mirror and surrounding area (Iclam, 1988, 2000, 2005; González et al., 2007; Minec, 2018; Marín-Leal et al., 2019), mainly due to urbanization and industrialization, terrain deforestation and modification, nontreated wastewater dumping, pig farms, and salt production, among others. This has caused a noticeable decrease in the water exchange with Maracaibo lake, which entails stagnation and pauperization, with a subsequent impact on native biota. In addition to the water drained along the tributary watershed surrounding it, the lagoon receives contributions from the Iragorri and Fénix glen from the west and northwest, respectively. These glen drain a large portion of Maracaibo’s northern zone and lead a significant wastewater flow to the lagoon (1,100 l/sec). In addition, pluvial drainage causes higher-flow peaks and a faster response to precipitation (Iclam, 2005; González et al., 2012; Corona, 2016; Minec, 2018).
MATERIALS AND METHODS
Delimitation of anthropic activity zones
In order to delimit the areas of anthropic activity in the lagoon (urbanized area, perimeter zones, and agricultural area), 2011-2019 Landsat TM 7 images were used (resolution 1 pixel = 30 × 30 m), which were visually inspected and classified in an unsupervised fashion (ITC, 0000). The dates of these images are 25-Oct-2011, 27-Oct-2012, 30-Oct-2013, 17-Oct-2014, 20-Oct-2015, 22-Oct-2016, 25-Oct-2017, 28-Oct-2018, and 25-Oct-2019 (USGS, 2020). Using the updated vegetation map, the original and current extension of the anthropic activity zones was calculated (Landsat-7, 2019a, 2019b). Image digitization, geo-referencing, and analysis were performed via the ArcGIS 10.5 software (Esri, 2012; 2019), thus obtaining detailed information on the urbanized, perimeter, and agricultural areas in order to estimate the indicators described below.
Indicators of terrain transformation and anthropic impacts
Estimating terrain transformation indices and those associated with anthropic impacts using common basic criteria allows comparing different study cases regarding coastal bodies of water. This group of indicators provides clear information about the actual nature of a body of water’s context.
Coastal occupation index
This index represents the load factor of the first 500 m of the coast for the reference area. Thus, the coastal surface of the territory comprising areas that have not yet been urbanized was estimated in relation to the total coastal surface in the lagoon’s perimeter via the following equation (García-Ayllón, 2017):
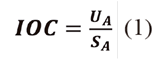
Where: IOC: coastal occupation index (percentage of the terrain occupied by artificial surfaces in the first 500 m of the coast; UA; urbanized area (km2 occupied by artificial areas); SA: 500 m reference area in the coast (divisions and km2 within the 500 m dampening zone considered as parallel to the lagoon’s shore).
Agricultural affectation index
This index represents the harvested agricultural area whose surface and below-ground contributions maintain some type of physical link to the lagoon. It is homogenously defined to support later comparisons. This dimensionless relation between agricultural activity and the lagoon’s surface was calculated by applying the following equation (García-Ayllón, 2017):
Where: IAA: agricultural affectation index (percentage of agricultural land linked to the lagoon); SA: terrain transformed for agriculture with some type of link to the lagoon; SL: surface area of the lagoon.
Mixed incidence index
It is the dimensionless relation between the presence of different human activities and the surface of the lagoon, and it indicates the contribution of said activities to terrain transformation, without including agriculture. The contribution of each activity was determined by using the surface area and specific correction factors according to the following equation (García-Ayllón, 2017):

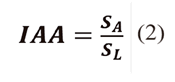
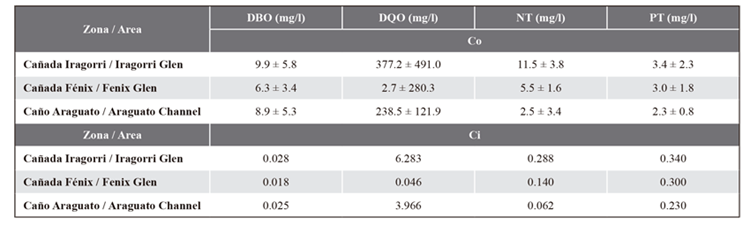
Where: IIM; mixed incidence index; Si: measured activity i; Ci: correction factor for activity i; SL: lagoon surface area. To define the correction factors (Ci), activities are considered which are directly or indirectly linked to the environment. Therefore, variables related to water quality were identified, i.e., biochemical oxygen demand (DBO), chemical oxygen demand (DQO), total nitrogen (NT), and total phosphorus (PT), as indicators of the main activities with an impact in the area (residual waters from urban and industrial areas) which directly affect the lagoon by means of the Iragorri and Fénix glen and the Araguato channel (Table 1) according to previous studies (Iclam, 1988, 2000, 2005; Mora, 2009; González et al., 2012; Corona, 2016; Fernández, 2017; Marín-Leal et al., 2019). Thus, Ci values were calculated as per Monsalve (2008) and Beltrán and Rangel (2013):
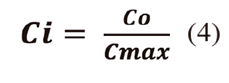
Where: Co; concentration of the DBO, DQO, NT, or PTvariable at the specific site; Cmáx: maximum concentration of the variable which exceeds the permissible limit as per environmental regulations (Decree 883, 1995).
Table 1 Concentrations (Co, arithmetic mean±standard deviation) of the identified pollution indicators: biochemical oxygen demand (DBO), chemical oxygen demand (DQO), total nitrogen (NT), and total phosphorus (PT) (González et al., 2012; Fernández, 2017; Marín-Leal et al., 2019). Calculated correction factors (Ci) in areas of high anthropic impact in Las Peonías lagoon.
Average annual terrain transformation indicator
The annual growth rate of the terrain allows introducing the time variable in analyzing ecological resilience, with the purpose of evaluating the transformation speed. This indicator is of particular interest since it allows defining the relationship between the terrain’s consumption rate for human activities and their derivatives in the reference area. It is expressed as the percentage of consumed territory over a specific period of time, according to García-Ayllón (2017):
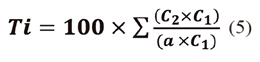
Where: Ti: average growth rate; Ci: consumed terrain area (ha) on date i (represented as C1 and C2): a: correction factor (in the case of territories that have been homogenously transformed, it is equal to 1).
Indicators derived from transformation
These indicators allow for a more accurate identification of the impact of anthropic activities on the lagoon, as well as of its ability to deal with them, by means of integral diagnostics.
Impact fragmentation indicator
It allows knowing how anthropic changes affect the lagoon’s surrounding area. It is a dimensionless index that relates the anthropic impacts in the perimeters and the lagoon surface. A high value indicates a greater degree of impact dispersion or fragmentation. This indicator was calculated by applying the following equation (García-Ayllón, 2017):
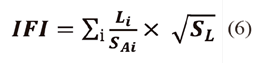
Where: IFI: impact fragmentation indicator; Li: lagoon limit affected by anthropic activity at the coastal edge i (m); SAi: area of anthropic activity linked to the lagoon via the coastal edge i (m2); SL: surface area of the lagoon (m2). The area 1,000 m from the coast was established as the zone of affectation by anthropic activity.
Coastal regeneration index
This index relates the possible exogenous causes of the impacts and the lagoon’s natural regeneration. It is expressed as the relation between the number and capacity of entry imbalance elements and the recovery elements of the system’s natural conditions. All this, while taking climatic impacts into account. The lower the index, the more unsustainable the trend, according to the following equation (García-Ayllón, 2017):
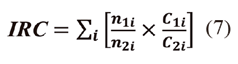
Where: IRC: coastal regeneration index; n1i: number of connections to the open sea or restoration channels; n2i: number of effluents or elements generating anthropic impacts; C1i: physical capacity of the open-sea connections or restoration channels and climatic contributions; C2i: effluent capacity and climate variations.
Ecological resilience index
This indicator provides information about a body of water’s persistence in the face of changes in environmental variables due to natural or anthropic causes, with the aim of essentially preserving the same function, structure, identity, and feedback. From a comprehensive point of view, it relates the capacities to absorb the impacts of the studied activities to their amplitude by miens of the above-presented indicators. A higher value of this dimensionless index shows a greater resilience, according to the following equation. (García-Ayllón, 2017):

Where: IRE: ecological resilience index; SL: lagoon surface area (m2); P: lagoon average depth (m); IRC: coastal regeneration index; SAi: activities linked to the lagoon surface (m); IFI: impact fragmentation indicator; Pu: urbanized perimeter of the lagoon (m).
Integrated GIS-LiDAR analysis
In this study, integrated GIS-LiDAR analysis was applied to the case of Las Peonías lagoon for the period between 2011 and 2019 (estimations every two years), with the purpose of determining the temporal evolution of the indicators and provide baseline information for environmental recovery and for the integral management of this body of water. The data on the environmental variables (the capacity of open-sea connections, precipitations, effluent capacity, and the concentration of water quality parameters) required to calculate the different indicators were obtained from the corresponding document material (González et al., 2012; Corona, 2016; Fernández, 2017; Fernández et al., 2017; Meteo-Urbe 1, 2017; Marín-Leal et al., 2019; Ideam, 2021).
RESULTS
The analysis of satellite images and the use of the ArcGis 10.5 tool allowed estimating the different variables required to calculate the coastal regeneration and ecological resilience indices of Las Peonías lagoon (Figura 2), in particular reference to the surface area, the water mirror area, the vegetation area, the affectation zone at 500 mm, the affectation zone at 1000 m, the urbanized area, and the terrain transformation. Tables 2, 3, and 4 detail the results of the estimated variables for the terrain transformation and anthropic impact indicators, as well as for those derived from transformation.
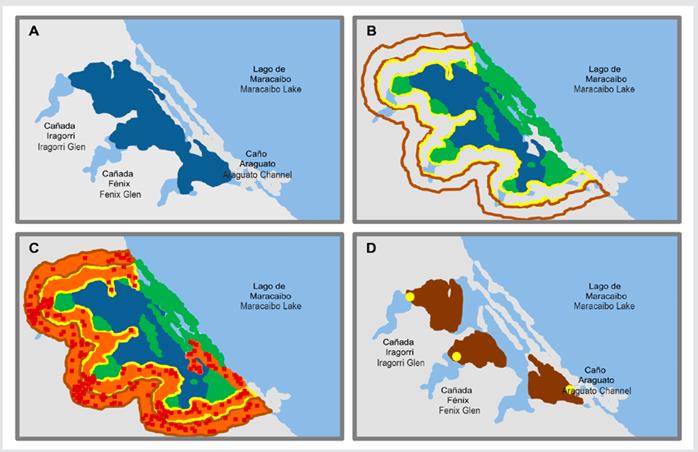
Figure 2 Images illustrating the definition of some variables for estimating the terrain transformation and anthropic impact indicators and those derived from transformation in Las Peonías lagoon, using Landsat TM 7 satellite images and the ArcGis 10.5 software. A) Surface area (blue); B) water mirror (blue), vegetation (green), area at 500 m (yellow), area at 1000 m (brown); C) water mirror (blue), vegetation (green), area at 500 m (yellow), area at 1000 m (brown), urbanized area (orange), transformed terrain (red); D) affectation areas (brown) with their starting point (yellow) for the Iragorri and Fénix glen and the Araguato channel.
Table 2 Coastal occupation index (IOC), agricultural affectation index (IAA), and mixed incidence index (IIM) for Las Peonías lagoon in the studied period.
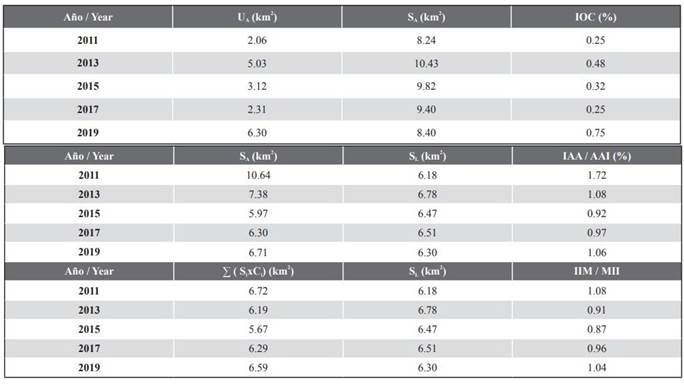
∑(SixCi): sum of areas per correction factor; Si: measured activity I; Ci: correction factor for activity I; SL: lagoon surface area; SA: terrain transformed for agriculture; SL: lagoon surface area; UA: urbanized area, SA: reference area 500 m from the coast.
Table 3. Indicator of the average annual transformation of the terrain (Ti) for Las Peonías lagoon in the studied period
C1: consumed terrain area (transformation with respect to the previous year); C2: terrain transformation for the corresponding year; a: correction factor; -: not applicable
Table 4 Impact fragmentation indicator (IFI) for Las Peonías lagoon in the studied period.
Li: coastal limit affected by anthropic activity; SAi: coastal area for anthropic activity; SL: lagoon surface area.
Table 5 summarizes the results regarding the terrain transformation and anthropic impact indicators and those derived from transformation for the studied period in Las Peonías lagoon. The mean values of IOC, IAA, IIM, Ti, IFI, IRC, and IRE were 0.41 ± 0.21 %; 1.15 ± 0.33 %; 0.97 ± 0.09, 4.65 ± 3.79 %; 114.89 ± 27.33; 25.04 ± 29.74 y 0.02 ± 0.03; respectively.
Table 5 Summary of the terrain transformation and anthropic impact indicators, as well as those derived from transformation, estimated for Las Peonías lagoon in the studied period.
IOC: coastal occupation index; IAA: agricultural affectation index; IIM: mixed incidence index; Ti: average annual terrain transformation indicator; IFI: impact fragmentation indicator; -: not estimated
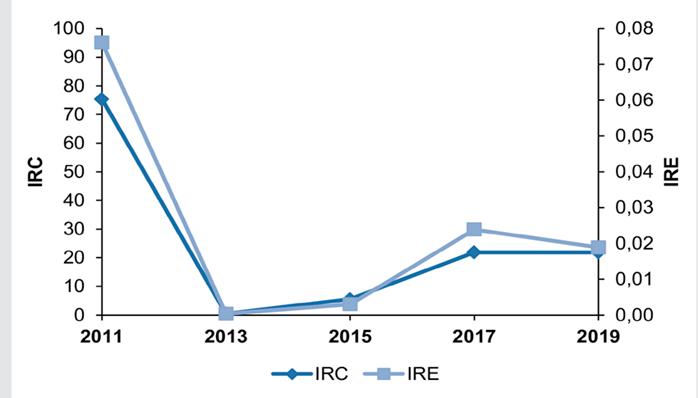
Tables 6 and 7 include the results of the variables estimated to calculate the IRC and IRE. The temporal variability of IRC and IRE in Las Peonías lagoon during the studied period is shown in Figure 3. Generally speaking, an increasing tendency was observed for the indicator values between 2013 and 2019, particularly for IOC, IAA, IIM, IRC, and IRE.
Table 6 Coastal regeneration index (IRC) for Las Peonías lagoon in the studied period.
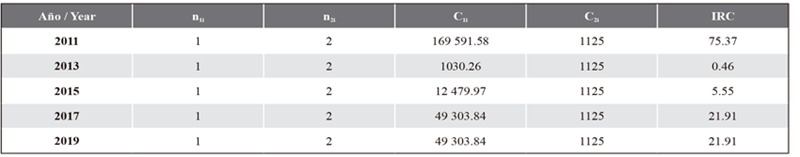
n1i: number of open-sea connections or restoration channels; n2i: number of effluents or elements generating anthropic impacts; C1i: physical capacity of the open-sea connections or restoration channels and climatic contributions; C2i: effluent capacity and climate variations.
Table 7 Ecological resilience index (IRE) for Las Peonías lagoon in the studied period.
SL: lagoon surface area; P: average depth of the lagoon; IRC: coastal regeneration index; SAi: coastal anthropic activity index; IFI: Impact fragmentation indicator; Pu: urbanized perimeter of the lagoon.
DISCUSSION
Terrain transformation and anthropic impact indicators
The temporal evolution of the IOC showed an increase between 2011 (0.25 %) and 2019 (0.75 %), as evidence of the progressive increment in urbanized areas around the lagoon (Tables 2 and 5), with variations as a function of the national socioeconomic situation and an increased population density. In this sense, the UA values increased from 2.06 (2011) to 6.30 (2019) km2, showing the magnitude of urban development in the affectation zone of this body of water. In contrast, the IAA exhibited a decrease during this time period (from 1.72 to 1.06 %), in response to the transformation of the terrain and the reduction of adjacent agricultural zones (Tables 2 and 5). Thus, for the population of this area, a low social sustainability index has been reported (0.52), which stems from the mathematical interpretation of indicators such as the life conditions of producers, the education level, the health level, the poverty index, and citizen participation, which evidences a high social instability in agricultural activities (Villalobos et al., 2007). This social characteristic was reflected on the IAA, showing the relatively low impact of agriculture as an anthropic activity in the surrounding area.
As for the IIM, a relatively low fluctuation in the values was observed, whose maximum (1.08) was obtained for 2011 (Tables 2 and 4), as a result of SL, which reported its lowest magnitude in this period of time due to the reduction of the lagoon area stemming from a prolonged drought (Reliefweb, 2014; Fernández, 2017; Meteo-Urbe 1, 2017; Ideam, 2021). Generally speaking, as the anthropic impact of the identified activities with regard to calculating this index was relatively constant over time, there was a relative stability in the values for the subsequent years. The Ti indicator, in turn, showed a high variability during the studied period, with a minimum of 0.71 % in 2017 and a maximum of 9.74 % in 2013 (Tables 3 and 5), evidencing urban dynamics and perhaps low precision in delimiting the transformation areas from satellite images, which is why a combined analysis with the previous indicators is necessary, as well as a comparison of the body of water’s behavior during the studied period, with the purpose of identifying the factors that influenced these values according to that presented by García-Ayllón (2017). In this regard, Dobson et al. (2021) recommend that GIS analyses be accompanied by site-level assessments in order to corroborate the results and develop detailed design and engineering plans. Thereupon, the results are limited by the data available at the time of analysis and by the accuracy and precision underlying the original data source. Therefore, the analysis might not capture all the threats related to floods, community assets, fishing resources, and wildlife or areas with open spaces. The combined analysis of the terrain transformation and anthropic impact indices reveals a lack of policies for urban planning and water resources management in Venezuela, with marked dynamics as a function of population growth and the occupation of the terrain while disregarding affectations to the environment, which has caused a longstanding environmental problem in Las Peonías lagoon.
Indicators derived from transformation
The IFI, with high and variable values between 94.21 (2015) and 162.81 (2017) (Tables 4 and 5), showed a high degree of dispersion for the total anthropic impacts with respect to the surface of the territory, understood as a geographical fragmentation that affects the lagoon watershed. The ecological fragmentation process implies the appearance of discontinuities in ecosystems; what once was a continuous portion of an ecosystem becomes in a set of disconnected and isolated fragments (Santos and Tellería, 2006; Quintero-Ángel et al., 2012), implying the breaking of the ecosystem structure, with the focalization of independent and dysfunctional micro-environments.
The IRC showed highly variable levels, i.e., between 0.46 (2013) and 75.37 (2011), with values around 22 towards the end of the studied period (Figure 3). These calculations integrate a series of ecosystem characteristics that can be detailed as follows: i) the terms n1 and n2 represent the contributions of a restorative nature and those of anthropic origin, respectively (Table 6); and ii) the terms C1 and C2 reflect the volumetric capacities of the tributaries. Thus, the magnitude of C1 varies not only because of the entry of water from Maracaibo lake via the Araguato channel, but also due to the precipitations falling on the watershed, whereas C2 depends on the flows of the Iragorri and Fénix glen stemming from the neighboring urban and industrial areas, which have a relatively constant stream (Iclam, 2004, 2005; Mora, 2009; Corona, 2016; Minec, 2018). Considering the above, the low IRC values observed between 2013 and 2015 are the result of the minimal precipitation levels in the area, among other factors (Reliefweb, 2014; Corona, 2016; Fernández, 2017; Meteo-Urbe 1, 2017; Ideam, 2021), followed by a recovery regarding ecosystem regeneration with the advent of rainfall in early 2016.
The IRE of the lagoon evidenced a marked variability during the studied period, in correspondence with the IRC, whose maximum level of < 0.01 was observed in 2013 (Figure 3 and Table 7), preceded by the maximum value for 2011 (0.08), due to the possible accumulation of upsetting events such as the magnification of urbanized areas (IOC) and anthropic activities (SAi), as well as a decrease in regeneration capabilities (Table 5). The analysis of the different terms of the IRE (Equation 8) reveals that the decreased precipitations negatively affected the lagoon’s ecological resilience with regard to its ability to assimilate the anthropic impacts in its affectation area. The correspondence between the IRC and the IRE allows stating that, in the face of a perturbation, the degree of affectation is dependent on ecological resilience, requiring a period of self-organization and recovery by means of internal changes that in turn depend on the regeneration capacity and involve the perturbation level (natural or anthropic), the time elapsed, and the duration of upsetting events, among others (Gunderson, 2000; Gunderson and Holling, 2002).All this, until a state of equilibrium is reached, from which the resilience level begins to increase, as it is not an absolute and fixed property. On the contrary, it is variable in time and space, and it depends, to a large extent, on the geographical position, on environmental volatility, and on regeneration sources (Holling, 1986, 1992, 1996; Gunderson, 2000). In addition, the destabilization and perturbations caused by specific pollution sources in the lagoon’s watershed, which mainly correspond to the glen, basically in the form of nontreated domestic and industrial wastewater discharges with flows of 375 y 750 l/sec, respectively (Iclam, 2004, 2005; González et al., 2007; Hidrolago, 2015; Corona, 2016), add polluting substances that must be dissipated and assimilated by means of regeneration sources, hindering the ability to develop and increase the ecosystem’s capacity to adapt in the face of the continuous transformations experienced in recent years.
Starting in 2015, a weak recovery was observed in the IRE, in comparison with the levels reported for 2011. It was accompanied by increased IRC values (Figure 3 and Table 7), as a result of the dominance of regeneration sources in the lagoon, which include i) water from rainfall (considering frequency and intensity), particularly in 2017; and ii) water from the Maracaibo lake, which enters by means of the tidal channel, i.e., Araguato (Figure 1). This channel has been shown to have a great impact on the lagoon’s regeneration capacity since, as one advances towards the water mirror (away from the lake), a gradual decrease in the water quality is observed (Iclam, 2004, 2005; Mora, 2009; Marín-Leal et al., 2019), with the presence of the macrophyte Lemna sp. and other aquatic plants being the possible cause for the flow reduction in this channel (González et al., 2007). Thus, the resilience and sustainability of aquatic ecosystems is directly related to the consequences of transformations in the long term and to internal changes in the short term. Therefore, the lower the IRE, the more unsustainable the sustainability trend over time (Calvente, 2007). In this regard, Campbell et al. (2019) and Pelletier et al. (2020) state the importance of managing the stress factors negatively affecting the resilience of aquatic ecosystems, as well as of understanding the environmental and climatic cycles and changes that affect the resource. Water resilience can be enhanced by maintaining and improving a habitat’s connectivity, as well as its functional redundance and physical and biological diversity. Managing for resilience requires the implementation of adaptive and preferably collaborative handling by developing an effective monitoring framework to detect key changes in ecosystems.
Comparing the ecological resilience indicators of different coastal lagoons
Table 8 presents the terrain transformation and anthropic impact indicators, as well as those derived from transformation, for Las Peonías and other coastal lagoons around the world: Mar Menor (Spain), Mar Chica (Morocco), the Salton Sea (USA). This allows for a comparative analysis that considers bodies of water in different geographical regions, with contrasting climatic, physical, and socioeconomic characteristics.
Table 8 Comparison of terrain transformation, anthropic impact, and transformation-derived indicators for Las Peonías and other coastal lagoons around the world.
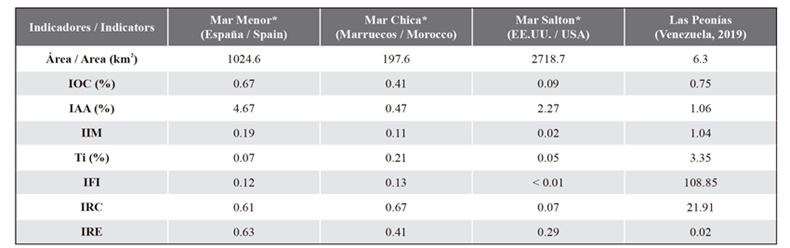
*Data from García-Ayllón (2017). ICO: coastal occupation index; IAA: agricultural affectation index; IIM: mixed incidence index; Ti: average annual terrain transformation indicator; IFI: impact fragmentation indicator; IRC: coastal regeneration index; IRE: ecological resilience index.
The Mar Menor lagoon, with an area of 1,024.6 km2, shows a high density of urbanized areas in its surroundings, with the highest number of zones occupied for agriculture and other anthropic activities, which entail increased fragmentation, exhibiting significant regeneration and resilience values. This facilitates mitigating and regenerating any negative impact caused by pollution without strongly altering the ecosystem (Table 8). The characteristics of the Mar Chica lagoon, with 197.6 km2, are similar to those of Mar Menor. However, its water volume, as it is lower, exhibits a lower degree of resilience, which is why middle-term changes can occur in the ecosystem, with possible consequences such as destabilization and eutrophication. The Salton Sea, with the largest geographical area (2,718.7 km2), shows the lowest occupied coastal line, both for urban structures and agriculture and anthropic activities such as fishing. Despite the possible pollution and factors altering the ecosystem, there are no noticeable impacts such as fragmentation, as the lagoon has a low regeneration value, and its resilience has prevented drastic changes (García-Ayllón, 2017). In the case of Las Peonías lagoon, as it is a much smaller body of water (6.3 km2) and is located next to dense urbanized areas, it is strongly influenced by the discharge of nontreated effluents and a high fragmentation level. It exhibits a noticeable regeneration level, as a result of its regeneration sources (rainwater and Maracaibo lake), with a quite low resilience level stemming from the prevalence of upsetting factors on the regeneration sources, which implies a fragile ecosystem that is susceptible to imbalance. This entails the need for internal changes in the search for a new state of equilibrium, thus affecting the survival of the biological species inhabiting this ecosystem.
In light of the above, there is an evident need to reduce upsetting factors due to human activity in the lagoon, given that, if the regeneration sources are affected in time and space by droughts and/or the obstruction of the Araguato channel, the reduced resilience levels would not help to prevent the ecosystem’s collapse, which may affect the availability of the water resource and its biological diversity. In this way, the concept of resilience applied to biological preservation theory acts as a possible indicator of the environmental state of aquatic ecosystems and is likely applicable to the sustainability of areas sensitive to perturbation, ensuring the perpetuity of the water resource and protecting native species.
CONCLUSIONS
An integrated GIS-LiDAR analysis using satellite images and multi-factor indicators allowed practically and effectively estimating the ecological resilience of Las Peonías lagoon, determining its ability to absorb the impacts of anthropic activities and providing tools for the future environmental management of this body of water.
The IOC evidenced the anthropic impact caused by the progressive increase in urbanized areas. Meanwhile, the IAA showed reduced agricultural development in the area due to multiple social factors. The combined effects of the Iragorri and Fénix glen discharge, together with a prolonged drought during the studied period, determined the IIM levels, evidencing the anthropic impacts on the body of water. The Ti reported a decelerated terrain transformation, allowing the lagoon to recover some territory, increasing the water mirror, and improving its impact absorption capabilities. The IFI showed that fragmentation is very high, which determines the level of impact dispersion. The IRC showed that the lagoon undergoes a constant regeneration process influenced by the Araguato channel and precipitations. Nevertheless, the perturbation sources (prolonged drought periods and the discharge from the Iragorri and Fénix glen) determined the low IRE values. In general terms, during 2011, the most beneficial conditions regarding the IRC and the IRE were found, with the most unfavorable values in 2013, as a result of drought and the occupation and transformation of the adjacent territory.
The low resilience potential of the lagoon depends on a relatively high regeneration capacity, which prepares it to endure or mitigate perturbations without strong alterations to the ecosystem balance, which makes it an affected and fragile body of water. Although it is in a constant state of regeneration, there are evident changes in environmental quality, with a generalized eutrophication. The deceleration of this process is determined by the urban and industrial decline of the neighboring territory, as well as by the interruption of nontreated effluent dumping.
RECOMMENDATIONS
We recommend further study of the issues related to coastal lagoon ecosystems’ capabilities to maintain their environmental conditions in the face of external perturbations by means of a standardized methodology involving diagnostic indicators focused on a quantitative analysis of structural and functional changes from a multidisciplinary perspective. This will ensure comparable results which will serve as the basis for the development of plans for environmental recovery and the comprehensive management of water resources on a macro scale.

