


 English (pdf)
 Article in xml format
 Article references
 Send this article by e-mail
 Cited by SciELO
  Cited by Google
  Similars in
SciELO
Similars in
SciELO  Similars in Google
 Permalink
The cotton crop (Gossypium hirsutum L.) is highly related to the economic, social, and agro-industrial development of many communities. In Colombia, for the year 2019, 18,327 hectares were planted, with total yields of 922 kg of fiber per ha-1 (Conalgodon, 2020). However, this crop is attacked by a wide variety of arthropod phytophagous with the potential to cause serious damage to the plant (Ribeiro et al., 2015). This crop is mainly affected by sucking and chewing insect species. It is estimated that 50-60% of losses are due to chewing insect infestations, since they affect fiber quality, decrease crop yield and increase production costs (Shad et al., 2022).
Among the most important pests, the Spodoptera complex (Spodoptera frugiperda, Spodoptera ornithogalli, and Spodoptera sunia) (Lepidoptera: Noctuidae) and Anthonomus grandis Boheman (Coleoptera: Curculionidae) are highlighted (Santos et al., 2009; de Oliveira et al., 2016). Insecticide control of S. frugiperda is difficult because it prefers to oviposit on the lower surface of leaves at almost all phenological stages of the crop (Barros et al., 2010). While for larval stages, different preferences between species have been reported; for S. frugiperda its predominance in flowers and bolls have been indicated, while S. ornithogalli, in leaves and flowers and S. sunia, in flowers (Santos et al., 2009).
On the other hand, A. grandis is an economically important pest in crops in the New World (Salvador et al., 2014). Damage of this insect to cotton crops is caused by the larvae and the adult, when the female determines that the site is suitable for oviposition, she pierces the flower bud or boll with her face and inserts an egg into the tissue, inside of the which develops the larval stages (da Silva et al., 2008; Salvador et al., 2021). The bracts of infested floral buds usually turned yellow and flared, and the floral buds dropped from the plant. Infested bolls may or may not have dropped (Sorenson and Stevens, 2019).
Bollgard II® transgenic cotton (which expresses two Bt toxin genes, Cry1Ac and Cry2Ab) is effective against many lepidopteran pests (Yang et al., 2015; Bahar et al., 2019). By 2015 approximately 84% of cotton crops planted in the United States had the Bacillus thuringiensis (Bt) protein (James, 2015), leading to a decline in pest populations and the use of chemical synthesis insecticides The sustainable management of Bt crops is threatened by the increase in pest resistance to this type of technology; therefore, the implementation of strategies that minimize insect resistance is critical to ensure the long-term success of this technology (Yang et al., 2017; Khakwani et al., 2022). To reduce pest resistance, in recent years many countries have implemented the use of pyramid crops that produce more than two Bt toxins different in their mode of action but targeting the same pest, thus achieving a decrease in crop damage (Carrière et al., 2021). Although none of the commercial transgenic varieties contain resistance genes against A. grandis or the Spodoptera complex, several Cry proteins show biological activity against these pests and at least one of them, the Cry1Ia12 and Cry10Aa proteins, has been inserted into cotton plants, conferring partial resistance to these pests (De Oliveira et al., 2016; Ribeiro et al., 2017).
To prevent resistance by pests, Bollgard II®, has been used since 2004, giving it the ability to bind at different sites in the midgut of larvae, thus increasing plant efficiency by decreasing the probability of cross-resistance in pest species (Knight et al., 2016; Meissle and Romeis, 2018). Studies developed in Valle del Sinú (Colombia) by Osorio-Almanza et al. (2018) indicate that the combination Bollgard II® together with Cry1Ia12 protein, reduced A. grandis and S. frugiperda management costs by more than 40% and limited the emergence of combined resistance.
Currently, there are no data on population fluctuation or damage caused by these pests in genotypes with Bt (Cry1Ac+Cry2Ab) and without this technology in Colombia. Therefore, this research aimed to determine the effect of Bt (Cry1Ac and Cry2Ab) and non-Bt cotton on the population dynamics of A. grandis and representatives of the Spodoptera complex in El Espinal, Tolima, Colombia.
MATERIALS AND METHODS
Experimental area
The present study was performed in the Colombian agricultural research corporation (Agrosavia) C.I. Nataima, situated in El Espinal, Tolima, Colombia at 04° 11'32.49" LN and 74°57'35.10" LW for two years 2015 and 2016. The climatic conditions during the time of the experiments were mean temperature 26.62±0.15 and 27.64±0.12 °C, mean relative humidity 80.04±0.62 and 75.53±0.68% and accumulated precipitation of 73.82 and 124.60 mm during 2015 and 2016 respectively. The plantings were carried out in March for both years, with a non-Bt cotton variety (Deltapine® 90) and a genetically modified variety with B. thuringiensis genes Cry1Ac and Cry2Ab (Fibermax1740B2F- FM1740B2F). The experimental design was paired plots (blocks) with three repetitions (800 m2 each). This was executed for two treatments (Bt and non-Bt cotton) with a total area of 2500 m2 in each. The established cotton crops in this study are part of the rice, corn-cotton rotational cropping system in the region.
For the management of the crop, insecticide applications were not made for A. grandis or Spodoptera spp., the fertilization plan was carried out based on the results of the soil analysis, dividing the nutrition into three applications: vegetative stage, beginning of flowering and formation of bolls. The physiological management, with application of Thidiazuron (defoliant) when 70% of bolls opening were presented and the control of weeds were carried out with applications of glyphosate directly to the Bt-cotton variety and directed to the streets in the non Bt-cotton, complemented with manual weeding with a hoe.
Evaluation of temporal variation
To define the temporal variation of pest insects, assessments were started 4 days after emergence (DAE) for Spodoptera spp. and at 34 DAE for A. grandis, on April 7, 2015, April 8, 2016, at the beginning of the crop May 11, 2015 and May 12, 2016, at which time the first flower buds appeared. The cotton plant was used as a sampling unit, in each repetition 10 randomly selected plants were taken, the samplings were carried out every four days, ending at 118 DAE covering the flowering and fruiting period of the two cotton varieties (Grigolli et al., 2013). The response variables evaluated in each plant were: for A. grandis the number of total flower buds (TFB) and total bolls (TB), measured by counting each structure from the lower third to the upper third of the plant; number of perforated flower buds (PFB) and bolls (PB) by oviposition, detecting the gummy substance and the visible obstruction left by the female after oviposition; and number of adult insects (NBW) present in the plant structures (Grigolli et al., 2013; Silva et al., 2015). For Spodoptera spp. were the number of larvae per plant (NLarvae) and the presence of damage (Larv_dam) (Abd El-Salam et al., 2011; Zakir et al., 2017).
During the crop cycles, the variables temperature (°C) (average, maximum and minimum), relative humidity (%), solar radiation (w m-2) and precipitation (mm) were obtained of a weather station watchdog series 2000. At harvest, to evaluate the damage (%) in production, 99 plants were randomly selected per variety (33 per repetition), which were packed in cotton canvas and individually labeled, where the percentage of damage was evaluated from the number of open bolls per plant and number of open bolls with damage of A. grandis in one or more locules, total weight of the plant to estimate the yield and average weight per open boll.
Statistical analyses
For all variables an exploratory and descriptive analysis were carried out. Subsequently, in each variety, a Pearson correlation matrix was carried out between the insect variables and yield. Additionally, a factor analysis for mixed data was performed. Then, for each variable, its accumulation curves throughout the cycle were calculated using the technique of "accumulated insect days or damage" based on the area under the curve progression stairs (ABEP) (Jaramillo-Barrios et al., 2019). The variables were compared by an analysis of variance for the randomized complete block design with a combinatorial arrangement of fixed effects (variety, year, and variety * year) and randomized (blocks). Normality was assessed using the Shapiro-wilks test and homoscedasticity through a scatter plot of residuals on the y axis and fitted values on the x axis. If there were statistical differences, these were compared with Fisher's LSD test at 5%.
The relationship of the climatic factors on the insect damage variables and the productive variables were compared by Pearson correlation coefficient. Also, Spearman rank correlations were calculated between the insect populations and the climatic variables in four phenological stages: vegetative, juvenile, reproductive and maturation. Statistical software R v. 3.3.2 was used in the analyzes (R Core Team, 2016).
RESULTS AND DISCUSSION
Temporal variation of A. grandis in non-Bt and Bt cotton
The temporal variation of PFB by A. grandis started with a progressive increase from 60 DAE in 2015 and 50 DAE in 2016 (Figure 1A-B). The highest population peaks of PB in 2015 were recorded at 90 DAE with 4.4±0.56 and 3.5±0.41 in non-Bt and Bt cotton, respectively. In 2016, they were presented in DP90® at 78 DAE with 10.6±1.3 and in FM1740B2F at 74 DAE with 7.1±0.43. The fluctuation of PB took place with a gradual increase to 82 DAE in 2015 and to 74 DAE in 2016 (Figure 1C-D). The largest population peaks of PB in 2015 were presented in DP90® at 94 DAE with 5.4±0.47 and in FM1740B2F at 90 DAE with 3.5±0.40. In 2016, the 94 DAE were presented with 14.8±0.75 and 13.4±0.97 in non-Bt and Bt cotton in their order. The number of individuals increased their populations after 70 DAE, the highest peaks occurred at 104 DAE and 100 DAE in 2015 and 2016 (Figure 1E-F).
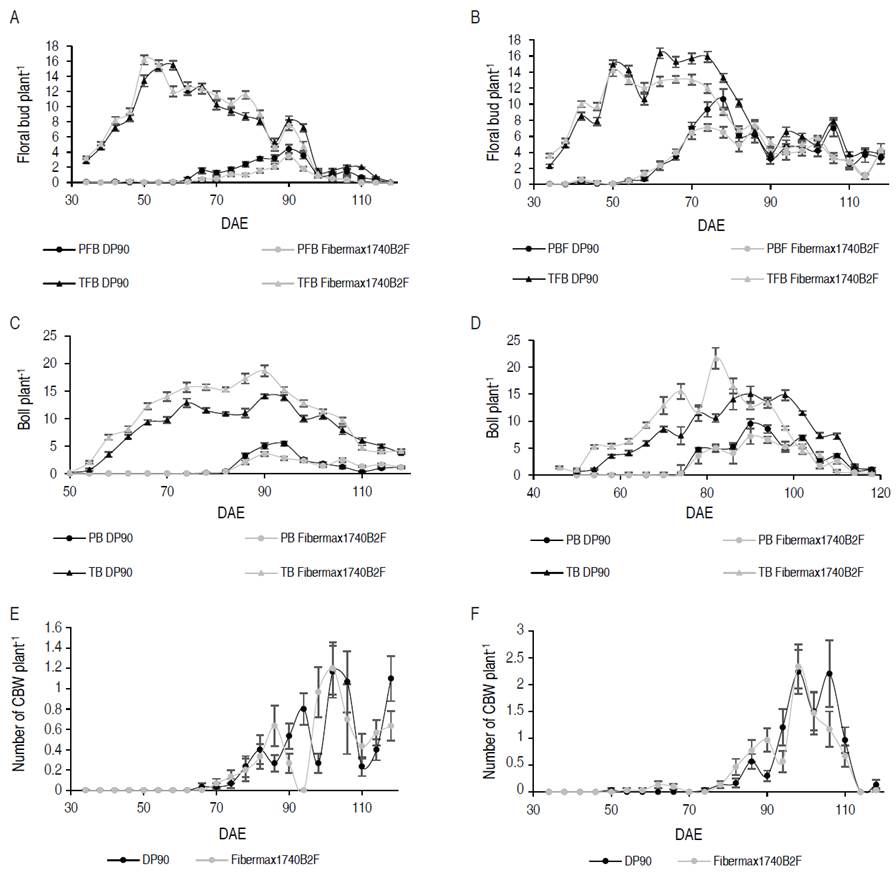
Figure 1 Temporal variation of A. grandis. A. Number of total and perforated average flower buds 2015; B. Number of total and perforated average flower buds 2016; C. Average number of total and perforated bolls 2015; D. Number of total and perforated average bolls 2016; E. Number of average cotton boll weevils (CBW) per plant 2015; F. Number of average cotton boll weevil adults per plant 2016. The black color represents the DP90® variety, while the light gray represents the FM1740B2F variety.
In relation to the percentage of damage caused in PFB, in 2015, the highest damage was reached at 86 DAE with 61.31±4.81% and 46.45±5.96% in non-Bt and Bt, respectively. In 2016, this level of damage reached its maximum potential at 86 DAE with 74.97±7.77% and 80.74±6.96% in their order. These results are similar to the reported by Oliveira et al. (2022), who evaluated the spatio-temporal distribution of Anthonomus grandis and reported higher percentages of infected floral buds during the phenological stages of late flowering and open bolls in the wet and dry season in cotton crops in Brazil. Also, an increase in the infested reproductive structures is expected until 'cut-off' (end of floral bud production). After that, floral buds decline quickly, and the boll weevil populations generally plateau (Showler et al., 2005).
Population fluctuation of complex Spodoptera in non-Bt and Bt cotton
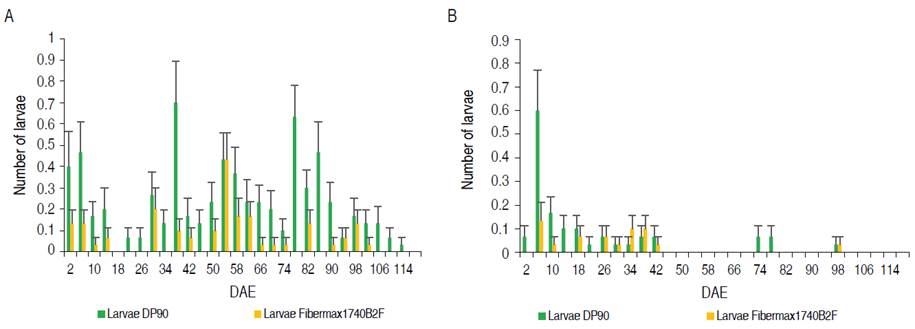
In Figure 2 A-B, shows the populational variation of the Spodoptera complex in cotton crops. These herbivore-insects can affect in different phenological stages, as in the vegetative phase, consuming leaves (Pascua and Pascua, 2002), and in the reproductive phase, feeding on flower buds, flowers, and bolls (Gomes et al., 2017). Regarding the number of larvae, the highest population levels were observed in 2015 (Figure 2A). At 38 DAE, the highest peak was evidenced with 0.7±0.19 larvae per plant in DP90®. From the 90 DAE a constant decrease of the populations is observed. In 2016, a different behavior is presented, where from 2 to 46 DAE larvae were constantly present. At 6 DAE in variety DP90®, the population peak was recorded with 0.6±0.17. After 46 DAE the levels dropped considerably. A lower average number of larvae was found in Bt cotton (0.045±0.01) compared to the conventional (0.138±0.02), which explains the joint efficacy of the Cry1Ac and Cry2Ab proteins on Spodoptera spp. Specifically, for Spodoptera frugiperda, Valencia-Cataño et al. (2014) concluded that the larvae that fed on the variety that contained Cry1Ac + Cry2Ab proteins had a lower survival rate compared to the variety with only Cry1Ac and conventional. However, the levels of Spodoptera spp. in transgenic cotton were not constantly reduced throughout the cotton crop cycle. This has been explained because the mortality of second instar S. frugiperda larvae evaluated in Cry1Ac / Cry2Ab cotton leaf discs are in the range between 69 and 93%, depending on the age of the plant (Sivasupramaniam et al., 2008). Efficiency in the use of pyramided Bt crop technologies is reduced by cross-resistance, antagonism between Bt toxins generated by poor field pest management strategies, similar Bt proteins used between neighboring crops and cross-crop target pests, causes insects to possess resistance to more than one Bt protein present (Liu et al., 2017; Yang et al., 2020; Huang, 2021; Shad et al., 2022). The widespread use of Bt corn has led to the emergence of resistance to the Cry1F protein in Spodoptera frugiperda, which has caused problems in the management of this pest and sustainable use of this technology in countries such as the United States, Brazil and Puerto Rico (Bernardi et al., 2017; Huang, 2021). Research indicates that Cry1Ac endotoxin has mortality levels between 6% and 20% in S. exigua and S. frugiperda species, indicating low toxicity, while Cry2Ab protein has low efficiency in the control of different Spodoptera species (Sivasupramaniam et al., 2008; Britz et al., 2020).
Relationship between yield and cotton pest in non-Bt and Bt cotton
Figure 3 shows the relationship between insect variables and yield. In Figure 3A the correlation matrix for variety DP90® is observed. In this, a direct relationship between TB with yield was indicated (R=0.88), while PB with yield presented a negative correlation with R=-0.71. In floral buds, both PFB and TFB, showed an inverse relationship with -0.49 and -0.66 respectively. Between pest, an opposite relationship between the number of larvae and damage with the number of PFB and PB is registered with a value of -0.71. In Figure 3B, the correlations for FM1740B2F are shown. Yield was inversely related to the number of PB (R=-0.49) and directly correlated with TB (R=0.60). Pest were negatively correlated, the PFB with the number of larvae (R=-0.98), and with the damage (R=-0.75) is highlighted. On the other hand, the number of larvae was inversely correlated with the number of weevils (R=-0.55) and with PB by A. grandis (R=-0.81). The effect of A. grandis on the yield in Bt and non-Bt cotton is explained due to boll weevil is considered the main problem-pest cotton in Colombia. Its management actual includes the remaining 4-6 insecticide applications and when improper management is carried out, losses in yield of between 50 and 250 kg of cotton seed per hectare can be caused (Ñañez, 2012; Brookes, 2020).
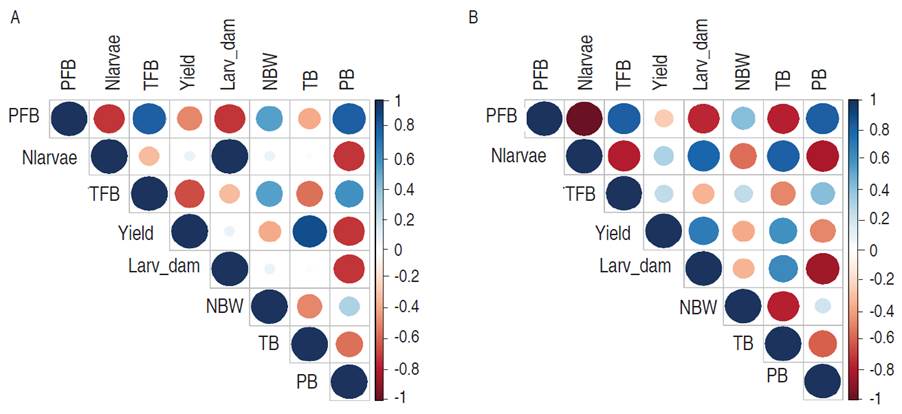
Figure 3 Correlation matrices that explain the relationship between yield and pests in cotton crop. A. DP90®. B. Fibermax1740B2F. PFB= Perforated Floral Buds, Nlarvae= Number of larvae, TFB= Total Floral Buds, Larv_damage= Larvae damage, NBW= Number of cotton boll weevil, TB= Total Bolls, PB= Perforated Bolls.
Figure 4 shows the results of the factorial analysis for mixed data (FAMD). In Figure 4A the biplot for qualitative categories is shown, while in Figure 4B, the circle of correlations is presented for the quantitative variables. The variability explained by the first two components of the FAMD was 82.6%. The principal component one (CP1), with 50.4%, shows a relationship of the A. grandis variables with the years. The variables PFB (0.98), PB (0.94), TFB (0.86) and NBW (0.66) were directly related to CP1, while TB (-0.68) was inverse. This explains that the number of healthy TB was inversely related to all the variables that exerted an insect damage including TFB. Likewise, in years, 2016 was related to a greater damage of A. grandis, compared to 2015.
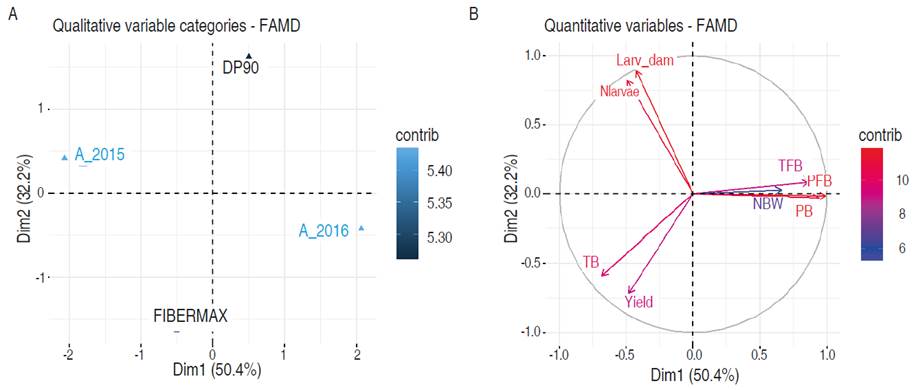
Figure 4 Factorial analysis for mixed data (FAMD). A. Biplot of categories. B. Circle of correlations. PFB= Perforated Floral Buds, Nlarvae= Number of larvae, TFB= Total Floral Buds, Larv_damage= Larvae damage, NBW= Number of cotton boll weevil, TB= Total Bolls, PB= Perforated Bolls.
The main component two (PC2) explained 32.2% and focused on the relationship of the larvae of the Spodoptera complex with the yield and the TB. The number of larvae and the damage were directly correlated to PC2 with 0.89 and 0.82 respectively, while the yield (-0.72) and TB (-0.59) were inverse. The above indicated the inverse relationship of Spodoptera spp. with the yield, which is explained by the joint presence of Cry1Ac- Cry2Ab proteins that has negatively affected the growth rate and feed conversion by the larvae confirming the antibiotic effects of GM crops on the development and survival of these larvae (Valencia-Cataño et al., 2014). Further, the species of the Spodoptera complex in cotton are considered secondary pests in Colombia, although the potential risk of this complex to go from secondary to primary pests in Cry1Ac cotton has been highlighted (Santos et al., 2009).
Comparison of pest accumulation between year and variety
The maximum accumulation point of TFB did not show any statistical difference between varieties (Table 1); however, the DP90® variety showed a higher accumulation with 174.42±8.74 compared to FM1740B2F with 164.35±8.74. Between years, statistically significant differences were found. In 2016 with 186.15±8.73 and in 2015 with 156.67±8.73, respectively. Referring to PFB (Figure 1B), there were no statistical differences between varieties; but discrepancies were observed between years. In evaluation of Bt and non-Bt genotypes for A. grandis, it has been reported that there are no differences in their populations (Nava-Camberos et al., 2018), which is explained because this pest is not targeted by the Bt cotton and the Bollgard II® cotton has no effectiveness against it (Showalter et al., 2009). In 2015, the invasion of A. grandis was retarded, which was explained in a lower accumulation of PFB with 20.36±2.72, in contrast, in 2016, the insect achieved establishment and generalization within the crop, reflected in its accumulation (71.62±8.47). In 2016 with 186.15±8.73 and in 2015 with 156.67±8.73, respectively.
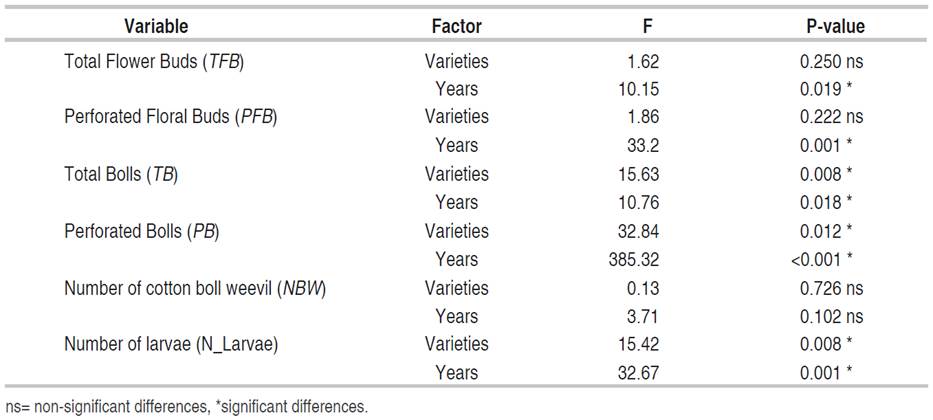
The accumulation of the number of TB, presented statistical differences between years and varieties. Higher TB accumulation was recorded in 2015 (168.94±5.72) compared to 2016 (147.54±5.72). Likewise, in PB (Figure 1D), statistical differences were determined for years and varieties. The variety with Bollgard II® technology showed a lower maximum accumulation point (19.60±1.10), concerning the conventional variety (DP90®) 37.23±1.77. For years, 2015 presented 29.67±1.28 compared to 47.30±1.10 in 2016. In NBW, there were no statistical differences between years and variety; however, lower insect accumulation was observed in 2015 (6.45±1.46) compared to 2016 (10.14±2.17). The results show that in 2015 the establishment of the insect was delayed in time (±80 DAE), with higher accumulation of TB, lower accumulation of PFB and PB; whereas, in 2016, where the establishment was at ±60 DAE, a higher accumulation of PFB, PB and NBW was evidenced; consequently, lower accumulation of TB. Regarding the accumulation of Spodoptera average larvae (N_larvae), there were statistical differences between years and variety. While between years, there was a higher accumulation in 2015, with 4.32±0.57 and 2016 with 1.08±0.16 in conventional and transgenic, respectively. As for varieties, DP90® recorded 4.08±0.58 and Fibermax1740B2F 1.32±0.12.
In the yield variable, there were no statistically significant differences between years (F=5.35; gl=1; P=0.060); however, for 2015, an average yield of 3.16±0.06 t ha-1 was presented, compared to 2.57±0.25 t ha-1 in 2016. In varieties, statistically significant differences were found (F=21.41; gl=1; P=0.0036). The Bollgard II® variety technology presented higher yields with 3.46±0.23 t ha-1 on average, while DP90® registered 2.28±0.10 t ha-1. This corroborates the results presented in Figure 4.
The correlations between climatic factors, with the parameters and productive variables, showed directly proportional relationships between the maximum rate of damage accumulation in flower bud (R=0.87; t=5.6438; P=<0.0001) and boll (R=0.95; t=9.3212; P=<0.0001) with the average temperature. In studies on a global scale, mean annual temperature has been reported as a significant variable influencing the potential global distribution of Anthonomus grandis. The adaptation of the pest remained at the highest level when the annual mean temperature was 23 °C, and the response curve declined until 30 °C to reach stability (Jin et al., 2022). On the other hand, there were inversely proportional correlations between the maximum rate of damage accumulation in flower bud (R=-0.87; t=-5.6438; P=<0.0001) and boll (R=-0.95; t=-9.3212; P=<0.0001) with the average relative humidity. The productive variables did not show significant correlations (P>0.05) with the climatic parameters and factors. When correlations between the populations and climatic variables in different phenological stages were calculated, the following results were obtained: in the vegetative stage, only Spodoptera complex was evaluated, but without statistical significance (P>0.05) with the climatic variables. In reproductive and maturation stages, average temperature, and populations of Spodoptera presented significant statistically direct correlation in the non-Bt cotton with R=0.60 (P=0.0229) and R=0.63 (P=0.0150), respectively. In maturation, PFB showed inversely correlation (P<0.01) with average temperature (DP90®=-0.75; Fibermax1740B2F=-0.80) and positively (P<0.01) with relative humidity (DP90®=0.66; Fibermax1740B2F=0.70).
CONCLUSION
Larvae and damage of the Spodoptera complex were found on cotton plants with Cry1Ac + Cry2Ab endotoxins, indicating some range of resistance to plants with this endotoxin. The presence of larval populations and damage of the Spodoptera complex on Bt cotton plants requires increased monitoring and evaluations; in addition, refuge areas need to be established. In the case of A. grandis, no differences in its populations were recorded, which is explained by the fact that this pest is not a target of Bt cotton and Bollgard II® cotton has no efficacy against it. Appropriate management actions were recommended that incorporate optimal planting dates, constant monitoring of the A. grandis and Spodoptera complex and developing action plans that consider a baseline of resistance in the populations, establishing refuge areas.

