


 English (pdf)
 Article in xml format
 Article references
 Send this article by e-mail
 Cited by SciELO
  Cited by Google
  Similars in
SciELO
Similars in
SciELO  Similars in Google
 Permalink
1. Introduction
Accurate identification of oil and water layers is the basis for the qualitative evaluation of reservoirs' fluid properties or industrial value and for selecting testing layers of the well. According to the existing theories and data, the reservoir resistivity is low after the completion of the pre-exploration well in the more favorable blocks, and the logging display features of the oil layer are not obvious (Su, 2006). In exploration and development, the interpretation or misinterpretation of the oil layer log leakage is often caused, which slows down or restricts the exploration and development process of the oil field. Using the existing technical conditions to identify various types of oil reservoirs effectively is significant to exploring and developing oilfields. When conventional logging methods explain the difficulties encountered by oil and water reservoirs, the analysis data of geological logging and gas logging is another way to solve the problem. The application of geological logging data oil and aquifer identification is the plate method, selecting two features as plates. Usually, all features are made according to every two features for a combination to make all plates, filter out the good effect, and then the multiple plates screened out are connected for oil and aquifer identification.
There are also methods to use various features to build new features to do the plate for oil and water layer identification. The use of new features for oil and water layer recognition requires fewer plates. Still, in the process of new feature construction, it is also necessary to establish many two feature plates based on the establishment. After a lot of theoretical analysis, it is difficult to achieve an excellent organic combination of all features; the effect could be better.
Artificial intelligence technology's continuous development has been widely used in many fields (Wu et al., 2021; Liu, Y., Liu, S., & Ma, 2019; Liang, Chen, & Zhang, 2019; Bengio, Courville, & Vincent, 2012; Dzeroski, & Zenko, 2004; Xing, Zhou, & He, 2022). Artificial intelligence technology can comprehensively consider all the sample characteristics in the model training process by constantly adjusting the weight value of each feature so that the error between the fitted value and the target value of each training sample continues to shrink. When the error value reaches the required accuracy, and the training ends, the trained model is used to identify one sample to measure and able to achieve good results. This method is the comprehensive embodiment of the oil and water layer's identification plate method, which is simpler and better than the plate method. This paper uses random forests in artificial intelligence to identify the oil and aquifer of the Liaohe Depression.
Decision Tree Model
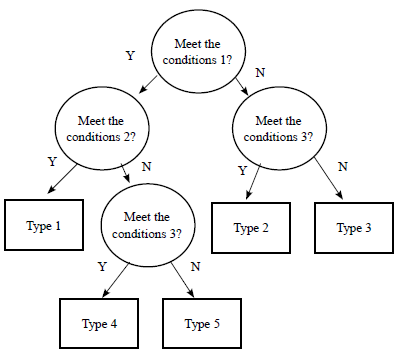
The random forest is based on a decision tree, and the classification decision tree model is a tree structure that describes the classification of instances (Hang, 2012). Decision trees consist of nodes, directed edges, and nodes consist of two types, which are internal nodes, and leaf nodes. Internal nodes represent a feature or attribute, and leaf nodes represent a class. The classification process of the decision tree starts from the root node, tests a specific feature of the instance, and, according to the test results, the instance is assigned to one of its sub-nodes. Then, the corresponding elements of each node are detected and assigned, and finally, the instance is assigned to the leaf node. The class corresponding to the leaf node at this time is the judgment result of the decision tree model.
Feature Selection
The key to the decision tree is selecting the optimal features and dividing the current sample so that the "purity" of the split nodes is higher (Zhou, 2016; Wang et al., 2021; Zhao et al., 2021; Wang et al., 2021).
Information gain
“Information entropy” is one of the most used metrics to measure the purity of a sample set. Suppose that the proportion of samples of the kth class in the current set of samples D is p k (k = 1, 2, ...), then the information entropy of D is defined as |Y|

The smaller the value of Ent(D), the higher the purity of D.
The information entropy D
v
of can be calculated according to Equation 1. Then, considering that the number of samples contained in different branch nodes is different, the branch nodes are given weights  . The more samples there are, the greater the influence of the branch nodes, so it is possible to calculate the attribute 'a' to divide the sample set D: "Information Gain."
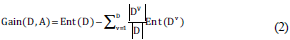
In general, the information gain is greater, and the "purity boost" obtained is greater by dividing using the attribute'a'. Therefore, we can use the information gained for attribute selection. The famous ID3 decision tree learning algorithm uses the information gained as a reference to select the division attributes.
Gini Index
There is also a classification index called the Gini index which uses the same symbol as 1, and the Gini index can measure the purity of data set D

Intuitively, the Gini Index reflects the probability that two random samples were taken from dataset D with inconsistent categorical markers. Therefore, if the Gini index Gini(D) is smaller, the purity of dataset D is higher.
Expressed by the same symbol as Equation 2, the Gini index of attribute 'a' is defined as follows:
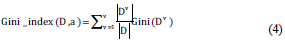
Thus, in the candidate set of attributes 'A', the attribute that makes the Gini exponential minimal after the division is chosen as the optimal division attribute, i.e., a ⁎ = arg aϵA maxGini_index(D,a).
Self-service sampling
Self-service sampling is a standard sampling method. Given a dataset D containing m samples, we sample it to produce a dataset D': each time a random sample is selected from D, copied into D', and then put the sample back, making m times such a retraction sample, you can get a dataset D' with a sample count of m, which is the result of self-service sampling. A part of the sample in D appears multiple times in the D', and a part does not appear. To make a simple estimate, the probability that a sample will never be taken in m-samples is that the limit is available  .
.
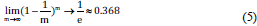
That is, through self-service sampling, about 36.8% of the samples in the original dataset D did not appear in the sampling dataset D'. So, we can train the model with D' as the training set and D-D' as the test set. Then, we use m training samples on both the model of the actual evaluation and the expectation evaluation. About a third of the samples still do not appear in the training set to test, and such test results are also known as "out-of-bag estimates."
Random Forest
Random forest (RF) is an extension of Bagging (Breiman, 2001; Zhou et al., 2017; Lai et al., 2021; Zhong et al., 2022; Kang, & Lu, 2020). RF is based on a decision tree-based learner, built on top of Bagging, and introduces a new feature of random attribute selection in individual learner training. During training, the decision tree is divided according to the Gini index or information gain of the current node, and the optimal attribute is selected, while the random forest is different. In the process of training each base learner, the random forest arbitrarily selects k from all the features (attributes), and uses this k features to train the base learner, and the training process is the same as the training decision tree, using the partition criteria to divide the samples in the node. The parameter k represents the randomness of feature selection and controls the degree of introduction of randomness. When k is equal to the number of features in the dataset, the base learner is the same as the traditional decision tree. When k=1, only one feature is divided at a time. In general, it is recommended to take or for k (d is the number of features) (Breiman, 2001).
The Random Forest algorithm is simple and easy to implement, and is known as the "representative method of ensemble learning" because of its strong performance in many tasks. Compared to bagging, random forests not only use sampling methods, but also perturb the training set. Adding randomness, the base learner is also trained by randomly selecting features. Introducing randomness, which is the data sample perturbation and input attribute perturbation of random forest, makes each basic learner in random forest very different, and finally improves the generalization performance of ensemble.
2. Data Preprocessing
In this paper, the NMR logging data and geochemical logging data in the eastern and western Liaoning Rivers are taken as examples, and the oil and water layers are identified by using a random forest algorithm. There are a total of 79 samples in the eastern Part of the Liaohe River and 99 samples in the western part of the Liaohe River. A total of 9 features of lithology, porosity, permeability, movable fluid, oil saturation, S0, S1, S2, and Tmax were selected for analysis, and the appropriate features were selected, which had a great impact on the accuracy of the model.
2.1 Added oil level features
Through the observation data, it can be found that the lithology of some layers is igneous, but most of the lithology of the layers is sedimentary, and there is an oil-bearing level in the lithology of the sedimentary rock, and since the oil-bearing level is crucial to the analysis of the oil-bearing water layer, it is necessary to convert the oil-bearing level to a numerical format. According to the industry standard of 89 years (SYT5364- 89), this article improves on it by setting the saturated oil to 97.5, the enriched oil to 85, and the oil immersion to 57.5, the oil spot is 22.5, the oil trace is 3, the fluorescence is 1, the oil content level is higher, the value is greater, that is, the proportion is greater. For igneous rocks, set the oil level to a missing value and deal with it later. Observing the data can also find missing geochemical pyrolysis data for some samples, which are also set as missing values for later processing. According to the branching rule of decision tree, when dividing a node, it has nothing to do with the size of the value, but only how much the value is, so the number is set. It has no effect on the actual division, but it is converted into a numeric type to facilitate subsequent processing of missing values.
2.2 Handle missing valúes
Observations have found that some samples lack geothermal data and igneous rocks lack oil levels. There are three common ways to handle missing values (Cheng, 2007). The first method is to discard the data, discarding samples with missing values and leaving only the samples with complete data. However, in the process of logging, less data is obtained. If the sample with missing values is discarded, there will be fewer samples available for use, which is not conducive to our model building, and the accuracy of the model after the establishment will be affected. The second method is to use other variables as a predictive model to calculate the missing variables, but this method has a fundamental flaw. If the other variables are not related to the missing variables, the predicted result is meaningless, and if the prediction is fairly accurate, it is not necessary for this variable to add to the model. The third method is replaced by mean, median, quantile, mode, random number, etc. This article adopts the average of the same sample to fill in the missing values, because the same samples should have similar properties, and the value of this attribute should fluctuate within a certain range, so the mean is used instead of the missing values.
In fact, for the random forest algorithm, there is another method of filling in missing values that is unique to this algorithm (Cutler et al., 2004). First, the affinity among the samples is calculated, and then the affinity is used as the weight, and all non-missing values are weighted, and the average value is obtained instead of the missing value. This method is only valid in random forest algorithms, because calculating affinity among samples is an advantage of random forest algorithms. This filling method results in better performance than the previous methods, but the amount of computation increases. As the number of samples and the number of base learners increases, the calculation time increases. This article uses the average of each feature to populate the missing values to reduce the workload.
2.3 Deal with sample imbalance problems
Due to practical factors and other reasons, the number of samples obtained is not much, and after the statistics of the samples (Table 1), it is found that there are 4 samples of the aqueous oil layer in the eastern part of the Liaohe River, 11 oil-water layers, 12 oil layers, 21 dry layers and 31 water layers. There are 1 aqueous oil layer in the western part of the Liaohe River, 3 dry layers, 7 oil-water layers, 7 self-injection layers, 16 low-yield oil layers, 17 dry layers and 48 oil layers.
Table 1 Statistics of sample categories in Liaohe depression
| Category | Number of samples | |
|---|---|---|
| Eastern | Westward | |
| Aqueous oil layer | 4 | 1 |
| Dry layer | 21 | 3 |
| Oil and water are in the same layer | 11 | 7 |
| Self-injecting layer | - | 7 |
| Low-yielding reservoir | - | 16 |
| Dry layer see oil | - | 17 |
| Reservoir | 12 | 48 |
| Water | 31 | - |
| Total | 79 | 99 |
Random forest algorithm, using self-sampling method, about 36.8% of the samples cannot enter the training set, through the statistics can be found that the eastern Liaohe aquifer only 4 samples, far below the aquifer 31 samples, while the western Liaohe River aquifer and dry layer only 1 and 3, far lower than the oil layer 48. This will lead to a large probability that a small sample size of the class cannot be, or only a very small number of samples will be collected into the training set, resulting in the trained model of the class of recognition of the class of samples is low, or cannot be distinguished, the generalization ability of the model is insufficient, the new sample, especially the small sample category cannot be judged.
For this kind of extreme sample imbalance problem, there are two solutions, one is to improve the sampling method, so that the number of samples in the sample set reaches the same level. This method is called balanced random forest, and the other is to use a weighted random forest, that is, through the cost-sensitive learning method, the learner is improved, so that its prediction results are connected with the weights, thereby improving the performance of the learner. This paper uses the first method, which is "oversampling" technique, to construct a balanced random forest algorithm.
Specifically, there are two ways to equalize the number of samples of each type of sample in the sample set. One is to randomly select the same number of samples as the class with the smallest number as samples of this class by "under-sampling" the samples of a larger number of categories. This will give you a new sample set. The number of samples of each type in the sample set is equal. Therefore, during self-service sampling, each type of sample may be selected into the training set, and there will be no sample imbalance. As a result, the model has insufficient learning ability for certain types of samples, or cannot learn. But the biggest problem with this method is that in the process of undersampling, a lot of information will be lost. Because the selection process is completely random, the information of some samples cannot enter the training set and be learned by the model.
The other way is "oversampling", in which a random sample with replacement in the current class is selected and replicated until it is the same as the number of main samples. This avoids the loss of a lot of information from undersampling. But the shortcomings are also obvious. For example, in the west of the Liaohe River, there is only one water-bearing oil layer sample. If you replicate this sample 47 times, you get 48 identical samples. If the learner learns it, it will lead to serious overfitting, and the generalization ability to the new water-bearing oil layer samples is weak. The samples are classified because the learner cannot delineate a valid region in the feature space.
Chawla et al. (2004) proposed a method called SMOTE that could effectively improve the overfitting problem caused by replicating samples during "oversampling". The basic process of the SMOTE method is that in the small category sample, a sample is selected, and the K nearest neighbor algorithm calculates the k samples that are closest to the sample, for each feature, one is randomly selected from the k nearest neighbor sample, the difference between the two features is calculated, multiplied by a random number greater than 0 less than 1, and then added back to the original sample, which is actually a point on the connection line between the two samples in the feature space, and then after all the features are done, a new sample can be obtained. This method can effectively make the decision space of small category samples more generalized.
For the Liaodong and Western Liaoning data used in this paper, if you choose undersampling, the samples of the trained model will be seriously insufficient, and the performance of the model will be greatly reduced. In order to compare the impact of the SMOTE algorithm and the "oversampling" method by copying on the model, this article will use two methods to calculate the out-of-package estimation accuracy.
First, calculate which type of sample has the most samples in the area, and then expand the other categories through "oversampling", and use the "oversampled" dataset to train the model. Since there is only one "oil and water layer " sample in the western Part of the Liaohe River, even if the MOVE method is used, it cannot be effectively expanded. If it is copied 47, it will cause the model to be seriously overfitted. When calculating the out-of-package estimation accuracy, it will also be affected, resulting in a higher accuracy obtained than normal, so this point is deleted here. Through "oversampling", the number of samples in the eastern part of the Liaohe River expanded to 155 and the western Part of the Liaohe River to 288. Train a random forest with an enriched dataset and measure its performance with out-of-package estimation accuracy.
However, if the sample is balanced by copying the "oversampling", then using the processed sample to calculate the out-of-package estimate is less efficient. Because "oversampling" will lead to overfitting, take the sample in the western Liaohe River, for example, because there is only one aquifer sample, if the learner completely "writes down" the characteristics of this sample, then the sample after "oversampling" is used, it will successfully judge 48 times, which will make the calculation of the learner accuracy, the molecular denominator increases by 47 at the same time, resulting in an increase in accuracy. Even if it is deleted, then in other small categories of samples, a similar situation will occur, affecting the accuracy of the model, so the original sample should be used to calculate the out-of-package estimate.
3. Adjust the learner parameters
Most machine learning algorithms have parameters that need to adjust and set, that is, tuning parameters. Many times, the setting of parameters can often determine the quality of the learner. For the stochastic forest algorithm, there are also many important parameters, such as the number of base learners, that is, the number of decision trees. How many features to use for training, etc. out-of-package estimation used to adjust the parameters. The error rate estimated out of package is lower, the generalization ability of the adjusted model is stronger.
3.1 The number of features used
As can be seen from Figure 2 and Figure 3, when the number of base learners is small, the accuracy is not high, and when 15 base learners are reached, the accuracy can be stabilized at 90 % above, and then increase the number of base learners, the effect on accuracy improvement is not large. The number of base learners is greater, the generalization ability of the integration is stronger. After reaching a certain number, the improvement of accuracy is no longer obvious. At the same time, the number of base learners is greater, the training time is longer, because every time a base learner is trained, a new self-service sample of the sample needs to be trained, and a new base learner needs to be trained.
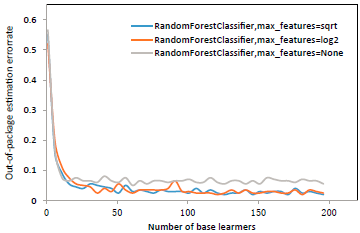
Figure 2 Relationship between the number of subbase learners in different max_ features in the western part of the Liaohe River and the error rate of out-of-package estimation
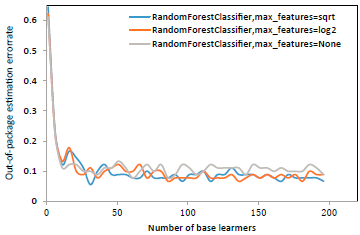
Figure 3 Relationship between the number of subbase learners in different max_ features in the eastern part of the Liaohe River and the error rate of out-of-package estimation
For the random forest algorithm, there is also an important parameter, that is, how many features are used to train each base learner. According to Breiman’s research (Breiman, 2001). It is recommended log2d to train with individual features, while it is proposed that training with individual features often results in good performance. Therefore, this paper uses three methods, using individual features √d, individual features, and all features for training, and draws a graph of the relationship between the number of base learners and the error rate of out-of-package estimation in three cases (Figure log2 d 2, Figure 3). It can be seen that the error rate of out-of-package estimation is very similar in the three cases, and only the random forest classifier trained with all features has a slightly higher error rate, which also shows the effect of using the random feature training base learner to introduce randomness and improve the generalization ability of random forests. However, the direct reason why it is not possible to see log2d√d, which feature has more advantages is that the characteristics selected for this experiment are oil content level, porosity, permeability, movable fluid, oil saturation, S0, S1, S2, Tmax has a total of 9 features, |log29| and equal √9(|x|for x rounding down), are equal to 3, so there is no difference in theory. But when the number of features is large enough, you can see the difference in performance between the two.
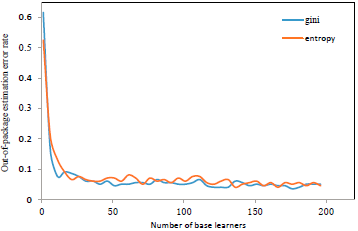
3.2 Selection of División Criteria
Using the Gini index yields roughly similar results to information gain. The blue line represents the base learner of the random forest trained using the Gini index, and the green one is training using the information gain (Fig. 4, Fig. 5). It can be seen that the use of Gini index and information gain does not have much effect on the error rate of out-of-package estimates.
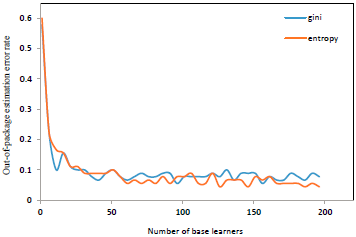
Figure 4 The relationship between number of base learners and out-of-bag estimate error rate under different division criterion in the east of Liaohe depression
4. Characteristic analysis
There is also a by-product of using random forest. By building a model through the random forest algorithm, the contribution of each feature to the model can be obtained, also known as Gini importance (Pedregosa et al., 2012). When training the base learner, the Gini index is used to divide the nodes each time, so that the Gini index of the two child nodes is smaller than that of the parent node. The importance of each feature is obtained by summing the Gini index reductions for all features in each tree in the random forest. Implementation method: multiply the number of samples of the parent node by the Gini impurity of the current node, and subtract the number of samples of the root node of the left and right subtrees and their corresponding Gini impurity, and the important part of the division feature corresponding to the node can be obtained. After calculating the Gini importance of all nodes to their divided features by this method, sum them by feature, and then standardize it to obtain the importance of each feature.
Because the random forest uses the same data every time, the training set obtained by the self-sampling method is different, and the features used for training are different. Therefore, this article attempts to use 100 basic learners to perform 10 training sessions on the "oversampling" samples, calculate the 10 times, and take the average value of the importance of each feature to obtain the following table (Table 2~ Table 3).
Table 2 Importance of characteristics in the east of Liaohe depression
| features | porosity | Penetration | Movable fluids | Oil saturation | S0 | S1 | S2 | T max | The rock surface contains oil | OOB accuracy |
|---|---|---|---|---|---|---|---|---|---|---|
| 1 | 0.16 | 0.08 | 0.10 | 0.06 | 0.05 | 0.11 | 0.21 | 0.09 | 0.14 | 0.92 |
| 2 | 0.15 | 0.07 | 0.09 | 0.07 | 0.07 | 0.12 | 0.22 | 0.07 | 0.14 | 0.92 |
| 3 | 0.14 | 0.08 | 0.09 | 0.08 | 0.05 | 0.11 | 0.20 | 0.09 | 0.15 | 0.91 |
| 4 | 0.13 | 0.08 | 0.10 | 0.07 | 0.06 | 0.11 | 0.22 | 0.10 | 0.14 | 0.91 |
| 5 | 0.14 | 0.07 | 0.11 | 0.05 | 0.05 | 0.11 | 0.23 | 0.09 | 0.14 | 0.90 |
| 6 | 0.16 | 0.05 | 0.09 | 0.08 | 0.05 | 0.11 | 0.20 | 0.10 | 0.15 | 0.90 |
| 7 | 0.15 | 0.06 | 0.13 | 0.07 | 0.05 | 0.10 | 0.24 | 0.08 | 0.13 | 0.89 |
| 8 | 0.15 | 0.08 | 0.10 | 0.06 | 0.06 | 0.12 | 0.19 | 0.09 | 0.14 | 0.89 |
| 9 | 0.13 | 0.09 | 0.11 | 0.06 | 0.06 | 0.12 | 0.21 | 0.09 | 0.13 | 0.92 |
| 10 | 0.13 | 0.06 | 0.10 | 0.07 | 0.05 | 0.15 | 0.21 | 0.10 | 0.13 | 0.90 |
| Average value | 0.14 | 0.07 | 0.10 | 0.07 | 0.06 | 0.12 | 0.21 | 0.09 | 0.14 | 0.91 |
Table 3 Importance of characteristics in the west of Liaohe depression
| features | porosity | Penetration | Movable fluids | Oil saturation | S0 | S1 | S2 | Tmax | The rock surface contains oil | OOB accuracy |
|---|---|---|---|---|---|---|---|---|---|---|
| 1 | 0.13 | 0.09 | 0.11 | 0.11 | 0.08 | 0.08 | 0.14 | 0.09 | 0.17 | 0.95 |
| 2 | 0.12 | 0.08 | 0.11 | 0.13 | 0.07 | 0.09 | 0.16 | 0.08 | 0.17 | 0.94 |
| 3 | 0.13 | 0.09 | 0.10 | 0.12 | 0.08 | 0.08 | 0.15 | 0.07 | 0.18 | 0.95 |
| 4 | 0.13 | 0.09 | 0.11 | 0.12 | 0.07 | 0.09 | 0.16 | 0.08 | 0.16 | 0.96 |
| 5 | 0.14 | 0.09 | 0.12 | 0.12 | 0.08 | 0.07 | 0.14 | 0.08 | 0.16 | 0.94 |
| 6 | 0.12 | 0.09 | 0.12 | 0.13 | 0.08 | 0.09 | 0.15 | 0.08 | 0.15 | 0.94 |
| 7 | 0.15 | 0.08 | 0.11 | 0.12 | 0.08 | 0.09 | 0.14 | 0.08 | 0.15 | 0.95 |
| 8 | 0.13 | 0.10 | 0.11 | 0.12 | 0.08 | 0.09 | 0.13 | 0.08 | 0.15 | 0.96 |
| 9 | 0.13 | 0.09 | 0.12 | 0.11 | 0.07 | 0.08 | 0.14 | 0.07 | 0.19 | 0.95 |
| 10 | 0.14 | 0.09 | 0.12 | 0.13 | 0.07 | 0.08 | 0.15 | 0.08 | 0.16 | 0.95 |
| Average value | 0.13 | 0.09 | 0.11 | 0.12 | 0.08 | 0.08 | 0.15 | 0.08 | 0.16 | 0.95 |
By sorting the average values in the two tables (Table 4), it can be observed that in identifying the oil and water layer in the eastern and western Parts of the Liaohe River, the rock pyrolysis parameters S2, the oil content of the rock surface and the porosity are more important to the model, while the permeability is SQ Low contribution to the model. It may be because the permeability of the rock only determines how much the rock of the formation affects the fluidity of the fluid, and does not determine which type of layer it is. When the permeability of the rock is very large, it may be a dry layer, or it may be an oil layer or a water layer, but when the permeability is very small, the possibility of being a dry layer is very large, but the possibility of oil layer and water layer will be very small. That is to say, the permeability of rocks influences the identification of oil and water layers to a certain extent, but its range of action is limited. However, the pyrolysis parameters can determine the content of organic matter, the type of organic matter and the maturity of the rock, so the pyrolysis data is more effective for dividing the oil layer.
Table 4 Importance ranking of characteristics in the East and west of Liaohe depression
| Eastern part of the Liao River | Gini importance | West of the Liao River | Gini importance |
|---|---|---|---|
| S2 | 0.21 | Oily grade | 0.16 |
| Oily grade | 0.14 | S2 | .15 |
| porosity | 0.14 | porosity | 0.13 |
| S1 | 0.12 | Oil saturation | 0.12 |
| Movable fluids | 0.10 | Movable fluids | 0.11 |
| Tmax | 0.09 | Penetration | 0.09 |
| Oil saturation | 0.07 | Tmax | 0.08 |
| Penetration | 0.07 | S1 | 0.08 |
| S0 | 0.06 | S0 | 0.08 |
In the process of machine learning, because each learned sample and test sample are random, the accuracy of the results is also different, the confidence interval is used to evaluate the results, and the east and west use a confidence level of 0.95, and the eastern accuracy rate is 89.9%~ 91.5%, the western accuracy rate is 94.4%~ 95.4%.
5. Conclusion
Through the numerical treatment of oil-containing grades and sample imbalance, a good prediction effect was obtained.
The method operation is simple, the traditional plate method needs to build new features, and the operator needs to have a strong theoretical foundation, and there are often various problems in the application pro-cess, which undoubtedly brings obstacles to the promotion of the plate. The random forest method only needs to adjust the parameters, especially when the number of bases is large, the effect is better, and it has outstanding advantages over the traditional square layout method.
This paper adopts the SMOTE oversampling method to solve the problem of data imbalance and ensure the accuracy of the method. The maximum number of features for a single tree is "sqrt" and "log2", and the error rates are similar, which are lower than selecting all features. Each tree random-ly selects features, adding feature disturbance, and the error rate of the standard parameters for dividing the Gini coefficient and information gain is not much different. From the characteristic analysis, it can be seen that pyrolysis and oil-bearing grades are important features in the identification of oil and water layers in both the eastern and western regions, which is consistent with the traditional plate method and theoretical knowledge.
From the prediction results, random forest has a high accuracy in the identification of reservoir water. At a confidence level of 0.95, the accuracy rates in the east are 89.9%-91.5%, and the accuracy in the west is 94.4%- 95.4%. The lower value in the eastern region is mainly related to the amount of data and is caused by the imbalance of data types. With the continuous development of big data and artificial intelligence, machine learning will find more applications in the field of oil and gas exploration.

