


 English (pdf)
 Article in xml format
 Article references
 Send this article by e-mail
 Cited by SciELO
  Cited by Google
  Similars in
SciELO
Similars in
SciELO  Similars in Google
 Permalink
Introduction
In most tropical countries, fresh sugarcane is an alternative forage used in dairy farms during the dry season. An advantage of using this crop is the agronomic yield of sugarcane, which can reach 50 tons/ha/year for one cut, which accounts for more than 620 g/kg of total digestible nutrients (Valadares Filho et al., 2006). Additionally, the peak nutritive value of sugarcane in terms of sucrose accumulation occurs simultaneously as the senescence period of tropical pastures. However, the use of sugarcane in its fresh form requires daily cutting, which could cause differences in daily composition over the season and lead to regrowth differences throughout the field, thereby reducing crop life. Furthermore, daily cutting could increase milk production costs.
Sugarcane ensilage is an alternative for improving the logistics of forage supply, reducing operating costs, and increasing the time that sugarcane fields can be used. Nevertheless, the high content of soluble carbohydrates and yeast in the plant could lead to alcoholic fermentation during ensilage, which may cause excessive dry matter losses (Carvalho et al., 2015). The addition of chemical additives during sugarcane ensiling could improve the fermentation process and dry matter preservation (Andrade et al., 2016). Additionally, these additives could favor beneficial microorganisms, such as lactic acid bacteria, or inhibit undesirable microorganisms, such as yeasts and clostridia (Chizzotti et al., 2015). Ensilage also helps to reduce indigestible fiber content. Sugarcane has high indigestible neutral detergent fiber (iNDF) concentrations (approximately 30 g/kg dry matter; Daniel et al. 2013). Thus, using chemical additives during ensiling could improve dry matter (DM) and iNDF digestibility by cell wall hydrolysis (Chizzotti et al. 2015; Andrade et al. 2016). Improved digestibility is another benefit of using chemical additives in silages. We hypothesized that a combination of urea and calcium oxide during sugarcane ensiling could improve intake, digestibility, nitrogen balance, and ruminal microbial synthesis in crossbred dairy cows.
Thus, an experiment was conducted to test this hypothesis.
In this context, the objective of this study was to evaluate sugarcane silage preservation with urea and calcium oxide on dairy cow performance and metabolic efficiency.
Materials and methods
Ethical considerations
All animal procedures were performed following protocols authorized by the Ethics Committee of Southwest Bahia State University, Brazil (Permit Number: 033/2010).
Location
The experiment was conducted at the Instituto Federal de Educação, Ciência e Tecnologia do Norte de Minas Gerais, Salinas, BA, Brazil (16°10’13” S and 42°17’25” W), and the chemical composition was determined at the Laboratory of Analysis and Animal Nutrition of Universidade Estadual do Sudoeste da Bahia, Brazil.
Animals, experimental design, and diets
Eight crossbred cows averaging 100 days of lactation were distributed in two 4×4 Latin squares consisting of four cows, four treatments (diets), and four experimental periods, with each period lasting 15 days. The first 12 days of each experimental period were used for adaptation to the diet, and the 13th to 15th days were used for data collection. Four experimental diets (Table 1) were evaluated: sugarcane silage without additive (SS or Control), sugarcane silage with 10 g/kg urea in the fresh forage (SU), sugarcane silage with 5 g/kg urea + 5 g/kg CaO (calcium oxide) (SUC), and sugarcane silage with 10 g/kg CaO (SC). Diets were formulated to be isonitrogenous and reach an average production of 15 kg milk/ day, according to the NRC (2001).
Table 1 Proportion of ingredients and chemical composition of the experimental diets.
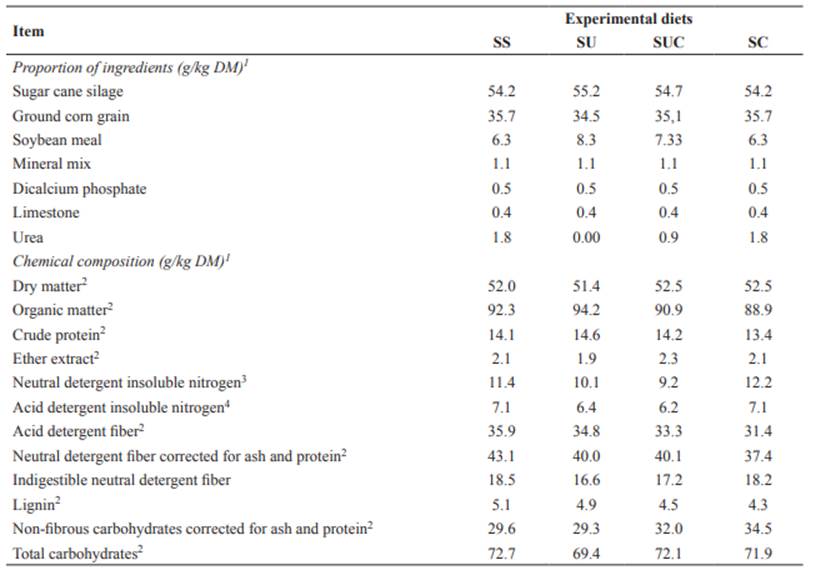
1SS: sugarcane silage without additive; SU: sugarcane silage with 10 g/kg urea; SUC: sugarcane silage with 5 g/kg urea + 5 g/ kg CaO; and SC: sugarcane silage with 10 g/kg CaO.
2Percentage of dry matter.
3Percentage of total N.
4Percentage of total N.
Feeding, performance, and digestibility
Feed was provided twice daily at 08.00 and 16.00 h, and it was adjusted, so there was no more than 100 g/kg leftover. Cows were machine- milked twice daily at 07.30 and 15.30 h from the 13th to 15th day of each experimental period, and the individual milk production was recorded. The 4% fat-corrected milk (FCM) was calculated according to Sklan et al. (1992).
Feces were collected directly from the rectum twice daily at 08.00 and 16.00 h from the 13th to 15th day of each experimental period. The estimated production of fecal dry matter (DM) was determined using indigestible neutral detergent fiber (iNDF) as an internal marker (Detmann et al., 2007). The iNDF was used as an internal marker to estimate the apparent digestibility coefficients and was obtained after 240 h of ruminal incubation time.
Chemical and biological analyses
Dry matter (DM), organic matter (OM), and crude protein (CP) analyses were performed according to the AOAC (2000) methods number 934.01 for DM, 930.05 for OM, and 981.10 for CP. Ether extract (EE) was analyzed according to the AOAC (2000), method number 920.39. Neutral detergent fiber (NDF) contents corrected for ash and protein (NDFap) were estimated following Mertens (2002) procedure, with corrections performed as recommended by Mertens (2002) and Licitra et al. (1996), respectively. Lignin was determined according to the AOAC (2002) by solubilization of cellulose with 72% (w/v) sulfuric acid. Nonfibrous carbohydrates corrected for ash and protein (NFCap) were calculated as proposed by Hall (2003).
Non-fibrous carbohydrates corrected for diet ash and protein (NFCap) were estimated according to Hall (2000), in which NFCap (%) = 100 - [%CPdiet - %CPurea + %Ureadiet) + %EE + NDFap + %MM)], while total carbohydrates (TC) were estimated as proposed by Sniffen et al. (1992), as follows: TC = 100 - (%CP + %EE + %MM).
Urine collection was performed as a spot sampling after spontaneous urination approximately 4 h after supplying the morning feed. The samples were filtered with cheesecloth, and a 10-ml aliquot was separated and diluted with 40 ml sulfuric acid (0.036 N) to quantify urinary concentrations of urea, creatinine, uric acid, and allantoin (Valadares et al., 1999).
Urinary concentrations of creatinine, uric acid, allantoin and urea nitrogen (UUN), and milk urea nitrogen (MUN) were determined by enzymatic-colorimetric assays using commercial kits (Bioclin, Belo Horizonte, Brazil). Urinary allantoin content was estimated by a colorimetric method as specified by Chen and Gomes (1992). Daily creatinine excretion was used to estimate total urine volume by spot sampling, and it was 24.05 mg/kg body weight (BW) (Chizzotti et al., 2006).
Urine volume was estimated from the relationship between total creatinine excretion (mg/kg BW) and the average concentration of creatinine (mg/L) in each spot sample. The result was multiplied by the body weight of the respective animal.
Excretion of total purine derivatives (TP) was estimated by adding the amount of allantoin and uric acid excreted in urine and milk allantoin. Absorbed microbial purine (mmol/day) was estimated from total purine excretion (mmol/day) using the equation proposed by Verbic et al. (1990).
Ruminal microbial nitrogen (g MN/day) was estimated from the amount of absorbed purines (mmol/day) according to the equation by Chen and Gomes (1992). In the present study, values of 70 for N content in purines (mg/mmol), 0.83 for intestinal digestibility of microbial purine and 0.116 for the ratio of purine N:total N were used. Efficiency of microbial protein synthesis was determined by dividing microbial protein synthesis (g/day) by total digestible nutrient intake (kg/day).
Nitrogen balance (NB) was calculated as the difference between total nitrogen intake (total N) and total nitrogen excreted in feces (feces N), and urine (urine N) and secreted in milk (milk N). Total nitrogen in feces and urine was determined according to the methodology described by AOAC (2000), and milk nitrogen was analyzed by enzymatic and spectrophotometric analyses (Chemspec 150 Analyzer, Piracicaba, Brazil).
Results
The DMI (expressed in kg/day and as g/kg BW) was higher (p<0.05) in cows fed the SC or SUC diets; however, it was lower in cows fed the SU diet (Table 2). The CP intake did not differ among diets (p>0.05). The NFCap intake differed (p<0.05) among diets and was lower in cows fed the SU diet compared to animals fed the SUC, and SC diets. Besides, the CaO content in the diets contributed to improved nutritive value of silages by reducing the NDFap content (Table 1) and increasing the NFCap intake.
Higher OM intake (p<0.05) was observed in cows fed the SC and SUC diets compared to animals fed the SU diet. However, it did not differ (p>0.05) among animals fed these diets, and cows fed the SS diet. The SU diet promoted a lower intake of OM and NFCap. This result demonstrates the positive effect of CaO for inhibiting the loss of nutrients in the silage. The TDN intake was higher (p<0.05) in cows fed SC and SUC than in animals fed the SU diet.
Thus, diets containing sugarcane silage with CaO resulted in higher intake of DM and most nutrients. In contrast, cows fed the SU diet had the lowest intake of DM and nutrients.
Apparent digestibility of DM, NDFap, MO, and TDN did not differ (p>0.05) among diets (Table 3). The highest apparent digestibility of CP (p<0.05) was observed when cows were fed the SU diet, and the lowest in animals fed the SC diet. This result is probably due to the higher percentage of soluble nitrogen in the SU diet, which negatively affected intake. The highest apparent digestibility of EE (p<0.05) was observed in cows fed the SS or SUC diets, and the lowest digestibility was observed in animals fed the SC diet. This result agrees with the intake of EE, which was higher for these same diets. The highest apparent digestibility of NFCap (p<0.05) was observed in cows fed the SC diet, and the lowest digestibility in animals fed the SU diet. Similar apparent digestibility of TC was observed among the SS, SUC, and SC diets (p>0.05). Besides, the lowest apparent digestibility of TC was observed in cows fed the SU diet.
Nitrogen balance was positive in all tested diets; i.e., the amount of nitrogen consumed by the animals was higher than that excreted (in feces and urine) and secreted in the milk. This result confirms that crude protein was not lacking in the diets. However, whether this protein is completely metabolizable remains unclear. The N intake (g/day) was lower (p<0.05) in cows fed SS, and SC diets compared to animals fed the SUC diet (Table 4). Although SS or SC provided higher DMI, the amount of N intake was lower. This result probably reflects the fact that diets formulated with urea (5 and 10 g/kg) had higher N concentrations.
Cows fed the SUC diet had higher urinary excretion of nitrogen (p<0.05) than animals fed the SC diet (Table 4). However, there was no difference in urinary excretion of nitrogen among cows fed SS, SU, and SUC diets.
Table 2 Daily intake of nutrients in crossbred cows fed diets containing sugarcane silage treated with urea and calcium oxide.
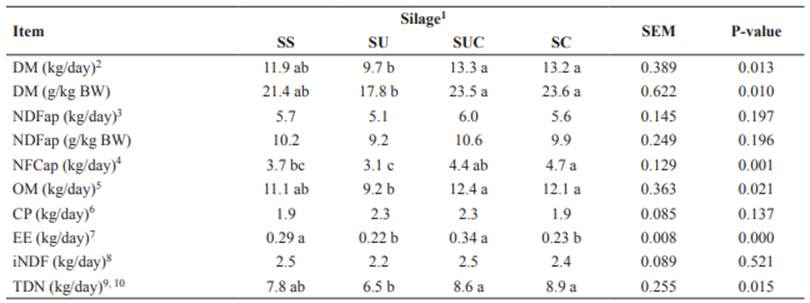
Means with the same letter within the same row do not differ based on Tukey’s test at 5% significance.
1SS: sugarcane silage without additives; SU: sugarcane silage with 10 g/kg urea; SUC: sugarcane silage with 5 g/kg urea + 5 g/kg CaO; and SC: sugarcane silage with 10 g/kg CaO. SEM: standard error of the mean.
2DM: dry matter.
3NDFap: neutral detergent fiber corrected for ash and protein.
4NFCap: non-fibrous carbohydrates corrected for ash and proteins.
5OM: organic matter.
6CP: crude protein.
7EE: ether extract.
8iNDF: indigestible neutral detergent fiber.
9TDN: total digestible nutrients.
10Estimate via equations from the NRC (2001).
Table 3 Nutrient digestibility and milk production in crossbred cows fed diets containing sugarcane silage treated with urea and calcium oxide.
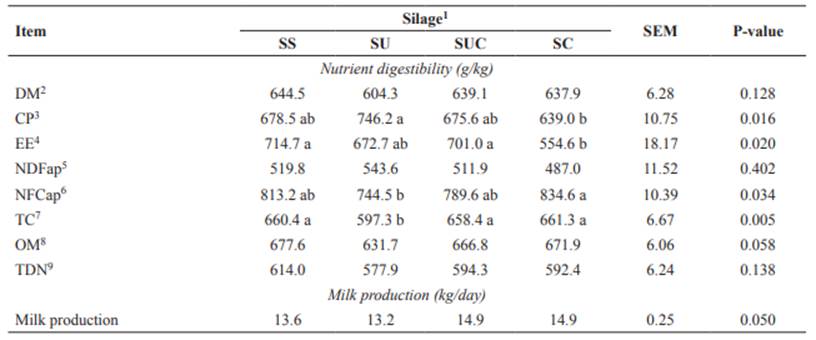
Means with the same letter within the same row do not differ based on Tukey’s test at 5% significance.
1SS: sugarcane silage without additive; SU: sugarcane silage with 10 g/kg urea; SUC: sugarcane silage with 5 g/kg urea + 5 g/kg CaO; and SC: sugarcane silage with 10 g/kg CaO. SEM: standard error of the mean.
2DM: dry matter.
3CP: crude protein.
4EE: ether extract.
5 NDFap: neutral detergent fiber corrected for ash and protein.
6NFCap: non-fibrous carbohydrates corrected for ash and proteins.
7TC: Total carbohydrates.
8OM: organic matter.
9TDN: total digestible nutrients.
Table 4 Nitrogen balance, efficiency of nitrogen utilization, concentrations and excretion of nitrogen in milk and urine, synthesis of microbial N, microbial efficiency, and feed efficiency in lactating crossbred cows fed diets containing sugarcane silage with urea and calcium oxide.
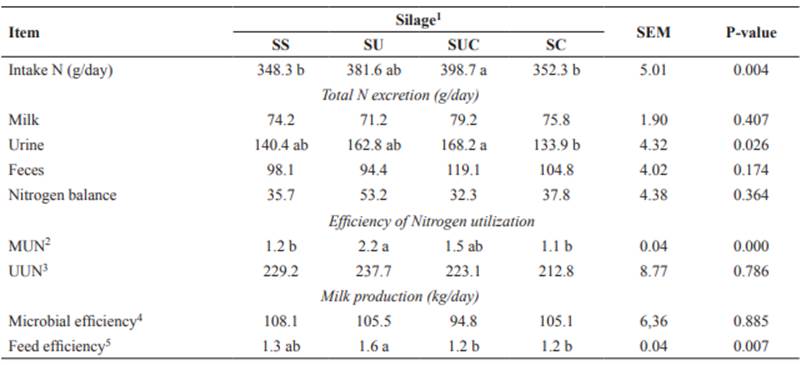
Means with the same letter within the same row do not differ based on Tukey’s test at 5% significance.
1SS: sugarcane silage without additive; SU: sugarcane silage with 10 g/kg urea; SUC: sugarcane silage with 5 g/kg urea + 5 g/kg CaO; and SC: sugarcane silage with 10 g/kg CaO. SEM standard error of the mean.
2milk urea nitrogen.
3allantoin and urea nitrogen.
4g CP/ kg TDN. 5kg milk/kg DM.
Higher MUN excretion (p<0.05) was observed in cows fed the SU diet than animals fed SC and SS diets (Table 4). There was no effect (p>0.05) of diet on fecal excretion of nitrogen, nitrogen balance, UUN, and microbial efficiency (g CP/kg TDN) (Table 4).
The highest feed efficiency (p<0.05) was observed in cows fed the SU diet, whereas the lowest averages were observed in animals fed SUC, and SC diets.
Discussion
The SU differed from the other diets, and it decreased DMI by approximately 26.0% compared to the other silages with CaO, which was related to high ammonia concentration in the silage. High ammonia concentration was also observed by Martins et al. (2015) when they studied qualitative parameters of sugarcane silages treated with urea and calcium oxide. Ammonia gives off a very strong smell, reducing food palatability and DMI. Ingestion was expected to be lower for cows fed diets containing SS mainly due to the loss of nutrients and soluble carbohydrates caused by alcoholic fermentation and high fiber content, which could limit intake due to rumen fill. However, DMI for the control diet was 18.2% higher than that obtained with the SU diet. This lower intake of the SU diet was possibly due to its lower palatability and TDN:CP ratio (4.1 SS vs. 2.8 SU), which may have compromised the efficiency of microbial protein synthesis and, consequently, DMI (Medeiros and Marino, 2015).
Although NDFap content decreased with the inclusion of additives (urea and calcium oxide), their digestibility did not improve (Table 3). Higher digestibility values for fibrous components in the diets added with CaO were expected compared with sugarcane silages without additives. Similar result was reported by Jacovaci et al. (2017) who assessed the nutritive value of sugarcane silage treated with calcium oxide, and by Roth et al. (2018), who evaluated the effect of calcium oxide on the nutritional characteristics of sugarcane silage. However, NDFap intake was low (Table 2), confirming that intake was not limited by rumen fill. Thus, the CaO in sugarcane silage acted on fiber solubilization and improved the nutritional quality of silage.
The N intake results were consistent with values reported by Carvalho et al. (2011), who evaluated sugarcane treated with calcium oxide in diets of dairy heifers and observed a reduction in N intake (g/day) related to modification of fermentation patterns caused by CaO usage. The average N balance found in our study was 39.72 g/day and did not differ among diets. These results are consistent with those reported by Carvalho et al. (2011), who evaluated four CaO doses (0, 0.75, 1.5, and 2.25) in diets containing sugarcane for dairy heifers and found a N balance of 61.20, 45.40, 21.20, and 16.10 g/day, respectively. In the present study, total N excretion in urine was higher for the diet with SUC and lower for the diet with SC.
Although this diet did not promote a higher intake of nitrogen, a lack of synchronization was observed between the use of dietary protein and energy, which may have caused significant MUN excretion. The UUN excretion did not differ among diets. According to Van Soest (1994), increases in nitrogen intake are associated with high urea production in the liver and high urea excretion in urine. Average microbial nitrogen was 125.67 g/day, which was lower than that reported by Mendonça et al. (2004) at 193 g/day for cows consuming diets based on sugarcane or corn silage. This result was also lower than the 278 to 419 g/ day range observed by Valadares et al. (1999) in high-producing cows. Sousa et al. (2009) found a mean value of 198.87 g/day of microbial N, which was similar to that obtained by Mendonça et al. (2004). In this study, the average microbial efficiency value was 103.37 g CP mic/kg TDN, which was lower than the NRC (2001) level of 130 g CP mic/kg TDN.
Among the evaluated diets, those with sugarcane silage treated with CaO at a concentration of 10 g/kg CaO or with a combination of 5 g/kg urea + 5 g/kg CaO based on fresh material are recommended. Diets containing sugarcane silage with 10 g/kg urea represent less efficient nitrogen metabolism due to high excretion of UUN and MUN, and reduced DMI.

