


 English (pdf)
 Article in xml format
 Article references
 Send this article by e-mail
 Cited by SciELO
  Cited by Google
  Similars in
SciELO
Similars in
SciELO  Similars in Google
 Permalink
Introduction
The decline of fossil resources and increased fuel consumption have promoted the search for alternatives to meet energy demands (FAO, 2008), through renewable biomass energy to produce biofuels (Ho et al., 2014). Jatropha curcas (Euphorbiaceae) is a plant with high rusticity and easy adaptation to various agroclimatic conditions, growing in marginal areas with low soils fertility, which extends the prospects for its cultivation in the semiarid regions of the world (Sato et al., 2007). The seeds contain between 27 and 42% of non-eatable oil whicht can be transformed into biodiesel (Sato et al., 2007; Adebayo et al., 2017). The seeds of J. curcas also could be used to feed animals as a supplement of proteins of high nutritional value (Makkar, 2016). In spite of the numerous benefits presented by the cultivation of J. curcas, its production has not been optimized, since factors such as fertilization, planting distances, pruning and pest and disease management have been the main aspects for establishment of its commercial cultivation (Silva et al., 2009; Ghosh et al., 2011). Information of the fertilizer doses and sources, both organic and inorganic, is still very limited (Fagam et al., 2012; Farouk et al., 2014). However, it is reported that the growth and yield of J. curcas plants are considerably influenced by the application of fertilizers, but a balance must be established between the increase in yields and the optimum level of N:P:K fertilizers, to use this species as a large-scale commercial crop (Mohapatra and Panda, 2011). Macro and micronutrient deficiencies in J. curcas plants can limit the plant development and dry mass production (Silva et al., 2009). When analyzing the relationships between the macronutrients absorbed by J. curcas,Laviola and dos Santos-Dias (2008) found the N:K ratios of 2.3:1 in leaves and of 1.4:1 in fruits indicating that remobilization of K from the leaves and stems to the fruits is higher than that of N. Likewise, the growth characters, such as plant height, leaf number, leaf area, and growth rates were significantly affected by the fertilizer types and doses and plant density (Kalannavar et al., 2009; Owolabi et al., 2016).
Studies about growth of J. curcas under edaphoclimatic conditions of Colombia are scarce and few published results are available on how the crop cultivation is affected by the agronomic practices. The effects of environment on the growth and development of J. curcas Brazil variety in two localities in Colombia were studied by Pedraza and Cayón (2010), who did not find significant differences for leaf area (LA) and leaf dry weight (LDW) among the cultivation zones, but rather between the leaf strata within the plants since the middle and lower strata developed greater LA and LDW. These results suggest that the plants can modify morphological characteristics increasing the LA to capture more light (Larcher, 2003). It has also been reported that the absence of N severely decreases the biomass production, plant growth, and leaf formation (Garrone et al., 2016).
Plant growth is defined as irreversible increase in size and dry weight through development, with gradual and progressive changes in structures and their functions (Taiz et al., 2014) and can be studied using mathematical models that allow synthesizing and improving knowledge about a productive system (López-Cruz et al., 2005). This approach allows evaluating possible strategies for agronomic management and estimating potential yield with the use of certain practices, especially application of fertilizers (Cañizares et al., 2003).
In Colombia, up to date few research studies were undertaken on the growth and production of Jatropha so it is necessary to obtain more information about the growth of J. curcas in field conditions under agronomic practices, such as fertilizer treatments, in order to reach high levels of productivity. The objective of the present study was to evaluate the effect of the application of different doses of N and K on the growth and accumulation of dry mass of J. curcas in agroclimatic conditions of the tropical dry forest of Valle Cálido del alto Magdalena, Tolima department.
Materials and methods
Plant material
Seeds of J. curcas, elite genotype M-3 obtained from the genetic improvement program (Corpoica) were planted in black plastic bags with a capacity of 4 kg using a 2:1:1 mixture (v/v/v) of sandy loam soil, 60% burnt rice husk and a compost as a substrate (pH 5.5, 4.1% organic matter, 67.7 mg kg-1 P, 0.55 cmol kg-1 K) under 60% plastic mesh in the nursery of Experimental Center Nataima (Corpoica), Tolima province. During the nursery stage, the irrigation was applied by spraying water twice a week up to the field water capacity. Eight days after germination the mesh was removed and the seedlings were left to free solar exposure. When the plants reached between 5 and 6 true leaves and an average of 35 cm height at 45 d after sowing (das), these were transplanted into the field and evaluated during 435 das.
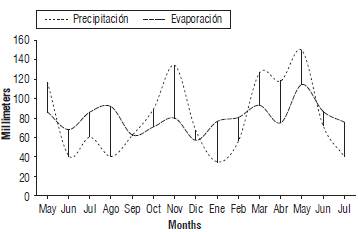
Climatic conditions during the evaluation period
The plant establishment in field was carried out during the rainy season from May 2012 to July 2013 characterized by an average air temperature of 27.8°C and relative air humidity between 70 and 85%. The mean precipitation was 64.7 mm/month and the evaporation was 85.4 mm/month (Fig. 1). The crop development was not affected by water availability since the supplemental irrigation was applied.
Plant establishment and fertilizer application
The planting distance in field was 3 m between the rows and 2 m between the plants. Twenty-four plants were used for each treatment, separated by a border row, for a total of 1,184 plants. The crop was established in a sandy loam soil described as an Inceptisol of ustic moisture regimen (Tab. 1), without presence of exchangeable aluminum, with low sodium levels, electrical conductivity lower than 1.0 dS m-2 s-1, good drainage, and classified as Typic Haplusterts (IGAC, 2004).
TABLE 1 Chemical characteristics of Ap horizon of soil, where the plants of J. curcas were established.
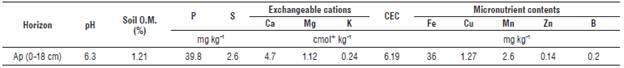
Chemical analysis of soil was done according to methodology of IGAC (2006).
The sources of fertilizers were urea for nitrogen and potassium chloride for potassium. Macronutrients P, Ca, Mg, S and micronutrients deficient in soil (Mn, Zn, and B) were applied to the soil before transplanting in equal doses for all treatments of 46.0 kg ha-1 P2O5; 44.0 kg ha-1 Ca; 18.8 kg ha-1 Mg; 27.2 kg ha-1 S; 3.2 kg ha-1 Mn; 2.4 kg ha-1 Zn, and 1.0 kg ha-1 B. These were calculated considering the results of soil analysis and the estimated values of plant extraction for these elements (ICA, 1992; Montenegro et al., 2014).
Twelve fertilization treatments consisted of combinations of doses (kg ha-1) of nitrogen (N) and potassium (K2O) were arranged in incomplete factorial design: N0:K0, N0:K120, N50:K60, N50:K120, N150:K180, N100:K0, N100:K60, N100:K120, N100:K180, N150:K60, N150:K120, and N150:K180. The plants were fertilized every three months starting one month after transplanting. The fertilizers were applied uniformly in crown shape around each plant and covered with a soil layer of approximately 1 cm. The control of weeds during the first 180 das was done manually around the plants following a plateau patron and complemented with manual labor and tractor operated light dredge between the rows. No pest control was performed during the development of the experiment.
Variables evaluated
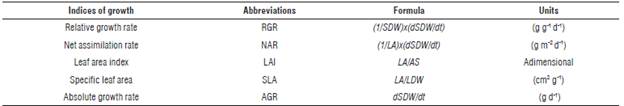
Five destructive samplings of plants were taken 1.5 months after each fertilization event which corresponded to 75, 165, 255, 345, and 435 das. The aerial part of the plants was separated into organs (stems, leaves, flowers, and fruits) and the fresh weight of each organ was obtained, and then dried in the oven (Memmert® DIN-IP20, Schwabach, Germany) for 72 h at 70°C until a constant dry weight. For determination of specific leaf area, 30 leaves of each sampled plant were taken (10 of each of the three foliar strata of the plant) and leaf area photographs were taken with a digital camera (Canon® Eos Rebel Xsi, 494x452 pixels, Tokyo, Japan) that were processed with ImageJ® 1.45k software in order to calculate leaf area; after leaves were dried in the oven separately from the rest of the plant. The stems, after being weighed in fresh, were chopped and grinded in a mill (IKA®-Werke M-20, Staufen, Germany) and the dry weight of stems was determined. Leaf area index (LAI) was obtained using a quantum bar (AccuPAR LP-80, Decagon Devices Quantum Bar, Pullman, WA, USA). These measurements were performed on 4 plants of each treatment, between 11:00 am and 1:00 pm, to minimize the effect of shadow projection of the plant canopy. Based on the measurements performed, the indices listed in Table 2 were calculated according to Hunt et al. (2002) and Gardner et al. (2003).
Statistical analysis
The statistical analysis was focused on the adjustment of curves for each index. For AGR, NAR, and RGR, each response used the evaluation time (75, 165, 255, 345, and 435 das) as an explanatory variable. The combinations of N levels (0, 50, 100, and 150 kg ha-1) and of potassium nested in N K(N) (0, 60, 120, and 180 kg ha-1) formed the factors among the subjects. The potassium factor was nested with nitrogen factor because different levels of potassium factor were combined with a single level of nitrogen factor and the number of potassium levels nested at each nitrogen level was not the same. The obtained indices were vectorial ones, so that was the vector of absolute growth rate, which had 60 elements (12*5), corresponding to the 12 treatments and 5 evaluation moments. The vector of net assimilation rate had 240 elements (12*5*4), since it incorporated the measurements of each of the replicate (m = 1, 2, 3, 4). The index also had 60 index elements corresponding to the 12 treatments and 5 evaluation moments. The extent of adjustment of each index was based on the adjusted coefficient of determination and the method of obtaining the indices was based on the least-squares estimation (Lancaster and Salkauskas, 1986). For the indexes LAI and SLA were obtained directly, the respective profiles were made by dose of N and of K nested in the different doses of N at the different moments of evaluation. The choices of the best level for N or K nested with N were selected under the criterion of the standard error bars (Cumming et al., 2007).
Results and discussion
The LAI represents the projection of leaf area on the soil plane. The leaves in some perennial crops of tropical and subtropical climate can reach 100% of the ground cover; however, this is not related to a maximum efficiency in the interception of radiation because of increased foliage overlap (Gardner et al., 2003). J. curcas increased LAI over the time after sowing, reaching the highest LAI values at the end of the evaluated period (435 das). Regarding the treatments with N, the treatment of 150 kg ha-1 presented the LAI of 2.83 and the control without fertilization had LAI of 1.425 (Fig. 2A). With the highest dose of N (150 kg ha-1) the maximum LAI was obtained at all moments of evaluation. In treatments with N, the standard error bars indicated that there was no statistical difference between the doses of 50 kg ha-1, 100 kg ha-1 and 150 kg ha-1; however, these treatments statistically differed from the control. These results are consistent with Albéniz (2011), who reported LAI mean values ranging between 1.674 and 3.596 in J. curcas for two localities in Mozambique; these values were higher in fertile soils, probably due to greater availability of nutrients, increasing leaf area and dry mass production and allowing greater coverage of soil and a high leaf area index.
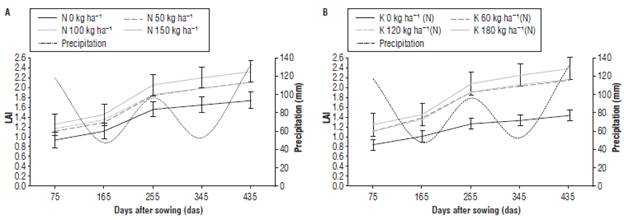
FIGURE 2 Leaf area index (LAI) of J. curcas subjected to different levels of N (A) and of K nested in N, K(N=150); (B). Error bars indicate standard error.
The analysis of the nested effects of K(N=150) indicated a small increase in LAI for the control treatment reaching 1.645 but being much lower than the value of 2.320 obtained with the highest dose of K2O (80 kg ha-1) in combination with the different levels of N (Fig. 2B). According to the bars of the standard error, the potassium doses (60, 120, and 180 kg ha-1) nested in the average dose of N resulted in statistically same LAI, although the highest dose of K (180 kg ha-1) produced the highest average LAI at all moments of evaluation; these treatments differed in LAI only with the control. The LAI presented a higher rate of increase (greater slope) between 165 and 255 das, at the end of the vegetative stage that lasted for 5 months and ended with the emission of floral primordia, thus, at the beginning of the reproductive phase. The end of the vegetative phase corresponded to an active period of crop development, where the plants increased leaf area to produce more photosynthates, expanding the crown and presenting more growth. This period of higher leaf formation coincided with the rainy season (Fig. 2), which, possibly, facilitated the availability of mineral nutrients to the plants. It is possible that, in this period, the plants of J. curcas reached an adequate C/N equilibrium to enter the reproductive phase (Hernández et al., 1995).
The NAR indicates the amount of total biomass accumulated as a function of leaf area in a given time (Gardner et al., 2003). In this regard, Pearcy et al. (1989) argued that NAR is a measure of the efficiency of leaves to produce new growth. J. curcas presented a downward trend from 75 to 345 das (Fig. 3A), the lowest values were observed at 345 das coinciding with the dry period (January-March, 2013). At the end of the evaluation period, in the months of highest precipitation (April-June, 2013) up to 435 das the NAR presented a slight increment.
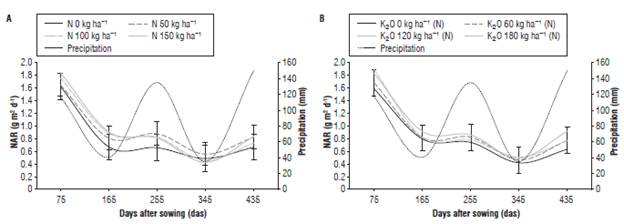
FIGURE 3 Net assimilation rate (NAR) of J. curcas submitted to different levels of N (A) and of K nested in N, K(N=150); (B). Error bars indicate standard error.
The decrease in NAR observed in J. curcas can be attributed to the senescence of leaves and increase in leaf area that generated the high LAI, so that the upper leaves caused self-shading reducing the incident radiation on the leaves of the medium and lower strata; this, probably, decreased the canopy capacity to maintain a positive carbon balance, an effect that has been reported in other species (Scott and Batchelor, 1979; Escalante-Estrada, 1999). The NAR did not present statistical differences between the levels of N and between the levels of K nested in N according to the bars of the standard error. The highest NAR value of 1.852 g m-2d-1 was obtained 75 das in the treatment with 150 kg ha-1 N and the lowest one of 1.633 g m-2d-1 was recorded in the control treatment (Fig. 3A). Similar results were reported by Laviola and dos Santos-Dias (2008), who additionally found that N had the highest concentration among the primary macronutrients in the leaves of J. curcas. The NAR was influenced by the distribution of precipitation presenting a small increase with the increase of rainfall and low values in periods of low precipitation (Fig. 3).
The coefficient of variation for each dose of N and for K nested in N at each evaluation moment presented values higher than 30% indicating a greater relative dispersion of this index and making the mean less representative for the treatment. The calculations of median and its associated standard error indicated that the control plants had the lowest NAR in comparison to the treatments with N and K applications, based on the standard error bars of the median.
The AGR represents the efficiency in the production of plant dry mass per unit of time (Hunt, 2003). The highest AGR during the crop development was obtained for the treatment with 150 kg ha-1 of N, reaching 24.5 g d-1 at 435 das, while the lowest AGR presented the control treatment, without N, with 9.9 g d-1 at 435 das (Fig. 4A). When analyzing the nested effect of K(N) on the growth, the AGR had the highest values with the application of 180 kg ha-1 of K2O as compared to 23.2 g d-1 average AGR for the treatments with different levels of N; the lowest AGR values were observed in the control treatment, without K, with 12.0 g d-1 (Fig. 4B). Starting from 345 das, the treatments without N and K differed within the treatments with N (50, 100, and 150) and K (60, 120 and 180), with no statistical differences found between the doses according to the criterion of error bars. The progressive increases in dry mass accumulation observed in J. curcas, for the treatments with the highest N and K doses were, probably, related to a high availability of nutrients and a greater efficiency in the absorption and accumulation of nutrients for formation of new tissues, the latter is in accordance with findings of Del Valle and Lema (1999).
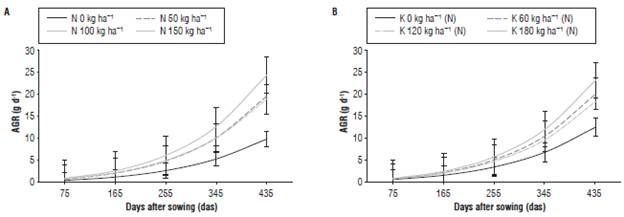
FIGURE 4 Absolute growth rate (AGR) of J. curcas subjected to different levels of N (A) and of K nested in N, K(N) (B) Error bars indicate standard error.
The RGR represents the efficiency of the plant to produce new tissues from the existing ones (Hunt, 2003). This index did not present statistical differences for the simple effects of N nor for the nested K(N) effect. All fertilization treatments with N showed the highest values of RGR (28.0 mg g-1day-1) during the period of plant establishment in field up to 75 das (Fig. 5A). This indicates that, at the initial phase corresponding to the vegetative stage of development up to 165 das, the young plants of J. curcas had active cell division forming a large amount of new tissues, so that there was greater accumulation of dry mass. Both the simple effect of N and nested K(N) showed a very similar behavior in the RGR throughout the evaluation period, with values ranging between 19.2 mg g-1d-1 and 24.1 mg g-1d-1 at 75 das that gradually declined to zero about 435 das. One of the factors that, probably, contributed to the decrease of RGR was leaf abscission, since as the trees increased in size, leaf abscission also increased, thus, reducing the RGR; a similar behavior was reported by Del Valle and Lema (1999). According to Villar et al. (2014), the decrease in RGR could also be associated with defoliation caused by drought; however, this factor was not relevant in the present research, since a supplemental irrigation was applied.
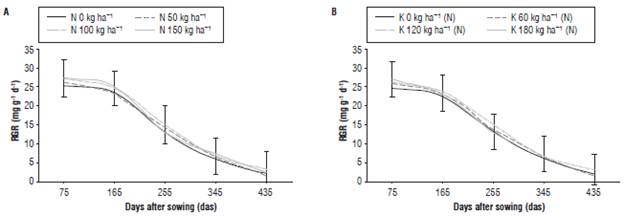
FIGURE 5 Relative growth rate (RGR) of J. curcas subjected to different levels of fertilization with N (A), and of K nested in N, K(N) (B). Error bars indicate standard error.
The SLA is an indicator of leaf thickness and defined as the ratio between leaf area and leaf dry weight (Hunt, 2003). Although it is a physiological index affected by external environmental factors (Pearcy, 1989), there were no differences in response to the application of N, based on the criterion of the standard error bars (Fig. 6A).
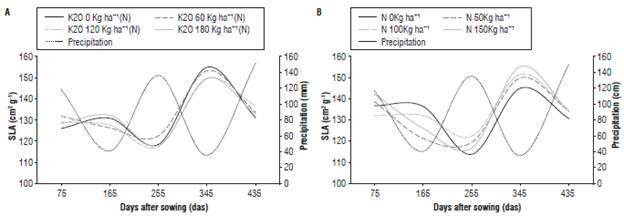
FIGURE 6 Specific leaf area (SLA) of J. curcas submitted to different levels of fertilization with N (A) and of K nested in N, K(N) (B). Error bars indicate standard error.
The lowest SLA values were obtained for the control treatment, without nitrogen, in the last three evaluation moments compared to the plants fertilized with 150 kg ha-1 of N at the same moments; this, probably, was due to a higher photosynthetic activity of the plants caused by a higher content of N as has been reported by Yong et al. (2010). The nested effect of K(N) was similar at different evaluation times (Fig. 6B). However, SLA increased at 345 das because the leaf area was maintained but the leaf dry weight increased, probably, due to increasing leaf thickness that coincided with the period of low precipitation presenting values among 143 cm2 g-1 and 154 cm2 g-1, which were slightly lower (18% less) than the 170 cm2 g-1 value reported by Maes et al. (2009). The SLA presented an inversely proportional behavior to the precipitation rates, since the highest SLA values coincided with the dry periods with low precipitation (Figs. 6A and B), which indicates the influence of precipitation on the behavior of the SLA.
The diagrams of lines presented for the different indices were obtained with the data observed in field and, since the lines had homogenized behaviors, it was possible to adjust the curves for the indices, which are a function of time by definition. Thus, using the least squares estimation, the adjusted models were obtained by the treatment for AGR, NAR, and RGR indices. In addition, the values of determination coefficient R2 were acquired as the criterion of the adjustment found. Table 3 presents the estimated coefficients of each model for NAR and RGR, with R 2 adjustments above 97.09%.
TABLE 3 Coefficients for the intercept, slope and R 2 of the regression equations for each fertilization treatment with N and K2O for the growth indices NAR and RGR
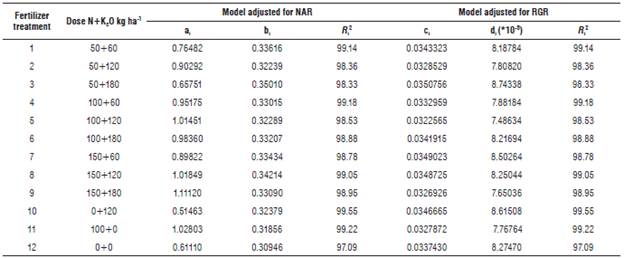
According to each of these models, a set of subscripts was incorporated in each index (j = 1, 2, 5) associated with each treatment (i = 1, 2, 12), every moment of evaluation and each repetition, in the case of NAR (m = 1, 2, 3, 4).
The prediction model for AGR was used to obtain NAR equation, since this index is different from AGR due to incorporation of leaf area value into the formula. In the case of RGR, the adjustment was made for the dry weight of leaves in each evaluation moment (das) and by treatment, associated to the doses of N and K2O. The coefficients associated with AGR were the same ones as those of NAR; the difference was in the measures of the rates, since AGR is directly proportional to NAR and inversely proportional to the leaf area.
The equation (1) presents the expression of the adjusted AGR:
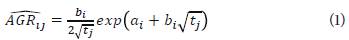
This generic expression for each treatment reaches its minimum value in t ij = 1/b 2 i , such as, in the last evaluation moment (j=435), the fertilizer treatment 9 (Table 3) (i=9) is N150:K180. In this case, α9 = 1.11120, b9 = 0.33090 and t 5 = 435, thus, obtaining:

The minimum value of AGR 9i5 is obtnined from t9;435 = 1/0.33 0 902 =9.13 das.
Similarly, for NAR and RGR, the foilowing equation s (2) and (3) could be obtained:


Each of these models allows estimating the respective grow the index for each treatment and evaluation moment; in addition, these models can be used within the range of operation in time, between 75 and 435 das for the same treatments. Unlike the common modeling proposals that approximate these values by ranges, in our case we can find the instant indexes at any time and for each of the treatment used.
Conclusions
The growth of J. curcas was influenced by fertilization with N and the effect of K nested in N, K(N). The plants presented a rapid initial growth, with the highest values of RGR in the vegetative phase, a period that comprised from the planting up to 165 das. The NAR decreased with the age of the plants and was influenced by precipitation rates, so that the lower values of this index occurred in the periods of higher precipitation. In the reproductive phase, between 345 and 435 das, the plants of J. curcas significantly increased their dry mass accumulation and, therefore, increased AGR. The SLA was not influenced by fertilization treatments throughout the evaluation period. From the analysis of functions and with the application of equations obtained for the growth indices, it was obtained that the RGR was null at 402 and 405 das for the plants that were not fertilized and the plants that only received potassium at doses of 120 kg ha-1.

