1. INTRODUCTION
Thermal Enhanced Oil Recovery (tEOR) methods are still considered a valuable proposition to increase the oil recovery factor of vast heavy oil (HO) and extra heavy oil (XHO) reserves worldwide. . Steam injection methods (Cyclic Steam Stimulation, Steamflooding, and Steam Assisted Gravity Drainage) represents by far the most common tEOR method [1]-[2]. However, oil market volatility often imposes great challenges in developing these resources economically. Additionally, the recent environmental agreements, regulations, and global strategies to reduce carbon footprint may limit the development and production of HO and XHO resources in years to come.
The situation is no different in Colombia that holds large amounts of heavy oil reserves which currently are mainly developed through Cyclic Steam Stimulation (CSS), and also significant reserves of HO are under cold production or still undeveloped. This represents a significant opportunity to evaluate, improve, and implement conventional and/or novel technologies considering different strategies to increase oil production through economically viable projects and improving energy and environmental efficiency at the same time.
It is well known that reservoir development plans of HO reservoirs are generally based on steam injection processes starting with CSS, and decreasing well spacing until the oil recoveries per cycle no longer justify to continue with CSS. At this stage, most projects evolve to continuous steam injection or Steamflooding (SF). However, in some instances converting CSS to SF can't be implemented due to project economics, lack of reservoir continuity, water, and/or natural gas availability, among other technical and non-technical variables. Therefore, the optimization of wells under advanced stages of CSS (i.e. > 10 steam cycles of approximately one year each) represents a critical need to sustain oil production targets and also to extend the technical-economic limit of this recovery process [3]-[4]. On the other hand, undeveloped HO reservoirs or those under cold production will also require alternate development strategies considering existing economic and environmental constraints such as fuel consumption and greenhouse gas (GHG) emissions.
To assess the challenges to develop new and mature HO resources in Colombia, a comprehensive R&D program was sanctioned by Ecopetrol in early 2018, forming strategic alliances with national and international universities and organizations.
The R&D program was established to evaluate heat management strategies, different energy sources to support heat generation, hybrid CSS methods, and develop new protocols. One of the main goals was to create a methodology to guide management decision making to identify optimum development strategies to increase HO recovery in a cost-effective manner improving the energy and environmental efficiency as well. Therefore, this study aims to summarize the results of the first two years of the R&D program carried out by Ecopetrol. This paper will be divide into two main sections:
Integration of downhole heating technologies as part of development plans of HO wells or DPHOW (methodology and simulation results).
Recent advances in Ecopetrol on the development of hybrid CSS methods at laboratory and field scales and updates of ongoing studies.
It is important to remark that all the recovery strategies discussed in this paper are guided by basic benefit-cost (B/C) ratios and energy and environmental efficiency indicators. These criteria were combined to assist in in selecting technologies that can contribute to increasing oil recoveries and reserves in Colombia.
2. METHODOLOGY TO DESIGN DEVELOPMENT PLANS FOR HEAVY OIL WELLS
The approach followed to evaluate hybrid CSS methods has been described in the literature [3]-[5]. Fundamentally, the study was performed using a radial numerical model built based on a representative HO reservoir in the VMM, using a commercial thermal simulator. The hybrid CSS methods evaluated were compared with a baseline. This baseline of CSS consisted of 3 months of cold production and 11 steam cycles over 10 years. All steam cycles injected a total of 8,100 bbls of cold water equivalent (1,350 bbl/d for 6 days) and a soaking period of 3 days. Steam quality and injection temperature of each steam cycle were 60% and 520°F, respectively (Base case). For each cycle, the well was kept producing until the oil rate reached the baseline of cold production [3]-[5].
The integration of downhole heating technologies as part of the development plan of HO wells (DPHOW) was assessed using the same model. However, the CSS evaluation time was increased to 20 years to be able to compare the DPHOW results in later stages. Although different heating methods were considered, only electrical heating and steam circulation were evaluated in this study.
Nevertheless, preliminary performance predictions of different downhole heating methods (i.e. catalytic heating, a combination of electro-kinetics and electrochemical methods) can be simulated as total energy injected in BTUs, regardless of the principle of each of the technologies evaluated. It is foremost to mention that different energy sources (i.e. wind power, solar energy, and power grid) to operate the heaters were evaluated. However, for the steam circulation strategy, for simplicity natural gas was the only case studied.
As stated above, the different approaches of downhole heating technologies studied were modeled in terms of total energy injected. Hence, these technologies were evaluated, considering three different input energy rates (5, 10, and 20 MM BTU/D). For conventional CSS, injection rates and total volumes of the base case were considered.
In addition, the hybrid technologies (CSS with flue gas, nitrogen, or solvents) were evaluated using the variables summarized in Tables 1 and 2. It is important to mention that the total equivalent volume of water injected was kept constant for all the cases.
Table 1 CSS + Gas simulation schemes.
| Case | Scheme | Gas Volume of N2 (scf) | Gas Volume of flue gas (scf) |
| 1 | Co-injection | 3,000,000 | 1,757,609 |
| 2 | Gas + CSS | ||
| 3 | CSS + Gas | ||
| 4 | Co-injection | 6,102,372 | 3,515,217 |
| 5 | Gas + CSS | ||
| 6 | CSS + Gas | ||
| 7 | Co-injection | 12,000,000 | 7,030,434 |
| 8 | Gas + CSS | ||
| 9 | CSS + Gas |
Table 2 CSS + Solvents simulation schemes.
| Case | Scheme Case (Co-injection) | Mass Ratio solvent mixture/steam injected | Mixture proportion | Volume Fraction Propane | Volume Fraction Butane | Injection Rate (scf/d) |
| 1-2 | steam + solvent + steam | 0.05 | 1:1 | 0.50 | 0.50 | 173,326 |
| 3-4 | 1:2 | 0.33 | 0.67 | 165,658 | ||
| 5-6 | 1:5 | 0.17 | 0.83 | 158,639 | ||
| 7-8 | 0.1 | 1:1 | 0.50 | 0.50 | 346,653 | |
| 9-10 | 1:2 | 0.33 | 0.67 | 331,315 | ||
| 11-12 | 1:5 | 0.17 | 0.83 | 317,277 | ||
| 13-14 | 0.2 | 1:1 | 0.50 | 0.50 | 693,305 | |
| 15-16 | 1:2 | 0.33 | 0.67 | 662,630 | ||
| 17-18 | 1:5 | 0.17 | 0.83 | 634,555 |
Each technology was evaluated using all schemes showed in Tables 1 and 2, for a total of 43 scenarios per period, starting at initial reservoir conditions after three months of primary production. The evaluation was carried out by periods whose duration was among 1-3 years depending on the technology (16 periods in total). The initial periods (1,2 and 3) were longer due to the higher productivity and reservoir energy in the early stages of production. This approach was useful for making a reasonable estimation of the energy indexes based on the production response according to the input energy
The main objective of DPHOW was to identify the best combination of technologies to develop new wells or wells at early/late stages of production (i.e. downhole heating → CSS → CSS + Gas; downhole heating → CSS. → CSS + Solvent, etc.). For this particular study, CSS with foams was not included as part of the DPHOW. Nevertheless, CCS + Foam has been evaluated following the methodology for a mature CSS, being the selected technology for a field pilot test. It will be described later in this paper.
The proposed methodology to identify the proper selection of DPHOW was focused on incremental oil recoveries and economics, and energy and environmental indexes. Fundamentally, an energy cost index (ECI) was defined to identify the optimum DPHOW scenario. The ECI is represented as the ratio of a benefit/cost (B/C) ratio and an energy efficiency index (EE) which is an energy balance of each of the technologies evaluated [5]:
Details on how these ratios are calculated and reference data to perform these calculations have been previously documented [5].
The results of oil and water production obtained by numerical simulation were used to calculate the EE and ECI. The highest ECI was defined as criteria for the selection/implementation of a specific technology in a given period. The methodology was repeated period by period for a total of 16 cycles of variable periods (>1 year) corresponding to a total of 20 years of production. Figure 1 shows an example of the technologies evaluated (43 scenarios) during the first period and where all the calculated ECl's are compared. This procedure was performed for each of the 16 assessed periods to identify the most promising DPHOW. The case column to the left of each injection or technology scheme in Tables 1 and 2 represent and summarize each of the cases run.
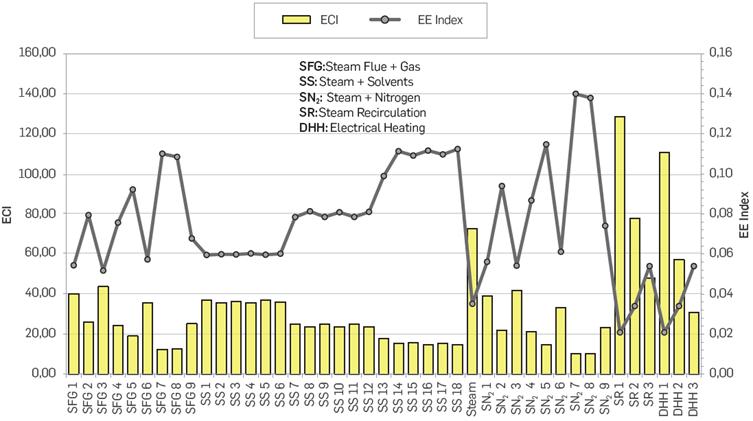
Figure 1 Example of EE and ECI indexes calculated for each of the technologies or schemes evaluated during the first period of production.
To further expand the methodology to identify optimal DPHOW scenarios, all the technologies evaluated were compared considering the balance of emissions during the injection and production cycle. Additionally, after completing the numerical simulation studies, different power generation alternatives were evaluated to identify economically viable energy sources that could potentially leads to the least amount of CO2 emissions. It is worth mentioning that the environmental index (El) is still a concept under development. The approach presented in this study is to estimate the El for the entire production history of the well (20 years). This approach was considered reasonable to offset the higher capital costs of renewable energy sources which increases their profitability over time. The El was defined using the following equation:
In this equation, the carbon dioxide (CO2) is expressed as a mass unit (kg in this case). The variable "CO 2 Emitted by the Source" includes the combination of the emissions of each technology implemented during the DPHOW and the emissions generated by the energy source used to run its operation (i.e. solar energy, natural gas, power grid, etc.). The term "CO 2 Emitted of Oil Recovered" only includes the emissions due to the oil produced (CO2 equivalent), considering the low amount of solution gas of the reservoir under evaluation. The mass of CO2 emissions calculated for different energy or fuel sources is based on conversion factors listed at the end of this paper. For the cases of wind and solar power, CO2 emissions were calculated according to the deforestation of the area in which they will be implemented using the following approach [6]:
Where C is the carbon stored in tones (1,000 kg) per hectare (t/ ha) corresponding to a coverage type (T coverage ) that in this case was defined as a tropical moist forest, and #ha represents the number of hectares used to install the technology.
When integrating the EI (Equation 2) with respect to the cost of implementation of each energy source, including the time of evaluation, a new Cost Carbon Emission Index (CCEI) was defined to Identify the best energy source to be considered during the DPHOW. The CCEI is expressed as follow:
The (B/C) SE represents the benefit-cost ratio of the energy source being evaluated. As described earlier in this section, the evaluation of wind and solar energy was performed for the entire simulation history of the well (20 years). In that sense, this modified benefit-cost ratio takes into account the corresponding cash flow and is represented with the following equation:
The use of ECI and CCEI indexes can guide the decision-making to screen technologies and identify DPHOW energy sources that can support the implementation of downhole heating and hybrid CSS methods. Therefore, the proposed indexes can assist in increasing oil recovery profitably with an efficient and environmentally sustainable energy balance.
3. DPHOW: SUMMARY RESULTS
Before presenting the most optimum scenario of the development plan of heavy oil wells (DPHOW) based on the numerical simulation conditions established, it is important to briefly describe the steps followed. First, all the possible scenarios were compared for the first three years of production to obtain a preliminary ranking of the recovery methods in terms of cumulative oil recovery, EE, and ECI indexes. Simulation results clearly show that downhole heating technologies, including steam circulation, outperformed the CSS and hybrid steam methods. In all cases, EE indexes were lower than 0.05. These low EE indexes are consistent with the high oil production rates at the early stages (first few years) of production. In other words, in the early stages of production, low energy is required to produce high volumes of oil, leading to high energy and economic efficiencies. However, the effectiveness of all methods evaluated decreases with time [5].
Once the most promising methods at the early stages of production were identified, different schemes were tested over the production history of the well. Based on the simulation studies and considering the proposed methodology, it was possible to divide the production history into three major stages: Initial (first seven years), Middle (from years 8th to 11th), and Late (from years 12th to 20th). Table 3 summarizes the average ECI, EE index, NPVDR, and incremental production for all cases run at different production stages. Results show that during the first seven years of operation (Initial stage), downhole heating (at an energy input rate of 5 MMBTU/D) represents the best scenario for the early stages of production.
It is important to remark that the net oil produced (Np) reported for downhole heating, and steam circulation is the same because both technologies were simulated using the same approach (a "heater well" with a constant input energy rate). However, ECI, EE index, and Net Present Value (NPV) differ due to its differences in costs and energy supply. This is represented by the seven-year NPV calculation for each of the technologies evaluated during the same period.
The mass of the CO2 emitted for the technologies studied was calculated during the different production periods and presented in previous work [5]. Nevertheless, the environmental index is addressed later during the discussion of the optimal DPHOW Identified with the proposed methodology.
Figure 2 summarizes the results obtained for the initial production stage. From these results, the use of steam circulation as a downhole heating technique was selected as the technology to produce the well for the first seven years. In scenarios where natural gas is not available for steam generation, the use of electric heating can be considered as a viable option to develop this production strategy.
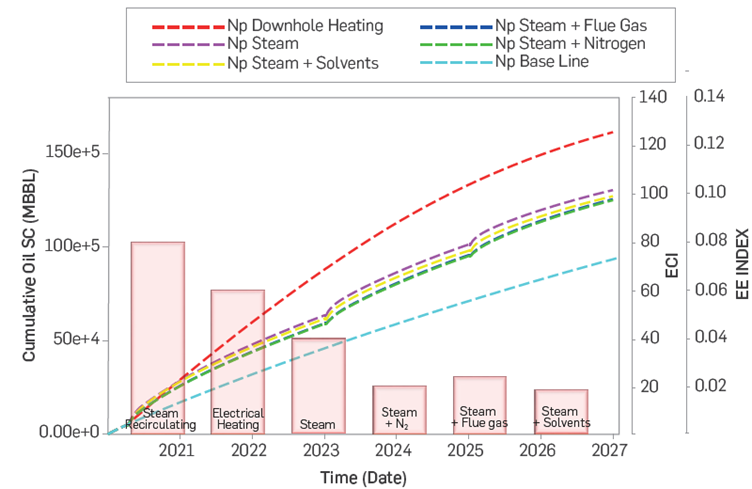
Figure 2 Summary results of Np, EE index, and ECI during the initial stage (1st seven years) of production.
A similar procedure was followed for the middle and late stages of production, evaluating all technologies except the use of downhole heating because its production falls below the baseline. It can be noticed that, despite the lower cumulative oil production, the conventional cyclic steam stimulation (CSS) represents the most attractive technology for the middle stage of production (Table 3) Fundamentally, the reason for selecting the conventional CSS for this production period is due to the higher costs of implementing hybrid CSS methods, especially CSS with solvents, which have a high solvent cost and whose facilities have a high level of energy consumption. At this stage of the study, the potential economic benefits related to the recovery of the injected solvent were not considered in project economics. However, solvent recovery can also be an energy-intensive process on its own, which requires additional analysis that is out of the scope of this study.
Table 3 CSS + Solvents simulation schemes.
| Technology | ECI | EE Index | NPV10 (MUSD) | Incremental Prod. (bbls) |
| Initial stage (Years 1st to 7th) | ||||
| Steam Circulation | 82 | 0.04 | 1,077.6 | 67,962 |
| Downhole Heating | 63 | 0.04 | 834.8 | 67,962 |
| CSS | 39 | 0.05 | 593.5 | 37,284 |
| N2 + CSS | 23 | 0.07 | 456.7 | 31,586 |
| Flue Gas + CSS | 25 | 0.06 | 452.9 | 32,127 |
| Solvents + CSS | 19 | 0.10 | 468.1 | 33,975 |
| Middle stage (Years 8th to 11th) | ||||
| CSS | 7.46 | 0.30 | 114.7 | 8,338 |
| N2 + CSS | 4.26 | 0.26 | 104.3 | 10,932 |
| Flue Gas + CSS | 6.28 | 0.27 | 89.3 | 9,736 |
| Solvents + CSS | 3.31 | 0.38 | 53,177 | 10,887 |
| Late stage (Years 12th to 20th) | ||||
| CSS | 1.52 | 4.47 | 124,498 | 6,801 |
| N2 + CSS | 5.20 | 0.30 | 155,827 | 21,249 |
| Flue Gas + CSS | 4.96 | .024 | 101,671 | 29,142 |
| Solvents + CSS | 0.93 | 0.77 | -147,432 | 12,905 |
Following the same approach, during the last nine years (late-stage) of production, the technology CCS + N2 shows the best NPV10 (assuming equipment that captures air, cleaning and separating its components, generating high purity nitrogen). It also has similar ECI and EE index to CCS + Flue Gas that have higher cum oil recoveries but also higher cost (i.e. capture, separation, and compression) [1],[7],[8], For this reason, the injection of 3,000,000 scf of N2 (standard conditions) before steam (Case 2 in Table 1) was selected (as the best case) for the last stage of production of the well. It is worth mentioning that despite the high cost of CSS + Flue Gas, there are ongoing efforts to evaluate the potential of new capture technologies of flue gases from steam generators for its possible use in hybrid CSS methods.
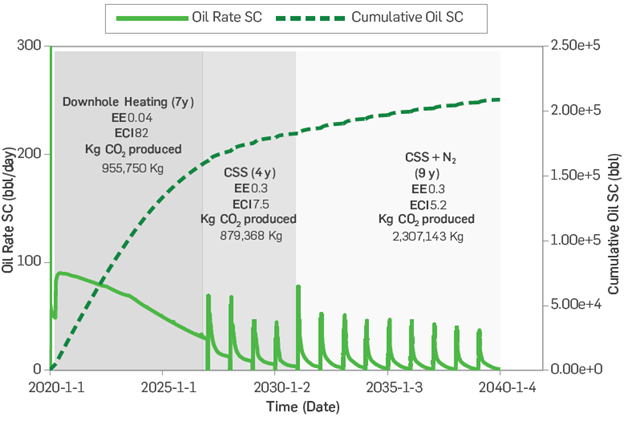
After integrating the results described above, the optimal DPHOW identified under numerically simulated conditions includes seven years of downhole heating, followed by four years of conventional CSS and ending with CSS + N2 for the remaining nine years of production (Figure 3).
In the proposed optimal DPHOW, during the Initial stages, downhole heating represents the best option to take advantage of the natural reservoir energy. As the reservoir energy drops, the use of CSS provides energy support combined with viscosity reduction effects. Once CSS becomes inefficient, the use of hybrid CSS with N2 continues to provide energy support with the gas improving sweep efficiency due to trapped gas and relative permeability hysteresis effects [9], and similar to those observed during water-alternating-gas (WAG) methods [10].
The effect of gas during steam injection is under evaluation at the laboratory scale to better understand the mechanisms that can explain the increase in oil production observed in this hybrid method. It is important to highlight that the EEs are very efficient (well below 1) in all three production stages (Figure 3). These results indicate that less surface energy is required to produce 1 BTU of oil equivalent. As expected, the ECl's decreases over time due to the oil production decline that requires the same or more surface energy to produce a barrel of oil during later stages of production.
When comparing the optimal DPHOW with the conventional development by CSS over the same period of 20 years, the optimal DPHOW strategy accelerates oil production. Also, it shows better energy and environmental efficiency than the traditional CSS, which required 22 additional cycles to reach the same final oil recovery (Figure 4).
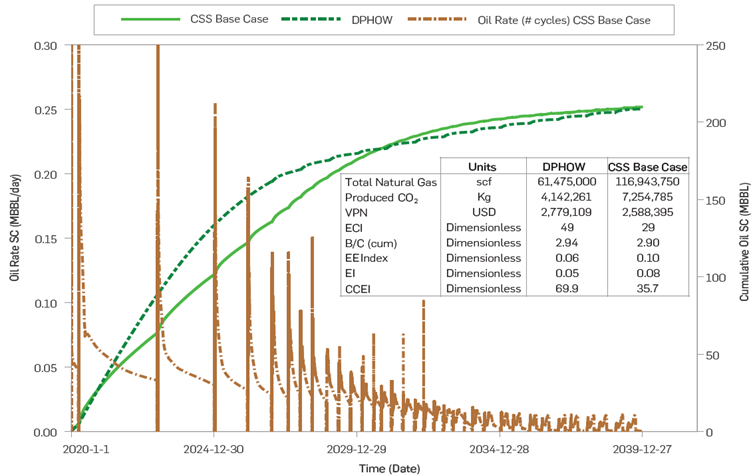
Figure 4 Comparison of the historical production, energy, and environmental indexes of the optimal DPHOW vs. conventional CSS.
The EE index reported in Figure 4 represents the total energy injected and produced over the 20 years evaluated. In summary, although the final oil recoveries from both well development approaches were similar, the optimal DPHOW shows better energy efficiencies at initial and subsequent stages of production compared to conventional CSS.
The next step in this study was to evaluate the use of different energy sources to support the proposed optimal DPHOW ( Figure 3). The use of renewable energy for oil and gas operations, including steam generation, have been documented in the literature [11]-[14]. Therefore, in this study, different sources of energy were evaluated (solar, wind power, and electric/power grid) and compared against natural gas (cases described above - Figure 4). The best DPHOW scenarios were evaluated with the three energy sources for the first seven years using downhole heating and the last thirteen years of steam injection (CSS and CSS + N2), assuming the use of an electric steam generator [15]. This assessment was based on the calculation of the CCEI index (Equation. 4) to identify the energy source that can generate profitable DPHOW with the least amount of CO2 emissions. The cases for energy sources evaluation include:
Case 1: 100% natural gas (base case).
Case 2: 35% electrical grid (first seven years of electrical heating), 65% natural gas (rest of DPHOW).
Case 3: 100% electrical grid (vaporizing water with electrical energy).
Case 4: 100% solar energy.
Case 5: 50% solar panels and 50% electrical grid.
Case 6: 100% wind turbines.
Case 7: 50% wind turbines and 50% electrical grid.
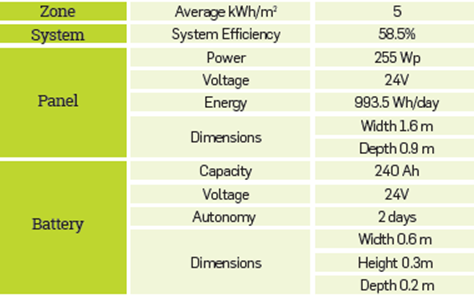
Basic technical specifications and costs used to calculate the CCEI are summarized in the Appendix at the end of the paper.
The El and CCEI were calculated for the cases evaluated. The results are summarized in Figure 5. The DPHOW supported with wind energy (cases 6 and 7) shows profitable projects with good EI and CCEI according to the proposed methodology. However, generation of wind energy will depend on the stability of sustained wind speed, which can limit its applicability in the case under consideration [16]. The scenarios considering solar energy (Cases 4 and 5) are feasible based on the Direct Normal Irradiation (DNI) in the region of interest [17]. DPHOW supported with solar energy is also environmentally efficient (EI < 0.026), but the high costs of the technology strongly influence project economics [17]-[18]. The high cost of solar energy can be mitigated by using several wells to justify installation investment (i.e. cluster of wells per area of solar panels installed). However, this analysis is beyond the scope of this paper.
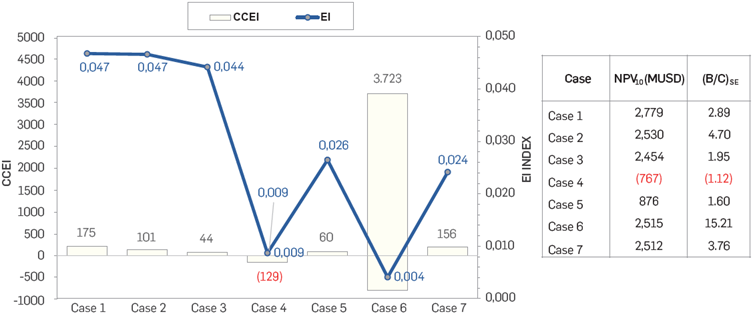
Figure 5 Summary results of EI, CCEI, NPV, and (B/C)SE obtained during the evaluation of the optimal DPHOW with different energy sources.
Regarding the DPHOW cases evaluated using 100% natural gas (Case 1) and 100% supported by the electric grid (Case 3), both show similar EI but differs in terms of implementation costs. These results can be explained by the higher costs of the energy mix supporting the electric grid [18] compared to natural gas [19].
Based on existing conditions of the portfolio of reservoirs under evaluation, the scenario of the optimal DPHOW identified suggests that case 2 (35% electrical grid and 65% natural gas) represents the most feasible scenario in the short term.
4. RECENT ADVANCES IN HYBRID CSS METHODS
The evaluation of hybrid CSS technologies as part of the tEOR R&D program started in early 2018, and preliminary results have been published elsewhere [3],[5],[7],[20]. Therefore, this section will summarize recent advances evaluating hybrid CSS at laboratory and field scale. These activities are aimed to understand critical mechanisms, generate reliable laboratory data for numerical simulation purposes, and reduce possible uncertainties to potentially define future hybrid CSS pilots and potential project expansions in Colombia.
LABORATORY STUDIES
naphtha, including the history matching of each of the experiments using a commercial simulator. These experiments provide relevant information such as but not limited to:
According to the analysis developed in the tEOR R&D program based on numerical simulation and the energy cost index (ECI), CSS with foams outperformed hybrid CSS with flue gas or solvents [3],[5] Additionally, CSS with foams has been tested for the last decade in Colombia [21] and, most recently, by Ecopetrol using a different operational approach [20], However, this will be briefly discussed in the following section of this paper.
The CSS + foam pilot was implemented using the chemistry tested in analog fields producing from the same formation [22]. Hence, the first phase of experimental studies was carried out focused on basic foam stability (quality and texture) tests and its compatibility with reservoir fluids [20]:
Foam stability was performed in a foam meter connected to an N2 supply and temperature control. With these tests, it was possible to evaluate surfactant concentrations, N2 rates, foam stability with temperature, and presence of oil over time.
Fluid compatibility tests consisted of evaluating the potential interactions of the surfactants (foaming agents) with reservoir fluids (water and oil) and injection water at different temperatures. Although the CSS with foam pilot was developed by injecting preformed foams, oil-water emulsification tendencies were also evaluated using different surfactant solutions at different concentrations considering varying water-oil ratios.
The second phase of experimental studies includes an ongoing Laboratory program to evaluate hybrid steam injection. The hybrid methods under evaluation include steam injection with flue gas or solvents. The results of these experiments are compared with conventional steam flooding and cyclic steam stimulation (CSS)
The experiments were conducted in sand packs using reservoir sand and dead crude oil of a representative HO oil of the VMM with ongoing CSS projects. For all the experiments, synthetic brines were prepared based on the compositional analysis of produced water of the field under evaluation. Table 4 summarizes the basic properties of the sand packs used for these experiments.
Table 4 Properties of sand pack used for steam flooding and hybrid steam injection.
| Property | Steam flooding (SF) | SF + Solvent | SF + Flue Gas |
| Avg. Porosity (%) | 41.9 | 43.7 | 41.3 |
| Pore Volume (cc) | 856 | 892 | 844 |
| Permeability (D) | 11.7 | 19.9 | 16.9 |
| Initial Oil Saturation (%) | 85 | 82 | 82 |
The tests were performed using a steam injection tube (D=T,9 and L = 42 inches, respectively) with a built-in core-face mounted steam generator. The temperature profiles of the experiments are tracked through 14 thermocouples installed along the steam injection tube [7]. This phase of the study was designed to compare steam flooding (baseline), against continuous steam injection along with the synthetic flue gas (85% N2 and 15% CO2) and steam flooding with naphtha, including the history matching of each of the experiments using a commercial simulator. These experiments provide relevant information such as but not limited to:
Steam front velocities.
Residual oil saturation (displacement efficiency).
Detect and quantify specific components in the produced gases (i.e. H2S, CH4, N2, and CO2). This information will also be critical to potentially understand possible trapped gas (i.e. Flue Gas/CO2 storability as critical gas saturation) and its potential impact on the hysteresis of relative permeability. These variables are also valuable for history matching purposes.
Changes in the produced oil composition (i.e. crude oil interaction with naphtha at steam conditions) and its possible impact on higher oil recoveries.
Preliminary results show that the use of hybrid technologies has a positive effect on oil production. In terms of oil displacement, both hybrid tests report more than 85% of displacement efficiency compared with the conventional steam flooding (80%). Additionally, the steam-oil-ratio (SOR) using hybrid technologies was reduced considerably (almost 7 in SF) and also H2S production was minimized (800 ppm in SF)
Table 5 summarizes some of the results of the tests, however, these results are documented in a related publication [7]
Table 5 Preliminary results of conventional and hybrid steam flood tests.
| Process | Max. Steam Temp. (°C) | Steam front velocity (m/h) | Oil Recovery (%) | SOR | H2S Production (ppm) |
| SF + Solvent | 315 | 0.29 | 94 | 1.5 | Low (a) |
| SF + Flue Gas | 275 | 0.25 | 85 | 1.4 | Not detected |
Although this laboratory study is still ongoing, some initial observations of the displacement tests include:
Hybrid steam flooding showed low production of H2S,
Estimated solvent produced in liquid phase was approximately 80%. Solvent recovery is a key variable to be included in economic evaluations.
Hybrid technologies showed a low steam front velocity. This can explain the higher oil recoveries observed. However, the mechanisms that can explain the high oil recoveries found in hybrid steam floods (i.e. trapped gas, oil compositional changes) are still under evaluation.
CSS + FOAMS PILOT UPDATES
The evaluation of steam injection methods is of great interest to study options for the development of heavy oil resources in Colombia [23],[24], Cyclic Steam Stimulation (CSS) still represents the most important tEOR method implemented in the country. However, for fields with multiple wells in advanced stages of CSS, there are significant efforts to study hybrid steam methods as an optimization strategy to extend the productivity of mature wells [5],[25],[26]. As indicated earlier in this paper, the efforts of this R&D program include evaluating the most promising technologies identified over the last two years of studies. Based on the proposed methodology, previous field experiences in the same basin and numerical simulation studies, CSS with foams outperformed other hybrid steam methods tested [5]. Furthermore, one of the achievements of this program, designed to support the implementation of this technology, was the development of a wellhead device to preform and inject stable foams.
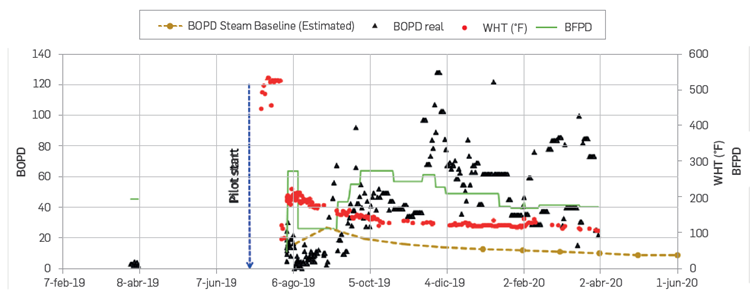
Two-well pilot test was sanctioned in May and implemented in July 2019. Details of the pilot design, implementation, and preliminary results were documented in the literature [20]. A summary of pilot performance updates as of March 31st, 2020. To date, both wells are still showing incremental recoveries validating the potential of foams to divert the steam injected to uncontacted zones. Figure 6 shows the production history of one of the pilot wells. Production performance indicates an increase in oil productivity, which is well above the estimated baseline (dashed gold color line).
With the results obtained during the first nine months of the pilot, there are several areas in Colombian heavy oil fields identified as candidates for steam + foam injection in the future. Additionally, some ongoing efforts to improve this technology include the evaluation of new foam agents, simulation modeling, and especially considering the use of CO2 or flue gas (as part of the strategy to optimize the environmental and energy efficiencies of CSS in Colombia).
CONCLUSIONS
This paper summarizes the advances of downhole heating and hybrid cyclic steam methods R&D program aimed to develop methodologies to screen and rank technologies to increase heavy oil recoveries considering a combination of simplified economics, energy, and environmental indexes. The proposed methodology has contributed to reducing the cycle of pilot implementation based on the proper use of the analog concept for reserve estimation (PRMS).
The proposed approach represents a valuable methodology to identify the best scenarios of the development plan of heavy oil wells (DPHOW) with better oil production performance and improved energy and environmental efficiencies compared to the conventional approach of cyclic steam stimulation. However, it is important to remark that the use of different energy sources for downhole heating and steam injection technologies will depend on the resources available in specific locations.
Cyclic steam stimulation (CSS) with foams was successfully implemented in two pilot wells using the proposed methodology. After nine months of operation, both pilot wells are still producing well above the baseline. It is expected that the incremental oil period will last longer than the previous steam cycle under CSS (< 1 year). However, there are several areas identified for improvement that will contribute to meet Colombia's energy needs sustainably


