


 English (pdf)
 Article in xml format
 Article references
 Send this article by e-mail
 Cited by SciELO
  Cited by Google
  Similars in
SciELO
Similars in
SciELO  Similars in Google
 Permalink
1. Introduction
In the last decade, several countries have increased the number of patent applications as a consequence of subsidies and investment aimed to improve the innovation activities, particularly in renewable energy technologies (Lu, 2013; Miyamoto & Takeuchi, 2019; Romano et al., 2017). Patents include information that can be used as an indicator to assess the technological development of a country (Boeing & Mueller, 2016; Ernst, 2003). Thus, patents become a significant source of information to understand the dynamics of the Innovation System (IS).
Researchers and policymakers have shown keen interest in patent analysis (Abbas et al., 2014; Squicciarini et al., 2013; Tseng et al., 2007). In this sense, the patent information systems provide several measures that have been used as quality indicators for patent analysis (Boeing & Mueller, 2019). However, the patent information sources, especially in Latin America, are scarce, and that makes the study of these topics in the region complex and critical (Barroso et al., 2009). Additionally, patent analysis comprises several dimensions, which determine the features of a patent that make it “good” or “bad”, in terms of social utility and commercial success (Guerrini, 2014; Reitzig, 2003). Despite different measures to determine the patent quality have been proposed, few studies have discussed the impacts of patent quality on the IS from a systematic perspective; the issue addressed by this paper. The main research question of this paper is: How do quality and value patent measures promote the development of IS for the diffusion of renewable energy technologies?
Currently, society faces grand societal challenges associated with the depletion of natural resources, involving the transition to clean technologies. One of the frameworks from innovation studies that have the potential to contribute to the understanding of sustainable technological change is the IS approach (Hekkert & Negro, 2009). As technological change can be an essential driver of patent applications, given that it is one of the outputs of this process, it also can be used as a measure to understand the diffusion of climate-friendly technologies (Hall & Helmers, 2013). Thus, this paper aims to contribute to this issue through a systemic intervention. In the case of the renewable energy sector, this intervention shows the impacts of patent quality.
Although patents play a prominent role in the IS, eventually low-quality patents may lead to “innovation system failure”; for instance, delays that affect the diffusion and use of a particular technology (Negro et al., 2012). Thus, a dynamic behaviour hypothesis in terms of the Causal Loop Diagram (CLD) can explain the effects of the delays on the IS. The dynamic behaviour hypothesis is a conceptual model that seeks to define the critical feedback loops that drive the system’s behaviour (Bala et al., 2017; Sterman, 2000). In this paper, the dynamic behaviour hypothesis was designed to explain how patent quality contributes to the renewable energy innovation system.
Previous studies have shown the importance of the process of technology transfer as an essential aspect for the development of the renewable energy system (Herrera, Dyner, et al., 2019; Jimenez et al., 2016; Reichardt et al., 2017). However, a more detailed understanding of the innovation policy intervention, in terms of the patent indicators on the technology transfer process, is required. The paper addresses this gap in the literature by examining the role of the patent quality indicators for innovation systems.
The remainder of the paper is organised as follows: Section 2 introduces the methodology adopted to address the proposed question. Section 3 discusses the critical measurement of patent quality from a literature review, and exhibits a systemic intervention. In this section, a dynamic behaviour hypothesis shows the influence of patent quality on the IS and its economic implications. Finally, the paper presents the conclusions and future research directions.
2. Research method
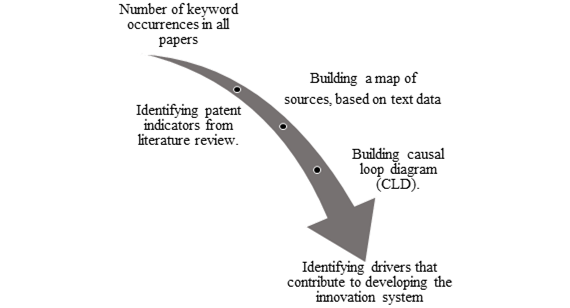
Figure 1 shows a brief representation of the research method carried out in this paper. The selected method comprises five steps: First, from the literature review, the co-occurrence of keywords was analysed and clustered. Second, a map was developed, defining documents published and citations received by sources (i.e. journals). Third, a discussion concerning quality patent indicators is carried out. Fourth, a dynamic behaviour hypothesis through a Causal Loop Diagram (CLD) is proposed for analysing the influence of patent quality on the renewable energy innovation system. Fifth, a chart is projected to identify essential drivers of patent quality that stimulates the innovation system.
This paper conducted a systematic review that shows the patent quality indicators reported in the literature. The systematic search includes two databases - Web of Science and Scopus -, for published papers between 2011 and 2020. In both databases, the search was “patent indicators” or “measuring patents” or “patent value indicator” in the title, abstract and keywords (i.e. Scopus: TITLE-ABS-KEY(“patent indicators” OR “measuring patents” OR “patent value indicator”)), and in Web of Science: (TS=(“patent indicators”) OR TS=(“measuring patents”) OR TS=(“patent value indicator”)). On the literature, “patent quality” and “patent value”, some times are used as similar concepts to describe that a patent can have several characteristics related to the social and private usefulness of the document, and its related invention (Abbas et al., 2014; Mann, 2008).
After this process, the following step was to refine our search, keeping the relevant papers - Scopus (197 papers) and Web of Science (87 papers) - including discussions about patent quality indicators. Although our search was limited to journal articles, a few working papers and conference papers relevant were also included. Besides, the references of the papers were verified to identify other documents that our search may have not identified. Note that the materials found by the two databases were combined to remove duplicates.
Based on the systematic review, the paper shows a network of keywords that indicates the number of documents in which a word occurs at least once. The number of occurrences of a keyword was used to determine the relationship of words with the research issue in the entire documents. Subsequently, a source map was elaborated to analyze the number of papers and normalize their citations. The normalized citation of a paper is calculated as the number of citations divided by the average number of citations of all papers in the same year (van Eck & Waltman, 2020).
Abstract and titles of the papers were screened independently to identify patent indicators used by literature. Then, the full papers were screened to compare their results and discuss differences between the used indicators.
Additional to screening all the papers, a CLD was elaborated to understand the relationship between the patent quality indicator and the IS. A CLD can be defined as a simple representation used to describe and analyse the dynamic structure of a complex system (Bala et al., 2017; Mollona, 2008; Rahmandad et al., 2009; Sterman, 1989).
3. Results and discussion
This section presents the results in two parts: i) the systematic literature review developed (i.e., the first three steps) in subsection 3.1, and ii) the systemic intervention developed to represent the case study in subsection 3.2.
3.1 Identifying measurement scales for patent quality from the literature review
Number of occurrences of a keyword
A map was created based on bibliographic data files (i.e., Scopus and Web of Science) for exploring and visualising the keyword network (van Eck & Waltman, 2020). Figure 2 shows this network visualisation, which represents the number of occurrences of a keyword in all the papers. The color of the keyword is determined by the cluster to which the item belongs. The distance between two keywords determines a cluster, and denotes their relation in terms of neighbourhood (e.g., “patent indicators” and “patent analysis”). Likewise, the size of the circle indicates the number of occurrences of a keyword in entire papers. The results show twenty-three keywords identified into four clusters. The higher number of occurrences identified in author keywords, are: 29 occurrences of “patent indicators” in the first cluster; 20 occurrences of “patent analysis” in the first cluster; 20 occurrences of “patent” in the second cluster.
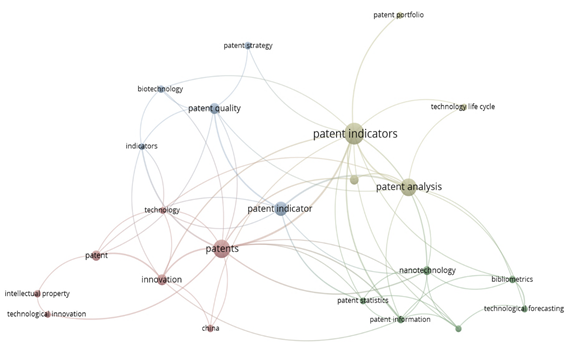
Other network attributes that show these results are total link strength. The total link strength attribute indicates the number of links of a keyword to other keywords (van Eck & Waltman, 2020). The higher number of links strength identified into four clusters are 14 links by “patent indicators”, 13 links by “patent” and 10 links by “patent analysis”. These results show that the patent indicator term in several reviewed papers is mainly associated with innovation and technology.
Source Map (papers)
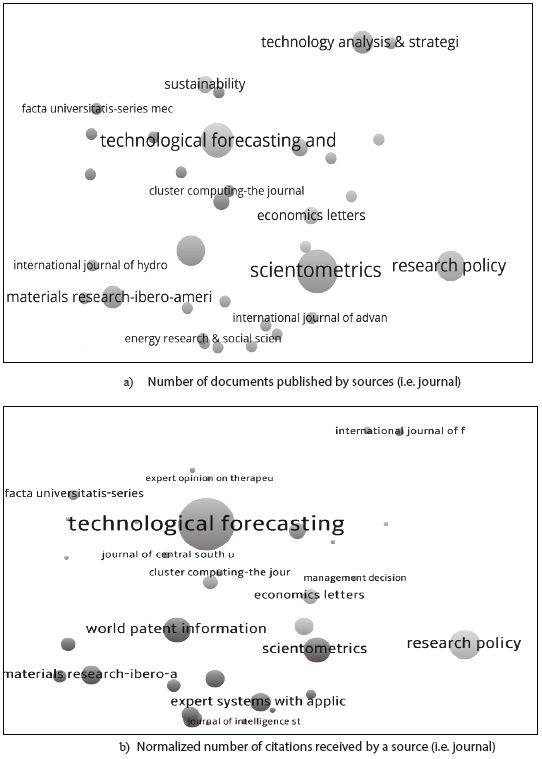
The bibliographic data files were used to identify and built a network of sources and citations provided by literature. Figure 3 shows a map based on text data, in terms of papers published by journals and the number of citations received by those journals. On the one hand, the results show that the more prestigious journals in the patent indicator issue are: “Scientometrics” (9 papers), “Technological Forecasting and Social Change” (6 papers), “Research Policy” (5 papers) and “World Patent Information” (5 papers). Moreover, the map identifies higher link strength - bibliographic coupling links - between “Scientometrics” and “World Patent Information”, as illustrated in Figure 2(a). On the other hand, the higher normalized number of citations by journals is 23.56 citations (“Technological Forecasting and Social Change”), 7.46 citations (“Research Policy”), 5.51 citations (“Scientometrics”) and 5.31 citations (“World Patent Information”), as illustrated in Figure 2(b). Note that the normalization corrects the fact that older papers have had more time to receive citations than more recent papers (van Eck & Waltman, 2020).
Identifying patent indicators
Researchers have created countless patent quality indicators to determine the potential impact of a given invention (Kapoor et al., 2015). Despite the existence of different patents quality indicators, citation-based indicators are the most used by researchers (Aristodemou & Tietze, 2018; Chang et al., 2018; Kapoor et al., 2015). Citation-based indicators allow to identify the links between patents and helps to evaluate the originality and relevance of the innovation (Chang et al., 2018). Moreover, patent indicators provide information about the social utility and commercial success of the innovation process (Harrigan et al., 2017).
Citation-based indicators can be classified into two categories: i) the backward citations defined as the references made to previous patents, and ii) the forward citations determined by the references received from future patents. Backward citations are used to measure the knowledge transfer related with the invention (Hall et al., 2005; Harhoff et al., 1999; Reitzig, 2003), while forward citations are used to measure the technological impact of innovation (Kapoor et al., 2015; van Zeebroeck, 2011; Verhoeven et al., 2016). Although citation information has provided useful information on the value of patents, backward citations, as an indicator of information have been more controversial (Nagaoka et al., 2010).
According to the different patent indicators, Trajtenberg (1990), introduced forward citations as patent value indicators which have been used in numerous studies (Harhoff & Reitzig, 2004; Lanjouw & Schankerman, 2002). Subsequently, Hall & Jaffe (2001), used normalized citation counts by technology and priority years of the patent. A constraint in this method is that it does not investigate how the patent quality progresses over time (Boeing & Mueller, 2019). Reitzig (2004), applied value indicators to estimate the value of patents - classifying the indicators into first, second and third generations. The first generation includes forward and backward citation data and patent family size. The International Patent Classification (IPC), is used in the second generation; lastly, the third generation incorporates claims of the patent application. Lanjouw & Schankerman (2004), proposed a patent value indicator to assess R&D performance that includes several patent indicators (e.g., patent family size). The results of the study of Lanjouw & Schankerman (2004), show that companies with more self-citations are capable to obtaining returns from earlier investment in R&D and demonstrate the presence of suitable innovation processes. This study concludes that the use of multiple indicators reduces variation between 20 and 73% in the measure of patent quality.
Other studies extended the quality indicators, for instance, Beaudry & Schiffauerova (2011), estimate the impacts of collaboration and network indicators on patent quality - including the number of claims (the set of requests that the applicant is claiming to the patent authority to be protected), of the patent application- as a central variable of the study. Saint-Georges, Pottelsberghe & Potterie (2011), incorporate a novel model that includes the measure of patent quality to analyze the implications of intellectual property rights. Ernst & Omland (2011) developed a novel benchmarking methodology for assessing a firm’s patent portfolio vis-à-vis its competitors. The study concludes that the developed method becomes an indicator of innovativeness and sustainable competitive advantage in many industries. Moreover, some studies show how patent quality is associated with individual features of inventors in terms of individual characteristics (e.g., age, gender and level of education) which influences on the creation of the network (Pinto et al., 2019; Schettino et al., 2013).
A previous literature review identified nine forward citation-based measures (Aristodemou & Tietze, 2018). The measure is divided into two categories: i) the patent level (citation index, influence, forward citation, generality), and ii) the patent portfolio level (relative patent position, technology strength, current impact index, hindrance index). However, the study addressed by Aristodemou & Tietze (2018), only provides a quick access point to the literature of forwarding citation-based measure.
3.2 Systemic intervention
On one hand, the paper presents a case study of renewable energy technologies for three reasons. First, R&D activities and patent applications in the renewable energy sector have significantly increased. Second, patent management activities such as valuation are especially crucial for renewable energy diffusion, particularly in Latin-America (Leusin et al., 2018). Finally, climate change brings challenges and opportunities for renewable energy technologies which promote R&D activities, fostering the social use of the patents (Miyamoto & Takeuchi, 2019). On the other hand, given that patents are innovation process output-indicators, literature reviews reinforce the fact that there must be a relationship between the quality of those outputs, and the quality of the complete innovation system; therefore, a link between the known indicators of well-functioning innovation systems and patents can be backed.
Table 1 shows the functions of an innovation system addressed by previous studies on the renewable energy diffusion (Kebede & Mitsufuji, 2017; Negro et al., 2012; Suurs, 2009). This paper adopts the functions approach to draw the relationship between the patent quality and the IS. As Hekkert, et al. (2007) claims, a systemic perspective based on innovation functions allows a mapping method of innovation determinants.
Table 1 Functions of a technological innovation system (TIS) (based on Hekkert et al., 2007; Hekkert & Negro, 2009; Miremadi et al., 2018; Suurs, 2009).
| TIS Functions | Description |
|---|---|
| Knowledge development | This function encompasses the activities for generating knowledge within the innovation system. |
| Knowledge diffusion | This function has the purpose of transfering knowledge through the interaction between actors (i.e., fostering networks). |
| Guidance of the research | Covers the activities within the IS that affect the specific applications of the technology. |
| Entrepreneurial activities | The role of the entrepreneur is to revitalize the potential of new knowledge, networks and markets into strategies to generate advantages for the business. |
| Market formation | This function includes the formation of volatile niche markets for specific applications of the technology. |
| Resource mobilization | Comprises the activities associated with the allocation of resources as an input function to the innovation system. |
| Creation of legitimacy | This function comprises the activities that guarantee the acceptance of the new technology. |
We allocated patent indicators, based on the literature review, to seven innovation functions to enable assessment of their strength through a CLD, as illustrated in Figure 4. The CLD shows how green patent quality influences in renewable energy diffusion and R&D funding and activities, creating a balanced loop (B1). The investment of new renewable capacity generates incentives to patent, influencing innovation policy reforms as well as new investments in capacity, reinforcing loops R1 and R2. The reinforcing of loop (R3) represents the influence of R&D investment to promote green patents for the electricity sector. Fostering R&D activities is required to stimulate changes to the innovation policy, adopting incentives to build renewable energy capacity (reinforcing of loop R4).
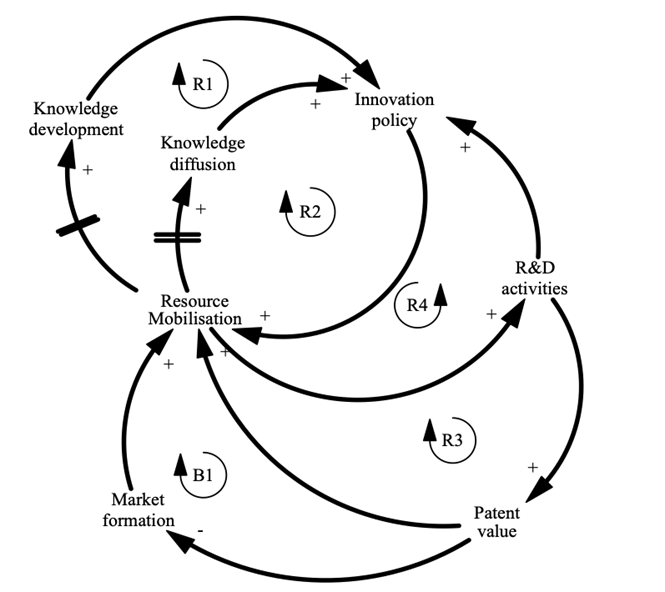
Figure 4 CLD developed to identify the main interactions between patent indicators and IS functions for the case study.
From the CLD, Table 2 shows a combination of patent indicators and indicators for assessing IS functions proposed by Miremadi et al. (2018). The construction of this set of functions and their links to patent indicators are based on a membership function, as illustrated in Equation (1). The Equation calculates the strength of the effects of the patent indicator (S) - EfPI(s) - on the indicator of IS functions. Note that values of 0.22, 0.61 and 1 only represent membership or non-membership of the patent indicator in the case of the renewable energy sector.
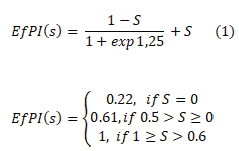
Table 2 Summary of patent indicators and their links to indicators used to measure IS functions (based on Lee et al., 2018; Miremadi et al., 2018).
| Innovation system functions | |||||||
|---|---|---|---|---|---|---|---|
| Patent indicators | Knowledge development | Knowledge diffusion | Guidance of the search | Entrepreneurial activities | Market formation | Resource mobilization | Creation of legitimacy |
| FC | SPP (1) | WC (1) | |||||
| BC | SPP (1) | KEN (1) | |||||
| TO | KEN (1) | EDA (1) | |||||
| TCT | SDT (1) | TAS (1) | |||||
| TS | SDT (1) | EA (1) | NM (1) | TAS (1) | |||
| CS | KEO (1) | NM (1) | RGI (1) | ||||
| C | RF (1) | NSI (1) | FDI (1) | ||||
| I | RF (1) | NSI (1) | FR (1) | ||||
Type of patent indicators (S)
FC: forward citation
BC: backward citation
TO: technological originality
TCT: technology cycle time
TS: technological scope
CS: commercial scope
C: collaboration
I: inventors
Indicators used to measure IS functions
SPP: scientific publication and patenting
NSI: network size and intensity
RF: number of R&D projects
KEN: knowledge exchange in networks
WC: workshops and conferences
KEO: knowledge exchange between organizations
SDT: routing development towards specific technological alternatives
NM: number of niche markets
TAS: technical assessment studies
FR: financial resources
EDA: experimentation and demonstration activities
EA: export activities
FDI: foreign direct investment
RGI: rise and growth of interest groups
Improved diffusion of innovations for the renewable energy sector, requires a strategic initiative that contributes to stimulating the adoption of clean technologies such as wind and solar power (Herrera, Cosenz, et al., 2019). The systemic intervention suggests a set of alternatives in the renewable energy sector for revitalizing the IS, including market formation, creation of legitimacy, and identifying relevant sectors.
Fostered social utility and commercial success - market formation
Previous studies show how the “wicked social problems” hamper the diffusion of renewable energy technologies because social utility and impacts of the new inventions are not considered (Brannstrom et al., 2017; Gorayeb et al., 2018; Negro et al., 2012). First, this may require the development of an innovation policy focused on inventions, which reflect the social utility of the local economy. As argued by Kitson (2019), a similar interventions policy may lead to very different impacts in other places. Second, building networks facilitate the market formation and commercial success, to improve the diffusion of clean technologies appropriate for the local economy. The networks allow managing value chains that stretch globally functioning as a structural coupling element (Bergek et al., 2015).
Creation of legitimacy and political context
The R&D activities to develop new inventions and patent applications become a crucial aspect for IS-based policy-making (see, reinforcing loop R2 and R4). As Bergek et al. (2015) claims, the availability of public financial resources for research and development, contributes to increased societal legitimacy of the technological field that positively impacts on the entry of new actors - investors, entrepreneurs and local governments - who bring resources to the IS. In this sense, the alignment between institutions and entrepreneurs could improve the innovation policy design to gain access to the necessary resources for the development of new technologies.
Identifying relevant sectors for patent applications
The resource mobilization function comprises the activities associated with the allocation of resources as an input function to the innovation system - mainly contributing to serving the sector overall. Sectors rely on a broad set of technologies in various stages of maturity and consequently, on different IS (Aguirre-Bastos & Weber, 2018; Bergek et al., 2015), which involve identifying strategic resources to revitalize innovation activities. Thus, the identification of relevant sectors for the patent applications contributes to improving the allocation of resources both at public institutions and private sectors.
4. Conclusions
From the literature review, a critical difficulty identified is that patent quality, in terms of useful social results, is generally not well-defined within the IS. The innovation activity is highly concentrated in two innovation functions - knowledge development and diffusion - ignoring at times, market formation and creation of legitimacy. Previous studies argue the difficulty generated by this issue in the diffusion of renewable energy (Negro et al., 2012). In this sense, this paper combines patent quality indicators with the IS functions for identifying drivers to promote renewable energy technologies.
The systemic interaction shows that patent value stimulates the dynamic of the IS particularly new investment for the R&D activities and promotes the sustainability transition in the renewable energy sector, especially because, according to literature, there is a connection between technical quality, economical and social value. The paper ends with a reflection of the strategies that may revitalise the IS supported by R&D activities which could increase patent applications.
Future works will include a formal simulation structure based on the CLD, known as a stock-and-flow diagram, for identifying essential drivers that stimulate the innovation system in the long-term. To further investigate the role of a patent indicator in Latin-America, innovative frameworks to measure the innovation activity based on an aggregated indicator for each country should be developed.

