


 English (pdf)
 Article in xml format
 Article references
 Send this article by e-mail
 Cited by SciELO
  Cited by Google
  Similars in
SciELO
Similars in
SciELO  Similars in Google
 Permalink
1. Introduction
Groundwater supplies 50% of the world’s population and represents 43% of the water used for irrigation 1. According to UNESCO 1, 2500 million people depend on this resource daily to satisfy their needs. As population growth increases, groundwater resources are under greater pressure, and 20% of aquifers are being overexploited. Being able to estimate aquifer recharge is critical for the integrated management of groundwater resources because it allows the design of priority areas for conservation. Spatially delimiting groundwater resources can be considered an initial approach in obtaining a greater knowledge of the general dynamics of water 2.
Any study involving water resources, particularly studies involving issues such as the transport of pollutants, subsidence processes, and the disposal and reuse of liquid effluents in soils, should include the identification and quantification of recharge 3. Therefore, understanding and quantifying recharge processes is required to analyze water resource sustainability and to provide basic information for land-use decisions 4. However, many human activities such as agriculture, livestock, forestry production, urban development, industry and the disposal of wastewater (treated and untreated) in soils alter the characteristics of natural water recharge zones and interfere with water infiltration 5.
Physically, aquifer systems are fed naturally through their recharge zones, which are areas with geological, edaphic, and climatic characteristics that facilitate the infiltration and movement of water toward saturation zones. In this regard, recharge zones have been defined as areas of special importance because they present the greatest input of water to aquifer systems 6-10 and are potential sources of water for human consumption and other economic activities. To protect aquifers from becoming contaminated, it is necessary to restrict current and future land-use practices, the discharge of liquid effluents, and the dumping of waste in recharge areas 11.
Regarding the design and application of methodologies for evaluating aquifer recharge zones, studies carried out in India identified the recharge zones of an aquifer in an urban settlement using environmental isotopes (2H, 3H, 18O) that were correlated with hydrogeological conditions. The mapping of potential recharge areas was based on the soil type and the depth of the water table. Hydrogeological evidence was used to approximate the spatial distribution of permeable zones, slopes, and boundary conditions, which was validated isotopically 12. In another Indian study, a technique was developed to delimit artificial recharge zones by integrating remote sensors and geographic information systems (GIS) to increase the scarce groundwater reserves west of the Medinipur district of West Bengal 10.
In the Aguascalientes Valley, Mexico, a methodology was developed to identify areas with the potential to be naturally recharged by aquifers. The researchers applied a multi-criteria process with GIS in areas of high geological heterogeneity located in three geological provinces: the Sierra Madre Occidental, the Mesa Central, and the Trans-Mexican Volcanic Belt. The study area presented different outcroppings of acidic extrusive igneous, intrusive igneous, continental, and marine sedimentary, metamorphic and sedimentary rocks. Information on the lithology, precipitation, drainage density, vegetation cover, land use, and topography was analyzed 13.
The environmental isotopes 2H, 18O and 3H have been used to identify possible sources and recharge areas in Colombia in the Bajo Cauca Antioquia aquifer, which is geologically associated with recent alluvial deposits of the Cauca River’s main channels and its tributaries and the upper and lower members of the Cerrito sedimentary formation 14.
At the end of the 1990s, in the study area, the Environmental Authority (CVC) 15 determined the regional groundwater flow system in the Cauca River valley, based on the water level of 1200 constructed wells. From which, the piezometric head and the hydraulic gradients were determined, to preliminarily delineate the recharge and discharge areas of the regional aquifer.
In 2015, a conceptual model of the aquifer was validated; the diffuse recharge was estimated using a methodology based on the hydrometeorological balance of the subsoil at a resolution of 250x250 m. The calculated average multiyear recharge was 3840 km3/year (597 mm/year) 16. This estimate was made for the management and use of groundwater in Cauca River valley.
Based on this scenario, the development of methods for delimiting recharge areas, which can be used to inform the organized and sustainable use of a territory, is considered a significant contribution to the management of groundwater resources. The objective of this research was to develop a methodological tool to evaluate the potential recharge zones (PRZs) in alluvial aquifers, due to the importation of these areas in the land use planning. The Bolo River hydrogeological area in the department, Colombia, was taken as a case study. An additive type index processed using GIS tools that consider the local hydrogeological environment at a detailed scale (1:25000) was developed. This research was conducted using the groundwater resource database of the Environmental Authority, which has been monitoring the aquifer since 1970 17.
2. Methodology
2.1 Study area
The study area was delimited according to the geology 18 and the surface drainage network 19 in the Bolo River hydrogeological area, Colombia. The study area is located in the Cauca-Patía hydrogeological province and the upper Cauca river basin surface system, between the coordinates 860000N - 1065000E and 885000N - 1100000E (Magna-Colombia-West reference system). The area covers approximately 426 km2 (Figure 1). The limits of the study area are as follows: to the north, the Palmira River; to the south, the Párraga River; to the west, the Cauca River; and the east, a volcanic formation.
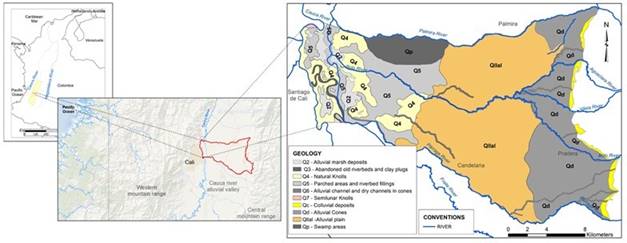
Source: own elaboration
Figure 1 (a) General location. (b) Geology of the Bolo River hydrogeological area.
The predominant slope in the study area varies from 7% to 12%, with an inclined topography covering 61% (261.5 km2) of the area, followed by slightly inclined areas (3-7%) and strongly inclined areas (12 -25%) accounting for 29% (123.9 km 2) and 9% (38.4 km 2) of the total area, respectively 20.
Regarding groundwater management, the area has 450 wells, of which 74% are active and 26% are abandoned or inactive 17. The flows and volumes of water extracted for the different uses are presented in Table 1, which shows that 84% of the water is used for crop irrigation, while 0.5% is used for drinking water and domestic use 17.
Table 1 Groundwater management indicators in the study area
| Management indicators | Groundwater uses | |||
|---|---|---|---|---|
| Industrial | Domestic | Agricultural | Other | |
| Number of Wells | 45 | 21 | 207 | 60 |
| Well percentage (%) | 13.5 | 6.3 | 62.2 | 18.0 |
| Flow granted (l/s) | 694.79 | 100 | 15,719 | 2,293 |
| Flow percentage (%) | 4 | 0.5 | 83.6 | 12.2 |
| Volume extracted (km3/year) | 11.62 | 1.24 | 267.28 | 32.63 |
| Volume percentage (%) | 4 | 0.4 | 85.5 | 10.4 |
Source: adapted from 17.
Geologically and stratigraphically, the study area has the characteristics of an intermontane valley originating from the Cauca River between the central and western mountain ranges and over a narrow valley of tectonic origin. In its origins during the Neogene, this valley was formed in a tectonically active intracordilleran basin, which has received fluvial and volcanic sedimentation from the central and western mountain ranges 21. According to hydrogeological studies, the basement and the geologycal fault region are 1000m deep.
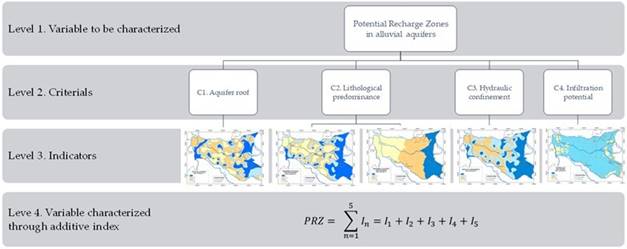
2.2 Design of the PRZ index
The PRZ index was developed as an additive index based on criteria for the categorization and operationalization of variables recommended by Cazau 22, Caparó 23 and Reguant and Martínez 24. In an additive index, all the characterization indicators (i.e., the factors involved in the recharge process) have equal weight in the system and are not conflicting 25.
The first step for the construction of the additive index consisted of developing the conceptual model associated with the definition of a PRZ in an alluvial aquifer. For this, the physical recharge process was diagrammed to identify the intervening indicators in the system. The indicators were identified through a review of the scientific literature using the following search terms: recharge zones, criteria for the delimitation of a PRZ, aquifer recharge and evaluation of recharge zones. The second step involved the selection process for the indicators, which was carried out based on consultations with 62 bibliographic references as well as local experts. The third step consisted of the categorization process of each indicator, which involved assigning categories using value ranges. For this, each indicator took on a value between 0 and 1, with 1 being a zone with a greater recharge potential and 0 being a zone with no recharge potential. The categories assigned to each indicator were based on expert knowledge and a literature review. Once the indicators were categorized, the value of the PRZ index corresponded to the sum of the characterized indicators. The maximum value of the index is n, which corresponds to the number of selected and characterized indicators. The PRZ were categorized by the PRZ index presented in Table 2.
2.3. Implementation of the PRZ index in the hydrogeological area of the Bolo River, Colombia
Based on the physical model of the system and the PRZ index, the study area was characterized using map algebra in the ArcGIS 10.2 software. To generate the map of each indicator, a spatial database was created with the plane coordinate system (MAGNA-SIRGAS-Colombia-West projection system) of 234 existing deep wells. To generate the maps of the indicators I1- Aquifer roof, I2 - Lithological Predominance of the Unsaturated Zone (USZ) and I4 - Degree of Confinement, an interpolation process was performed using the topo-to-raster tool in the ArcGIS 10.2 toolbox, which uses an iterative finite difference interpolation technique.
The main advantage of this approach compared to other methods is its ability to correlate data with a topographic surface 26. The characterization process of the indicators that constitute the designed PRZ index is described below:
Indicator I1 - Aquifer roof: performed based on the lithological column of each well 17, in which the depth (in meters) of the roof of the first aquifer layer was identified from the ground surface.
Indicator I2 - Lithological Predominance of the USZ: performed based on the predominant textural class of the lithological profile of each well from the topographic surface to the roof of the first aquifer layer. The information was obtained from the CVC databases 17.
Indicator I3 - Lithological Predominance of the Saturated Zone (SZ): a correlation between the surface geology map 18 and the predominant texture in the SZ of each well was determined by assigning the predominant textural group shown in Table 3 to each existing well.
Table 3 Predominant texture in the SZ
| Predominant textural group | Description |
|---|---|
| G1 | The predominance of thick layers of permeable strata composed of gravels of medium to coarse grain and the presence of rounded boulders (diameters greater than one meter). |
| G2 | Prevalence of permeable layers of sand and gravel of medium to coarse grain with the presence of loamy soils and clayey-silt soils. |
| G3 | Homogeneous and alternating permeable layers of sand and gravel with clayey and silty lenses. |
| G4 | The predominance of a clay matrix with few alternating sand lenses and gravels of medium to coarse grain. |
Source: own elaboration
The textural group of the well’s lithological profile, with a length of approximately 100 m from the water level to the roof of unit B of the alluvial aquifer 18, was identified. Subsequently, each polygon of the surface geology was assigned the highest proportion of area with respect to the reclassified texture. For this, Thiessen polygons were generated. Once the indicator maps were obtained, the additive process was performed with the ArcGIS 10.2 tool, and thus, the PRZ index map in the hydrogeological zone in the area surrounding the Bolo River was estimated. This map was converted again to a polygon file for area-based estimates, and the data were later categorized into the four PRZ index types (Very High, High, Moderate and Low).
2.4 Validation of the PRZ index based on the hydraulic gradient
The PRZ estimated for the study area was compared with the hydraulic gradient obtained from the piezometric surface based on the average piezometric level of each well, which was measured biannually from 2000 to 2015 17. The piezometric levels were interpolated using the topo-to-raster tool. The isopiezometric contours were traced every five meters. The recharge zones identified by tracing the piezometric surface are characterized by high hydraulic potential values and downward and divergent flow 27.
3. Results
3.1. PRZ Index
The process of selecting indicators for developing the PRZ index was based on a literature review (Table 4), preselecting those indicators with a citation percentage higher than 15% with respect to the consulted authors. Once the preliminary indicators were defined, the criterias were selected in a workshop with local experts. The selected indicators only correspond to parameters intrinsic to the aquifer system. Land cover, management practice and climate indicators were not selected because they are considered external factors to the recharge potential process and can be affected by climate variability, climate change and anthropic decisions.
Table 4 Literature review for the selection process of the characterization indicators
| Indicator | Author(s) | Citation percentage |
|---|---|---|
| Degree of fracturing | 28,29 | 3 |
| Aquifer outcrop | 2,30 | 3 |
| Aquifer roof | 4,29,31-35 | 11 |
| Soil texture | 2,28,29,31-33,36-67 | 63 |
| Ground cover | 2,28,34,37,38,41,48-50,68,69 | 18 |
| Slope | 28,34,35,37,38,40,41,45,46 | 16 |
| Lithology USZ | 2,28,29,31-35,37,39,48,49,56,58,59,62,64,65,67,69-75 | 40 |
| Lithology SZ | 2,28,29,31,32,34,35,37,48,49,56,58,59,62,64,65,67,69,71-75 | 35 |
| Type of rock | 29,31,33,37,47 | 8 |
| Soil management practices | 28,34,37,38,41,47,48,50-53,68,69,74,76,77 | 26 |
| Geology | 29,38,44,78 | 6 |
| Infiltration potential | 29,31-34,36,40,41,45-49,51,53,55,56,58,60,62-68,71,74,76,79 | 48 |
| Climate | 34-36,39,41,42,44,45,47,78,80 | 19 |
| Elevation | 2,29,34,41,45 | 10 |
| Degree of confinement | 29,31-34,48,64,70,75,81,82 | 18 |
| Permeability | 4,29,31,33,34,37,38,40-42,44,46,48,50-55,57,60,63,66,67,83,84 | 42 |
| Porosity | 4,29,31-34,38,40-42,46,48,50-55,57,60,63,66,67,83,84 | 40 |
| Runoff | 33,36,40,42,46,47 | 10 |
| Hydraulic gradient | 11,27,29,31-34,71,85 | 15 |
| Magnitude of recharge | 29,35,39 | 5 |
Source: own elaboration
The indicators related to water level depth, water table depth, aquifer roof and outcrop were grouped into “Aquifer roof” because this concept correlates with the other indicators in its definition. The indicators “soil texture” and “slope” were grouped within “infiltration potential” through the Hydrological Group concept. To avoid redundancy, “porosity” and “permeability” were excluded because they were already represented in the textural classes of the USZ and SZ lithological profiles and the edaphic zone. Table 5 summarizes the selected indicators and their definition.
Table 5 Results of the selection of indicators for the design of the PRZ index
| Indicator | Definition of the indicator |
|---|---|
| Depth of the aquifer roof (I1) | Depth at which the first permeable layer is found, measured from the ground surface. |
| Lithological predominance of USZ (I2) and SZ (I3) | Physical characteristics of the materials of the medium that allow the movement of water, referring to the lithology that indirectly relates the effective porosity, permeability and moisture content (only for the USZ). |
| Degree of hydraulic confinement (I4) | Hydraulic regime of the aquifer, associated with the accessibility of water to the SZ and the direction of flow between the USZ and the SZ. |
| Infiltration potential. Hydrological group (I5) | Physical characteristics of the materials of the edaphic zone (soil) that facilitate water movement, referring to: texture, slope and lithology. |
Source: own elaboration
The conceptual model for the definition of the PRZ index was based on the movement of water from the soil surface to the base of the first aquifer unit. This process distinguished the unsaturated zone (USZ) from the topographic surface to the water level (including the edaphic zone) and the saturated zone (SZ) that starts at the water level to the roof of the confining layer. In the vertical axis, the movement of water begins with the infiltration process on the ground surface to the groundwater level. The horizontal axis shows the surface geology units (Figure 2). The diagram of the conceptualized PRZ index is presented in Figure 3, showing the five indicators selected and characterized in the study area and the index equation.
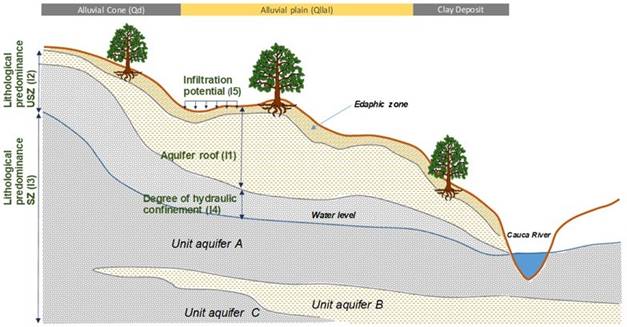
Source: own elaboration
Figure 2 Conceptual model of the alluvial aquifer in the Bolo River hydrogeological area.
3.2. Implementation in the hydrogeological area of the Bolo River, Colombia
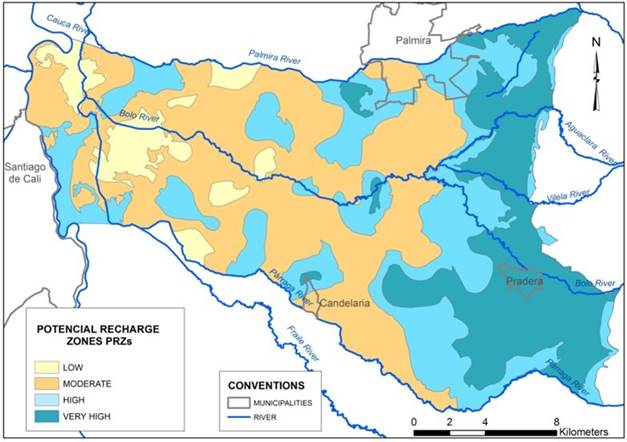
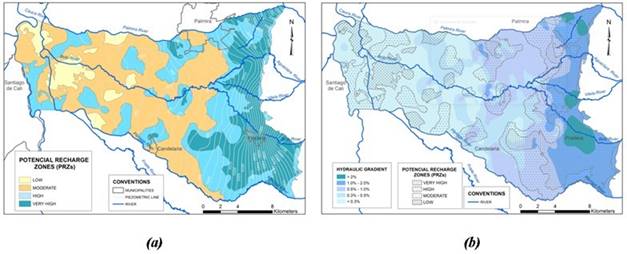
The PRZs in the study area were delimited, and their results are presented in Table 6 and Figure 4. The areas categorized with very high recharge potential were 23% (97.07 km2) of the area and are mainly in the upper part of the debris cones and, to a lesser extent, in focal areas of the mid-section of the alluvial plain.
Table 6 Results of the categorization of the PRZs in the study area
| PRZ | Area (km2) | Percentage with respect to % area |
|---|---|---|
| Very high | 97.07 | 22.79 |
| High | 126.64 | 29.73 |
| Moderate | 172.89 | 40.58 |
| Low | 29.43 | 6.91 |
Source: own elaboration
This recharge potential was due to the presence of unconfined aquifers in 97% of its area and to the roof depth of the first permeable layer less than 2.5 m, occurring in 64% of the area.
Regarding the lithological predominance of the NSZ, the areas with a very high recharge potential were characterized by the presence of permeable strata composed of sand, gravel and/or boulders. The lithological predominance of the SZ was characterized as group G1, which corresponds to strata composed of sand, gravel and boulders, and accounted for over 84% of the area. The infiltration potential of this zone corresponded to hydrological group B for 83% of the area.
The zones with a high recharge potential represented 30% (126.64 km2) of the study area and were located on the lower part of the debris cones. Some areas with equal potential were located in the middle and lower alluvial plain, and others were located toward the right bank of the Cauca River. The high potential of this area was due to the presence of 40% unconfined aquifers in 60% of the area. The percentage of unconfined aquifers decreased with respect to the areas characterized by a very high potential. For this area, the depth of the roof of the first permeable layer was even deeper, between 2.5 m and 10 m, in 75% of the area. The presence of a roof depth of less than 2.5 m decreased with respect to areas with a very high potential, reaching only 24% of the area. Regarding the lithological predominance of the USZ, the presence of sand-silts and intercalated sand, gravel and clay was found in 57% of this area.
Unlike the area with a very high potential, the most permeable strata only represented 29% of the area. The lithological predominance of the SZ corresponded to group G3, which corresponds to intercalated lenses of clay, sand and gravel in 56% of the area. The infiltration potential corresponded to hydrological group B in 80% of the area, but the presence of hydrological groups C and D was observed in 7% and 13% of the area, respectively.
Areas of moderate recharge potential were located over the entire alluvial plain and in the clay deposits toward the lower part of the study area, representing 40% of the total area (172.89 km2). In this area, the roof of the first permeable layer was further deepened and was greater than 5 m in 87% of the area. Regarding the lithology of the USZ, unlike the areas with very high and high potentials, the predominance of clay was observed in 52% of the area, and the predominance of silt and silt-clay was observed in 36% of the area. In contrast to this zone, the clay strata did not appear in the zone with a very high recharge potential. Regarding the lithological predominance of the SZ, it was characterized as group G3, which corresponds to intercalated lenses of clay, sand and gravel in 57% of the area, but a 43% less permeable stratum was classified in group G4. The infiltration potential corresponded to hydrological group B in 91% of the area; however, hydrological groups C and D were observed in 4% and 5% of the area, respectively.
The zones with a low potential represented 7% (29.43 km2) of the study area and are located mainly on the clay deposits of the lower part of the basins of the Bolo, Párraga and Fraile Rivers. In this area, the deepest roofs of the entire study area were found below 10 m in 66% of the area.
In the USZ lithology, clay predominated in 94% of the area lacking permeable strata. The lithological predominance of the SZ was characterized as group G4 and was present in 99% of the area, and group G3 only accounted for 1% of the area. Regarding the infiltration potential, hydrological group B predominated in 54% of the area. However, an increase in hydrological group D was observed, covering 43% of the area, and hydrological group C only corresponded to 3% of the area. Table 7 shows the indicators that predominated in each PRZ.
Table 7 Summary of the predominant indicators associated with each PRZ
| PRZ | Percentage with respect to the PRZ | ||||
|---|---|---|---|---|---|
| I1 | I2 | I3 | I4 | I5 | |
| Very high 97.05 km2 | 63.6% < 2.5 m | 95.6% Sand, gravel and/or boulders | 84.1% G1 | 97.2% Unconfined | 83.4% GH: B |
| High 126.64 km2 | 41.07% 2.5 - 5.0 m | 57.3% Sandy silt and intercalated sand, gravel and clay | 56.3% G3 | 59.6% Covered unconfined | 79.9% GH: B |
| Moderate 172.89 km2 | 54.1% 5.0 - 10 m | 51.8% Clay | 57.4% G3 | 51.3% Semiconfined | 90.4% GH: B |
| Low 29.43 km2 | 65.6% > 10 m | 94.3% Clay | 99.9% G4 | 99.1% Semiconfined | 53.9% GH: B |
Source: own elaboration
3.3. Validation of the PRZ index based on the hydraulic gradient
Regarding validation, it was observed through piezometry that the direction of the underground flow goes from the upper part of the Bolo, Aguaclara, Vilela and Párraga rivers to the Cauca River (east-west direction) (Figure 5a). For the entire study area, the hydraulic gradients showed a descending vertical behavior along the direction of flow, from the 1115 m piezometric line to the 945 m piezometric line. According to Freeze and Cherry 8, According to the authors, the high areas are recharge areas and the low areas are discharge areas. However, Scanlon et al. stated that the above is true in humid regions. For arid alluvial valleys, recharge usually occurs in low topographies; this condition being similar to the study area of this research.A visual analysis of the piezometry in the upper part of the debris cones revealed the shortest distance between the isopleths with the maximum hydraulic gradient for the study area of between 2% and 3%; consequently, the flow rate was higher here.
This behavior coincided with the zones characterized by very high and high potentiality (Figure 5a). In contrast, for the isopleths located farther away from the Cauca River, the distance between the piezometric lines increased, which was reflected in a decreased hydraulic gradient that reached values below 0.3%; the flow velocity was therefore lower. This behavior coincided with the zones characterized by moderate and low recharge potentials (Figure 5a).
The relationship between the estimated hydraulic gradient and its spatial distribution and the PRZ results is presented in Figure 5b. For the areas characterized by a very high recharge potential, 71% of the area had gradients greater than 1% (68.94 km2). In this same gradient range, the zones characterized by a high potential accounted for 18% of the area (22.68 km2) and 1% of the area (1.07 km2) corresponded to zones with a moderate potential.
Source: own elaboration
Figure 5 Validation of PRZs. (a) Relationship between the estimated PRZ and the piezometry. (b) Relationship between the estimated PRZ and the hydraulic gradient.
For low recharge potential areas, the representativeness, in this hydraulic gradient range as a function of area, was zero. According to the above results, a direct relationship between hydraulic gradients greater than 1% and the presence of areas with high and very high recharge potentials was observed.
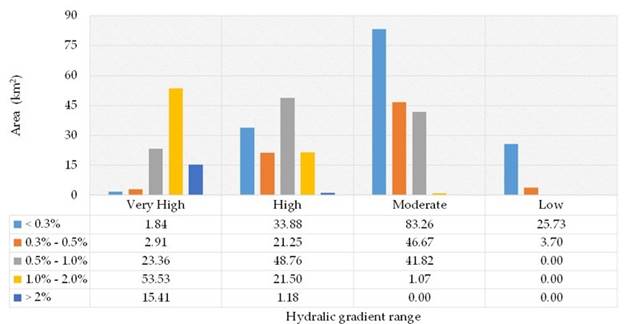
Regarding the higher representativeness of areas based on the range of hydraulic gradients, the pattern of recharge potential in the study area presented in Figure 6 is as follows: very high areas accounted for 55% of the area (53.53 km2) with a gradient range between 1% and 2%; high zones accounted for 39% of the area (48.76 km2) with a gradient range between 0.5% and 1%; moderate zones accounted for 48% of the area (83.26 km2) with a gradient range of less than 0.3%; and low zones accounted for 87% of the area (25.73 km2) with a gradient range of less than 0.3%.
Source: own elaboration
Figure 6 Distribution of estimated recharge zones by area and by type of PRZ.
Regarding the lower representativeness of areas based on the range of hydraulic gradients, the pattern of recharge potential was as follows: areas with a very high potential accounted for 2% (1.84 km2) with a gradient range of less than 3%; areas with a high potential accounted for 1% (1.18 km2) with a gradient range greater than 2%; and areas with moderate and low potentials had no representativeness for gradients greater than 1%.
Based on a trend analysis (Table 8), it was validated that the categories classified as very high and low potentials have a defined behavior as a function of the hydraulic gradient. For the first case, there was a greater probability of finding areas with a very high recharge potential as the hydraulic gradient increased (directly proportional).
Table 8 Trend analysis of the behavior of the PRZs in relation to the hydraulic gradient range.
| Potencial Recharge Zones (PRZs) | PRZs percent in the hydraulic gradient range | Trend | ||||
|---|---|---|---|---|---|---|
| < 0.3% | 0.3% - 0.5% | 0.5% - 1.0% | 1.0% - 2.0% | > 2% | ||
| Very high | 1,3% | 3,9% | 20,5% | 70,3% | 92,9% |

|
| High | 23,4% | 28,5% | 42,8% | 28,2% | 7,1% |

|
| Moderate | 57,5% | 62,6% | 36,7% | 1,4% | 0,0% |

|
| Low | 17,8% | 5,0% | 0,0% | 0,0% | 0,0% |

|
| Total | 100% | 100% | 100% | 100% | 100% | |
Source: own elaboration
There was a 70% probability of finding areas with a very high recharge potential when the hydraulic gradient was greater than 1%. The probability increased to 93% when the hydraulic gradient was greater than 2%. For the second case, there was a lower probability of finding areas with a low recharge potential as the hydraulic gradient increase (inversely proportional). For the study area, the probability of occurrence of a cataloged area with a low potential was zero for gradients greater than 0.5%; gradients between 0.3% and 0.5% only reached 5% probability; and for gradients lower than 0.3%, the probability of occurrence was 18% (Table 8).
From the same trend analysis (Table 8) and based on the ranges of the hydraulic gradient, the results obtained for the study area show that there is a probability of occurrence of 100% to delimit an area with a high to very high potential of reload when the hydraulic gradient is greater than 2%; the probability is 98.5% for a gradient range between 1% to 2% and 63.3% for a gradient range between 0.5% to 1% (Table 8). Based on these results, a proportional relationship was observed between the hydraulic gradient and the categorization of the recharge potential. The delimitation of recharge zones with a low to moderate potential was observed for hydraulic gradients below 0.5% with a probability of occurrence of 67.6%; for gradients of less than 0.3%, the probability was 75.3%.
For a moderate to high potential, inflection occurred in the hydraulic gradient between 0.5% and 1% because a higher probability of occurrence in gradients greater than 1% were characterized as recharge areas with a high to very high potential. For areas with hydraulic gradients of less than 0.5%, there was a trend toward a moderate potential, and the lower limits of the ranges corresponded to 62.6% for gradients between 0.3% to 0.5% and 57.5% for gradients of less than 3%. Additionally, it was observed that for gradients greater than 1%, the probability of occurrence of areas with a moderate recharge potential was less than 1.4%.
4. Discussion
In the construction of the PRZ index, the process of recharging aquifers was addressed in a simplified way by only taking into account the physical (or intrinsic) properties in the different layers through which water must travel to recharge an alluvial aquifer. Unlike other studies 2,5,10,12-14,28,35,36,38,45,78,80,85,86, this study suppressed factors external to the soil infiltration process, which can be altered by anthropogenic actions, such as land use and soil management practices, or by climatic variations and changes that affect the magnitude of the recharge but not the potential of an aquifer to be recharged. This contributes to ensuring the sustainability of ecosystems that depend on the dynamics of recharge zones. In this sense, the PRZ index was developed as a prevention tool, and it is an instrument for environmental and land use planning.
The index proposed in this study was conceptualized as an additive type of index (equal weights for all factors) and considered only the restrictions imposed by the natural environment for the recharge process. The main advantage of the proposed PRZ index is that it limits the subjectivity associated with weighted indexes, for which the assignment of weights to multiple factors by decisionmakers, panels of experts or a particular methodology can lead to different results 25.
At the end of 2019, the IDEAM 28 presented a methodological proposal for the delimitation of PRZs at the national scale based on the development of a weighted index, which involved 5 factors: fracture density, slope, lithology, texture, coverage and land use. Unlike the PRZ index, the methodology formulated by IDEAM 28 includes parameters external to the aquifer system. These parameters can present anthropogenic interventions that do not modify the intrinsic potential of an evaluated area although they do modify the magnitude of the recharge. When the fracture density is considered, the methodology presented by IDEAM 28 limits the analysis to intermontane alluvial aquifers, such as the alluvial aquifer of the Cauca River considered in this study, and takes into account the fault system underlying the alluvial sediments, which can be very thick.
Additionally, although both indices worked with the lithology factor, the IDEAM methodology 28 only infers the porosity (primary or secondary) of the lithological predominance per chronostratigraphic unit of the geological map of Colombia. In the proposed PRZ index, the lithology is considered in greater detail because with this parameter, the lithological predominance is evaluated as a function of the textural classes in the UZs and SZs based on the records of deep wells.
In contrast, just as the hydrographic basin is considered as the unit of analysis for integrated water resources management, in this research, a hydrogeological area was considered as the unit of analysis for the definition of a PRZ. Hydrogeological areas include surface basins and regions based on geology that represent the physical environment in which the dynamics of the hydrological cycle in its underground component are developed, according to the capacity of rocks and strata to store and transmit water 87. A hydrogeological zone responds to the geological model of the subsoil and recognizes the geometry and tectonostratigraphic boundaries of the aquifer units 87. Different studies 2,5,10,12-14,28,35,36,38,45,78,80,85,86 have delimited recharge zones; however, the analysis units in these studies do not follow hydrogeological zones. The delimitation of the potential zones was made based on geographic and political-administrative limits or at the level of hydrographic basins. Additionally, the recharge zones defined in these studies were not validated. Unlike this research, a validation was performed with the hydraulic gradient by plotting the piezometric surface, which is characterized by positive hydraulic potential values and divergent flow 27.
The hydrogeological zone of the Bolo River already had zones delimited by the CVC 6 based on local expert knowledge of the surface geology and flow system. The zones defined at that time were delimited for management purposes and included three types of zones (recharge, transition and discharge). The difference between the zones defined by the CVC 6 and those determined in this research, is based on the baseline information scale used to estimate the zones, and the GIS methods used for analysis. The results of the CVC 6 and those presented in this study agree in terms of the location of the areas with the greatest recharge potential, which are located above the debris cones, where the hydraulic gradients are greater than 1%.
5. Conclusions
A methodological tool was developed for the delimitation of PRZs in alluvial aquifers through the design of the additive PRZ index based on five characterization indicators that only included intrinsic parameters of the aquifer that were mutually exclusive. The index can be used to characterize a territory into four categories of recharge potential. This index is considered a methodological contribution and a tool for land use planning that involves recharge zones as a central axis in environmental management. The main advantage of the designed index is not to depend on a weight system (anthropic factor), which can vary the potential of a recharge zone. In addition, the designed methodology is flexible to be applied to other contexts. The modeler can add or remove criteria and indicators according to the type of aquifer to be evaluated. However, the current application of the designed index only allows evaluating alluvial aquifers in intermountain valleys.
Through the implementation of the proposed PRZ index, a conceptual model was constructed for delimiting the PRZs in the hydrogeological zone surrounding the Bolo River, Colombia, where it was observed that 53% of the recharge potential was characterized as high to very high and 41% was characterized as a moderate potential. This is due to a combination of physical factors such as the depth of the first permeable layer, the lithology, the degree of confinement and the infiltration potential. In this sense, the study area can be considered to be an area of strategic importance.
Validation of the PRZs in the hydrogeological area surrounding the Bolo River was performed. Seventy-one percent of the areas with a very high recharge potential showed hydraulic gradients greater than 1%. In areas with hydraulic gradients greater than 1%, there was a 98% probability of finding areas characterized by a high to very high recharge potential. There was a proportional relationship between the gradient, its magnitude and the potential of the aquifer recharge zones in the context evaluated. This validation can be referenced when zoning PRZs in regions with characteristics similar to those of the study area.

