Services on Demand
Journal
Article
Indicators
-
 Cited by SciELO
 -
 Access statistics
Related links
-
 Cited by Google
 -
 Similars in
SciELO
 -
 Similars in Google
Share
DYNA
Print version ISSN 0012-7353
Dyna rev.fac.nac.minas vol.83 no.195 Medellín Jan./Feb. 2016
https://doi.org/10.15446/dyna.v83n195.44293
DOI: http://dx.doi.org/10.15446/dyna.v83n195.44293
Optimal estimating the project completion time and diagnosing the fault in the project
Estimación optima de terminación el tiempo del proyecto y diagnóstico de la falla en el proyecto
M. T. Hajali-Mohamad a, M. R. Mosavi b & K. Shahanaghi c
a Facultad de Ingeniería Industerial, Irán Universidad de Ciencia y Tecnología, Irán. hajialinajar@iust.ac.ir.
b Facultad de Ingeniería Eléctrica, Irán Universidad de Ciencia y Tecnología, Irán. m_mosavi@iust.ac.ir
c Facultad de Ingeniería Industerial, Irán Universidad de Ciencia y Tecnología, Irán. shahanaghi@iust.ac.ir.
Received: July 5th, 2014. Received in revised form: December 10th, 2015. Accepted: January 10th, 2016
This work is licensed under a Creative Commons Attribution-NonCommercial-NoDerivatives 4.0 International License.

Abstract
The main objective of the project management team is to implement the project taking into consideration the Budget, schedule and constraints. In addition, project accomplishment, especially with large projects, requires the project to be correctly envisaged. Earned value (EV) management is a valuable technique for analyzing and controlling the performance of the project and predicting the total cost before its completion. Thus, fuzzy systems such as Adaptive Network based on the Fuzzy Inference System (ANFIS) and Parallel Structure based on the Fuzzy System (PSFS) are used to predict the project completion time. In this paper, the plan value diagram is used to predict the earn value diagram using three methods. These three methods are based on the PSFS and Neural Networks (NNs), which help with the implementation of the projects in organizations. The results of these three methods decreased the prediction error of the EV diagram by up to 2%.
Keywords: Earned Value, Plan Value, ANFIS, PSFS, Neural Network.
Resumen
El objetivo principal del equipo de gestión del proyecto es poner en práctica el proyecto con respecto al presupuesto, horario y cubrir las limitaciones del proyecto. Además, la realización del proyecto (especialmente los grandes proyectos,) requiere la predicción adecuada del proyecto. Gestión del valor ganado es una técnica valiosa para el análisis y control de la ejecución del proyecto y predice el costo total del proyecto antes de la finalización del proyecto. Por lo tanto, Fuzzy sistemas tales como la Red de adaptación basada en Fuzzy sistema de inferencia (ANFIS) y Estructura paralela basada en el Fuzzy Sistema (PSFS) se utilizan para predecir el tiempo de finalización del proyecto. En éste artículo, el diagrama de valor del plan se utiliza para predecir el diagrama valor en tres métodos. Estos tres métodos se basan en los PSFS y Redes Neuronales que son capaces de ser poner en práctica los proyectos en las organizaciones. Los resultados de estos tres métodos disminuyeron el error de predicción del valor obtenido diagrama de hasta 2%.
Palabras clave: Valor Ganado, Valor del Plan, ANFIS, PSFS, NN.
1. Introduction
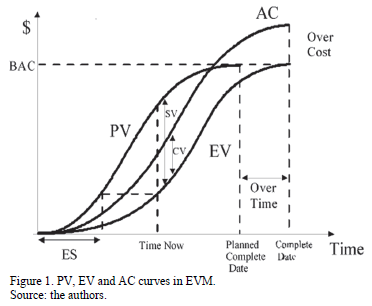
Earned Value Management (EVM) is a project management technique used to measure project progress in an objective manner. It is a technique used to control and manage projects by combining dynamic project data and expressing it usefully, highlighting risks and measuring the project [1]. The EVM method provides early indications of project performance to highlight the need for eventual corrective actions [2]. Nowadays, implementing Earned Value (EV) techniques has many benefits and would enhance the project's cost and scheduled performances. However, the research on the EV is very restricted. Fig. 1 shows Plan Value (PV), EV and AC curves in EVM.
There are two basic approaches in the literature: model-based and statistical methods to solve the EVM problem. The model-based approach is based on the assumption that there is enough prior information to build an accurate model.
Naeni et al. developed a new fuzzy EV model which had the advantage of developing and analyzing the EV indices, as well as the time and the cost estimates when there is uncertainty [3]. The developed model is very useful in evaluating the progress of a project where uncertainty arises. Vandevoorde and Vanhoucke concluded that the most reliable method for estimating time at completion is the Earned Schedule (ES) method [4].
They were the first authors who widely compared the three time prediction methods and tested them with a simple one activity project and a real life data set. A reliable forecasting method of the final cost and duration is proposed by Lipke et al. to improve the capability of project managers for making informed decisions. They use data from 12 real life projects to improve the capability of project managers to be able to make informed decisions by providing a reliable forecasting method of the final cost and duration. Hunter et al. focused on the implementation of EVMS on the Radiation Belt Storm Probes (RBSP) project, explained EV processes and the implementation's cost and analyzed the benefits of EVMS to provide insight into cost/benefit considerations for other projects regarding EVMS implementation [5]. Acebes et al. proposed an innovative and simple graphical framework for project control and monitoring in order to integrate the dimensions of project cost and schedule with risk management, thus extending the EV methodology [6]. They build a graphical methodology to know when a project remains "out of control" or "within expected variability" during the project lifecycle. With this aim, they defined and represented new control indexes and new cumulative buffers. Cioffi presented a new notation for the EV analysis to make EV mathematics more transparent and flexible [7].
Plaza and Turetken present a spreadsheet-based decision support tool that automates the calculations and analyses in EVM/LC [8]. Von Wangenheim presents an educational board game to reinforce and teach the application of EVM concepts in the context of undergraduate computing programs, complementing expository lessons on EVM basics [9]. The game has been developed based on project management fundamentals and teaching experience in this area. The results point out a very positive effect of the game on social interaction, engagement, immersion, attention and relevance to the course objectives. The objective of Elshaer's paper is twofold: the first being to study the impact of the activities' sensitivity information on the forecasting accuracy of the ESM method [10]. The second is to test the claim that in normal conditions the project performance indicator provided by ESM at higher work breakdown structure is reliable. Vanhoucke presents two project tracking methods to address project problems [11]. In this paper, a bottom-up and a top-down project tracking approach within a corrective action framework is applied to a large and diverse set of fictitious projects which are subject to Monte-Carlo simulations to simulate fictitious project progress under uncertainty. Maravas and Pantouvakis proposed a new method to calculate project cash flows, in which the cost and duration of each activity are understood as fuzzy numbers [12]. Yao et al. present a fuzzy, stochastic, single-period model for cash management to provide financial decision makers with more insight into real cash management problems [13]. Mortaji et al. developed an efficient approach to calculate Estimate At Completion (EAC) [14]. Artificial Intelligence (AI) methods are used in different fields and have attracted much attention [15-17]. Cheng et al. employed AI approaches including fuzzy logic, K-means clustering, a genetic algorithm, and Neural Networks (NNs) to gain strategic control over project cash flows [18]. The evolutionary fuzzy support vector machine inference model for time series data as an alternative approach is presented by Cheng and Roy to predict cash flow [19]. Warburton proposes a formal method to include time dependence into EV management [20]. The model requires three parameters: the reject rate of activities, the cost overrun parameter, and the time to repair the rejected activities. The model is built on the well-established Putnam-Norden-Rayleigh (PNR) labor rate profile, which is a useful representation for large software projects.
Statistical approaches try to analyze series of observations that are obtained by the system and then they predict the future behavior. Many recent prediction theories have been developed based on statistical approaches due to the complexity of building an accurate model. However, intelligent systems such as NNs and fuzzy or a hybrid methods like Adaptive Network based on Fuzzy Inference System (ANFIS) have relatively large errors and cannot be applied to real projects [21,22]. The fuzzy systems can easily address uncertainties that exist in the complex physical systems behavior. Adaptive learning algorithms can generate fuzzy rules to predict chaotic time series when knowledge about the system and the input-output format of the numeric data is available [23]. Time series estimating based on Parallel Structure based on Fuzzy System (PSFS) is one of the methods used for this purpose [24]. PSFS consists of a number of parallel fuzzy systems. Each fuzzy system estimates the future value of the signal based on older signals with different time samples. PSFS considers the final estimation value based on the average output of each fuzzy system, except the minimum and maximum values [25].
A continuous increase in the complexity, efficiency, and reliability of modern industrial systems necessitates continuous development in the control and fault diagnosis theory and practice. This is associated with the increasing demands for higher system performance and product quality on one side and more cost efficiency on the other. The complexity and the automation degree of technical processes are also continuously growing. This development calls for more system safety and reliability. Today, one of the most critical issues surrounding the design of automatic systems is system reliability and dependability [26]. A traditional way to improve the system reliability and dependability is to enhance the quality, reliability and robustness of individual system components like sensors, actuators, controllers and computers. Even so, a fault-free system operation cannot be guaranteed. Process monitoring and fault diagnosis are therefore becoming an essential ingredient in a modern automatic control system [27]. The overall concept of fault diagnosis consists of the following three essential tasks: Fault detection: detection of the occurrence of faults in the functional units of the process. These lead to undesired or intolerable behavior of the whole system. Fault isolation: fault diagnosis system outputs are also alarm signals that indicate the occurrence of the faults or classified alarm signals that show which fault has occurred. The additionally provide information about the type or magnitude of the fault that has occurred [26,27].
In this paper, the plan value diagram is used to predict the earn value diagram using three methods. These three methods are based on the PSFS and NNs, which implement projects in organizations. The results of these three methods decreased the predicted error of the EV diagram by up to 2%.
This paper is organized as follows: In section 2, the structure of the new PSFS is presented. Section 3 shows the simulation. The NNs models are illustrated in section 4. A comparison of these techniques will be expressed and presented in section 5. Finally, in section 6, conclusions are made.
2. Proposed parallel structure based on fuzzy systems
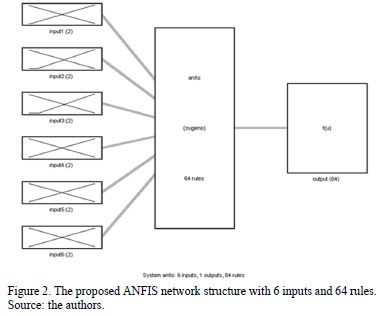
PSFS is made by some fuzzy systems that have parallel connection and it is used for predicting time series. As shown in Fig. 2, the fuzzy system used in PSFS is ANFIS network, which includes 6 inputs, 1 output and 64 rules.
PSFS wants to predict the  , this is the data value in time step (k+r). P-th fuzzy system has an output
  that is based on previous data
  ,
,
,
, . PSFS can calculate the value of
  based on different outputs of fuzzy systems
 ,
, ,
,
,
, . PSFS calculated the final value of
  by averaging the measurements between all fuzzy system outputs except maximum and minimum values. This value is shown in eq. (1).

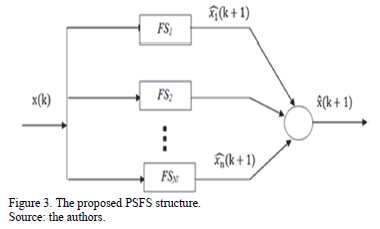
The proposed PSFS is composed of multiple parallel fuzzy subsystems, which are used for time series [28]. Fig. 3
shows the proposed PSFS. The PSFS consists of the N parallel fuzzy subsystems FS1, FS2... FSN. Each fuzzy system for a specific time with index k+1 predicts a value for the time series. The PSFS consequence predicts the end value  , in terms of the particular decision making.
In the previous PSFS structures, the average outputs of the fuzzy networks are considered as outputs that eliminate the maximum and minimum in each algorithm. Eliminating values will lead to missing information when the outputs of fuzzy networks are close to each other. By comparing the network output variance, the decision will be made to eliminate, or not, the extreme values in the proposed algorithm.
Firstly, the new algorithm is calculated based on output variance of a fuzzy network  , and also the standard deviation represented by s;T. After that maximum output is calculated
  , then it is removed from the list of data. The new variance is calculated by N-1 of the remaining samples and represented by smax. If sT>Ksmax, then data is sparse, so maximum a value must be removed by the previous algorithm; otherwise, the maximum value is set to zero. This process is also applied to minimum output. In the simulation step the K value is set to three.
3. Simulation
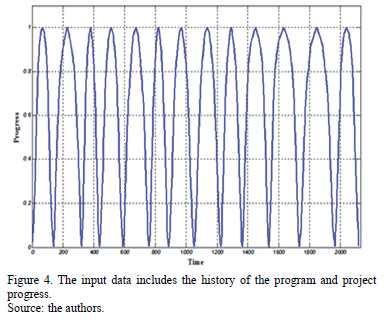
To facilitate network training and to prevent its divergence (discontinuity points), this paper undertakes an innovation. The input data includes the plan history and the project operation, as shown in Fig. 4. In this figure, the first half of the bell is considered as the plan, and the second half shows the activity operation.
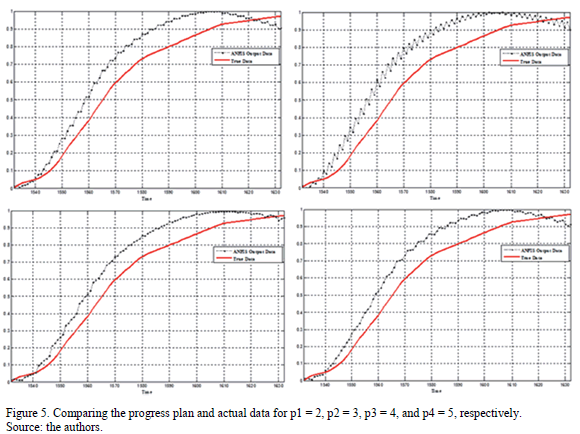
1400 pieces of data are used to train the ANFIS network. Using these data, four ANFIS networks are trained with steps P1=2, P2=3, P3=4,and P4=5. Then, to test the trained networks with 200 further pieces of data, (3*P+1) of the train data are used to generate the PSFS outputs. Finally, the generated data is compared to the original signal. The dataset (j303_10) that was generated by ProGen for RCPSP Kolisch and Hartmann is used in this paper [29]. A developed program was used in [30] by using VBA-MSP tools in Microsoft Project in order to generate periodical data.
It can be assumed that the operation plan is implemented until time 30 in order for a fault to be detected. To diagnose the fault, the absolute value of the error curve of the PSFS network should be measured with the curve output of the plan value at time E1. Also, the absolute value of the project output curve should be calculated by the plan value curve at time E2. By comparing these two values an error in the system can be addressed. Fig. 5 shows the progress plan and actual data for p1 = 2, p2 = 3, p3 = 4 and p4 = 5, respectively.
4. Neural network-based method
The NN has many applications, estimation being one of them. By using the NN in estimation, the subsequent data will be estimated, and a set of data with a good accuracy will be used [31]. Assume that N projects have been undertaken by a company, and the PV and EV diagrams of these projects are available. The purpose is now to estimate the EV diagram of the project N+1thusing its PV diagram. There are two methods of doing this: the future state method, and by using previous data.
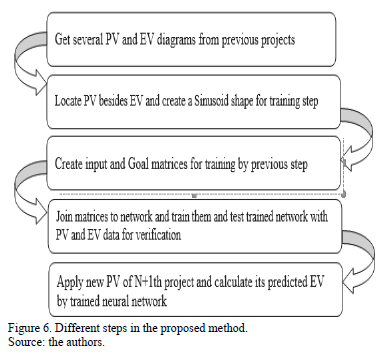
In the prediction problems with NNs, the future state prediction of a system is based on its previous state [31]. Since high precision and speed have a priority, different methods exist to implement networks that are similar to each other. Fig. 6 shows the proposed structure:
4.1. The first method simulation
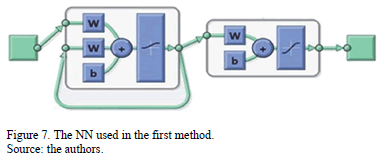
The NN used in this project to predict the next state of the recurrent network is a two-layer NN structure that is shown in Fig. 7.
Also, the input data and the objective functions in the network can be selected below, if X indicates data:

When using previous data, the main issue is to train the NN with available historical data that it needs to use for new data. In this method, the PV graphs appear sequentially and are defined as NN inputs. Also, this is what happened for EV graphs, and they were defined as objective NN functions. There are two sine graphs in Fig. 4; one of is the input and the other (EV graph) is the objective function.
4.2. The second method simulation
In this method, the network is trained with 1400 pieces of data from PV and EV graphs and is then tested with another 800 pieces of data from them. The various NNs are used to train data; the best of them is chosen based on the error calculation measurements, (Root Mean Square (RMS) or Mean Squared Error (MSE)). It should be noted that the number of hidden layers and neurons in each of the networks is the same. According to the measurements taken and the relative uniformity of data, Radial Basis Function Neural Network (RBF NN) is the best network for aforesaid data.
5. Results
After collecting the required information from the organization and implementing the algorithm, the following results in three strategies' different sub-sections have been obtained.
5.1. PSFS results
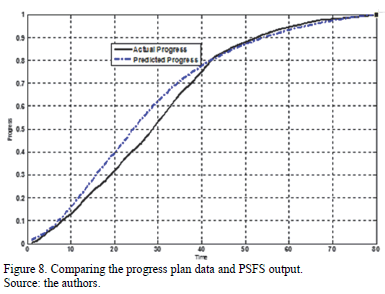
Fig. 8 is drawn for the P = 5 step and ANFIS network. The actual and estimated EV is also shown in this figure.
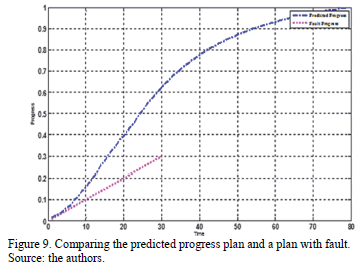
Using the network described in section 2, the PSFS system is built. The E1=1.6373 and E2 = 2.6978 are obtained in Fig. 9. It can be demonstrated that an error has occurred in the system due to the fact that E2> E1.
5.2. Results of the future state prediction based on neural network
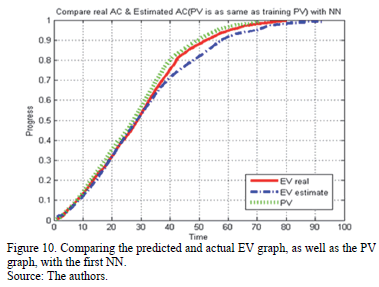
The recurrent NNs were applied to the data listed in section 4.1 and the result is shown in Fig. 10.
5.3. Results of the previous data based on neural network
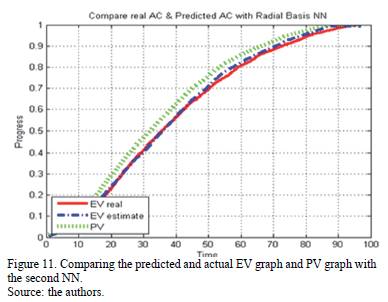
The RBF NN was applied to the data listed in section 4.2 and the result is shown in Fig. 11.
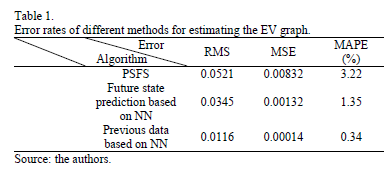
The fault detection in the NNs, in its best state (ANN Method II) is E1=0.02, whereas E2=2.69. This means that the second NN method is more accurate in detecting faults. The results are summarized in Table 1.
6. Conclusion
As is clear from the above results, the proposed algorithms are able to reduce the estimation error by up to 2 percent. However, in many cases, the maximum amount of the estimation error reduction is equivalent to 42 percent. In this paper, we developed new algorithms to estimate the EV graphs based on PSFS and NN. Also, the proposed algorithms effectively estimate the EV graphs and diagnose the fault with high accuracy. It must be mentioned that the first NN was introduced for the real data (non-uniform) because of its good performance.
References
[1] Kerzner, H., Project management case studies, Wiley, 2012. [ Links ]
[2] Fleming, Q.W. and Koppelman, J.M., Earned value project management, Project Management Institute, 2010. [ Links ]
[3] Naeni, L.M., Shadrokh, S. and Salehipour, A., A fuzzy approach for the earned value management. International Journal of Project Management, 29(6), pp. 764-772, 2011. DOI: 10.1016/j.ijproman.2010.07.012. [ Links ]
[4] Vandevoorde, S. and Vanhoucke, M., A comparison of different project duration forecasting methods using earned value metrics. International Journal of Project Management, 24(4), pp. 289-302, 2006. DOI: 10.1016/j.ijproman.2005.10.004. [ Links ]
[5] Lipke, W., Zwikael, O., Henderson, K. and Anbari, F., Prediction of project outcome: the application of statistical methods to earned value management and earned schedule performance indexes. International Journal of Project Management, 27(4), pp. 400-407, 2009. DOI: 10.1016/j.ijproman.2008.02.009. [ Links ]
[6] Acebes, F., Pajares, J., Galán, J.M. and López-Paredes, A., Beyond earned value management: A graphical framework for integrated cost, schedule and risk monitoring. Procedia-Social and Behavioral Sciences, 74, pp. 231-239, 2013. DOI: 10.1016/J.SBSPRO.2013.03.027. [ Links ]
[7] Cioffi, D.F., Designing project management: A scientific notation and an improved formalism for earned value calculations. International Journal of Project Management, 24(2), pp. 136-144, 2006. DOI: 10.1016/j.ijproman.2005.07.003. [ Links ]
[8] Plaza, M. and Turetken, O., A model-based DSS for integrating the impact of learning in project control. Decision Support Systems, 47(4), pp. 488-499, 2009. DOI: 10.1016/j.dss.2009.04.010. [ Links ]
[9] Von Wangenheim, C.G., Savi, R. and Borgatto, A.F., DELIVER! - An educational game for teaching earned value management in computing courses. Information and Software Technology, 54(3), pp. 286-298, 2012. DOI: 10.1016/j.infsof.2011.10.005. [ Links ]
[10] Elshaer, R., Impact of sensitivity information on the prediction of project's duration using earned schedule method. International Journal of Project Management, 31(4), pp. 579-588, 2013. DOI: 10.1016/j.ijproman.2012.10.006. [ Links ]
[11] Vanhoucke, M., On the dynamic use of project performance and schedule risk information during projecttracking. Omega, 39(4), pp. 416-426, 2011. DOI: 10.1016/j.omega.2010.09.006. [ Links ]
[12] Maravas, A. and Pantouvakis, J.-P., Project cash flow analysis in the presence of uncertainty in activity duration and cost. International Journal of Project Management, 30(3), pp. 374-384, 2012. DOI: 10.1016/j.ijproman.2011.08.005. [ Links ]
[13] Yao, J.-S., Chen, M.-S. and Lu, H.-F., A fuzzy stochastic single-period model for cash management. European Journal of Operational Research, 170(1), pp. 72-90, 2006. DOI: 10.1016/j.ejor.2004.06.017. [ Links ]
[14] Mortaji, S.T.H., Bagherpour, M. and Noori, S., Fuzzy earned value management using L-R fuzzy numbers. Journal of Intelligent and Fuzzy Systems, 24(2), pp. 323-332, 2013. DOI: 10.3233/IFS-2012-0556. [ Links ]
[15] Quiroga, J., Cartes, D. and Edrington, C., Neural network based system identification of a PMSM under load fluctuation. DYNA, 76(160), pp. 273-282, 2009. [ Links ]
[16] Pérez-Salazar, M.D.R., Mateo-Díaz, N.F., García-Rodríguez, R., Mar-Orozco, C.E. and Cruz-Rivero, L., A genetic algorithm to solve a three-echelon capacitated location problem for a distribution center within a solid waste management system in the northern region of Veracruz, Mexico. DYNA, 82(191), pp. 51-57, 2015. DOI: 10.15446/dyna.v82n191.51146. [ Links ]
[17] Agudelo, L., López-Lezama, J.M. and Galeano, N.M., Vulnerability assessment of power systems to intentional attacks using a specialized genetic algorithm. DYNA, 82(192), pp. 78-84, 2015. DOI: 10.15446/DYNA.V82N192.48578. [ Links ]
[18] Cheng, M.-Y., Tsai, H.-C. and Liu, C.-L., Artificial intelligence approaches to achieve strategic control over project cash flows. Automation in Construction, 18(4): pp. 386-393, 2009. DOI: 10.1016/j.autcon.2008.10.005. [ Links ]
[19] Cheng, M.-Y. and Roy, A.F., Evolutionary fuzzy decision model for cash flow prediction using time-dependent support vector machines. International Journal of Project Management, 29(1), pp. 56-65, 2011. DOI: 10.1016/j.ijproman.2010.01.004. [ Links ]
[20] Warburton, R.D., A time-dependent earned value model for software projects. International Journal of Project Management, 29(8), pp. 1082-1090, 2011. DOI: 10.1016/j.ijproman.2011.02.008. [ Links ]
[21] Jang, J.-S., ANFIS: Adaptive-network-based fuzzy inference system. IEEE Transactions on Systems, Man and Cybernetics, 23(3), pp. 665-685, 1993. DOI: 10.1109/21.256541. [ Links ]
[22] Iranmanesh, S.H., Mirseraji, G.H. and Shahmiri, S., An emotional learning based fuzzy inference system for improvement of the completion time of projects estimation Computers & Industrial Engineering, 2009. CIE 2009. International Conference on, pp. 470-475, 2009. DOI: 10.1109/ICCIE.2009.5223748 [ Links ]
[23] Abarbanel, H.D., Brown, R., Sidorowich, J.J. and Tsimring, L.S., The analysis of observed chaotic data in physical systems. Reviews of Modern Physics, 65(4), pp. 1331, 1993. DOI: 10.1103/REVMODPHYS.65.1331. [ Links ]
[24] Jiang, J., Chen, J. and Qu, L., The application of correlation dimension in gearbox condition monitoring. Journal of Sound and Vibration, 223(4), pp. 529-541, 1999. DOI: 10.1006/jsvi.1998.2161. [ Links ]
[25] Kim, M.S. and Kong, S.G., Time series prediction using the parallel-structure fuzzy system. In Fuzzy Systems Conference Proceedings, 1999. FUZZ-IEEE'99, 1999. pp. 934-938. [ Links ]
[26] Ding, S., Model-based fault diagnosis techniques: Design schemes, algorithms and tools, Springer, 2013. DOI: 10.1007/978-1-4471-4799-2. [ Links ]
[27] Witczak, M., Modelling and estimation strategies for fault diagnosis of non-linear systems: from analytical to soft computing approaches, Springer, 2007. [ Links ]
[28] Kim, M., Lee, H., You, C. and Chung, C., Chaotic time series prediction using PSFS2. Proceedings of the 41st SICE Annual Conference, 2002. pp. 2358-2363. [ Links ]
[29] Kolisch, R. and Hartmann, S., Experimental investigation of heuristics for resource-constrained project scheduling: An update. European Journal of Operational Research, 174(1), pp. 23-37, 2006. DOI: 10.1016/j.ejor.2005.01.065. [ Links ]
[30] Iranmanesh, H., Mojir, N. and Kimiagari, S., A new formula to estimate at completion of a project's time to improve earned value management system. IEEE Conference on Industrial Engineering and Engineering Management, 2007. pp. 1014-1017. [ Links ]
[31] Mosavi, M.R., Comparing DGPS corrections prediction using neural network, fuzzy neural network and Kalman filter. Journal of GPS Solutions, 10(2), pp. 97-107, 2006. DOI: 10.1007/s10291-005-0011-7. [ Links ]
M.T. Hajali-Mohamad, received his BSc. and MSc. in Industrial Engineering at K. N. Toosi University of Technology, Tehran, Iran. He received his PhD. in Industrial Engineering in 2013, from the Iran University of Science and Technology (IUST), Tehran, Iran. His research interests include operations research, system dynamics, and EVM. ORCID: org/0000-0003-1054-6982
M.R. Mosavi, received his BSc., MSc. and PhD. degrees in Electrical Engineering in 1997, 1998, and 2004, respectively from Iran University of Technology (IUST), Tehran, Iran. He is currently a faculty member (full professor) of the Department of Electrical Engineering of IUST. He is the author of 230 scientific publications in journals and international conferences. His research interests include circuits and systems design. ORCID: org/0000-0002-2389-644x
K. Shahanaghi, is Assistant Professor (since 2004) at the school of Industrial Engineering, Iran University of Technology (IUST) where he lectures Simulation, Engineering Economy, and Uncertain Programming courses for Industrial Engineering postgraduate students. He received his BSc., MSc. and PhD. in Electrical Engineering at (IUST), Tehran, Iran in 2000. He has many papers in international journals and conferences. His research interests include Operations Research, Engineering Economy, Simulation, and Multicriteria Decision Making. ORCID: org/0000-0003-0947-0773


