


 English (pdf)
 Article in xml format
 Article references
 Send this article by e-mail
 Cited by SciELO
  Cited by Google
  Similars in
SciELO
Similars in
SciELO  Similars in Google
 Permalink
Introduction
Gyr is a Bos indicus breed widely used in the Colombian low tropic dairy production systems. Originally from India, it can be found in Brazil and other Latin American countries (Quiroz et al., 2015). This breed performs well in regions with high temperatures and features resistance to tropical diseases. Although in certain regions it has gained popularity as a dual-purpose breed, Colombian breeders have focused on milk production (Mellado et al., 2011). Thus, due to its ability to produce milk under the harsh conditions of low tropic ecosystems, Gyr germplasm can be found in several regions of Colombia and, consequently, it has a significant impact on Colombian low tropic dairy operations. Therefore, it is relevant to study the milk yield dynamics of this breed under Colombian conditions. In addition to the characterization of milk yield trajectory, estimating lactation curves allows to predict total yield and conduct analyses to identify individuals with outstanding phenotypic performance (Cañas et al., 2012). Moreover, lactation curves allow farmers to make management decisions. For example, designing nutritional plans and defining when cows should be dried off. It is worth mentioning that some of the most important production parameters derived from lactation curves are: total milk yield between two given time points-typically from the beginning of lactation to 305 days in milk (DIM)-, peak milk yield (PMY), DIM at PMY (DP), and persistence. These parameters allow breeders to make better management decisions (López et al., 2015).
During the last 10 years, the Asociación Colombiana de Criadores de Ganado Cebú (ASOCEBU) has been leading a milk control program which led to the creation of a dataset that permits to carry out the first analysis of milk yield dynamics of Gyr cattle in the country using records from several herds (ASOCEBU, n.d.).
Therefore, the objective of this study was to characterize milk production dynamics of Gyr cattle in the Colombian low tropic by fitting linear and nonlinear statistical models.
Materials and methods
Records
Data were collected by trained staff from ASOCEBU between 2008 and 2018 in 130 herds located in low tropic regions of Colombia. These herds were distributed in 65 municipalities from 22 Departments. In herds with two milkings per day, the two partial yields were recorded. After discarding records corresponding to more than 400 DIM and lactations with less than four records, the resulting dataset contained 13,798 records corresponding to 2,480 lactations from 1,510 cows. Parity ranged from 1 to 13. The distribution of records according to parity is shown in Figure 1.
Data analysis
Estimation of lactation Curves and associated parameters. Four statistical models (two linear and two nonlinear) were fitted to each individual lactation. The linear models were a second-order polynomial (Rawlings et al., 1998), and Wiltmink (Wiltmink, 1987), while the nonlinear models were Wood (Wood, 1967), and the Papajcsik and Bordero (PB) model (Papajcsik and Bordero, 1988). Model parameters were estimated using ordinary least squares for linear models, and non-linear least squares for non-linear models (Rawlings et al., 1998). Normal equations corresponding to non-linear models were minimized using the Gauss-Newton algorithm.
For each lactation, these models were compared using five criteria: mean square error (MSE) as defined in Tedeschi (2004), mean absolute error (MAE), mean square prediction error (MSEP), Bayesian information criterion (BIC; Schwarz, 1987), and Akaike’s information criterion (AIC; Akaike, 1973). Analla (1998) proposed the MSE as a criterion to compare statistical models based on the residuals of the linear regression of yi on yi, denoted as εi*, and it is computed as follows:
On the other hand, the MAE measures the average absolute difference between observed and predicted values (Tedeschi, 2004), that is,
The MSEP is computed as the average squared difference between observed and predicted values (Tedeschi, 2004).
Finally, the BIC and AIC are based on two components, one indicates goodness of fit and the other one can be thought of as a penalty for the number of parameters (AIC; Akaike, 1974) or the number of parameters and sample size (BIC):
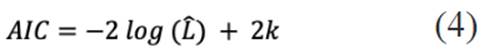
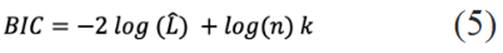
where L is the likelihood evaluated at the maximum likelihood estimator, i.e., the maximum value of the likelihood function, k is the number free parameters in the model and n is sample size. When using these criteria, models with smaller values are preferred.
The four models were fitted and the five criteria to compare these models were computed for each lactation. Subsequently, the majority criterion was used to select a model for each lactation; that is, the model selected by most criteria was the chosen one. For example, assuming that for a given lactation, MSE, MAE and MSEP preferred the Wood model, BIC suggests the Wiltmink model and AIC the quadratic model, then the Wood model would be selected.
Once the model that best fit the data from each lactation was selected, curves yielding negative predicted values at some point within the interval [5, 305] were discarded. The next step was checking the shape of the estimated lactation curve. This step was necessary to detect curves that did not have a typical shape; that is, curves that were convex (or concave upward), strictly increasing or changed from convex to concave in the set of positive reals; for example, those having a minimum and an inflection point.
Consequently, using estimated parameters from the selected model for each lactation, the shape of the corresponding function was evaluated utilizing results from calculus. Basically, these results led to find conditions on the signs of estimated parameters which permitted defining the shape of the function (Steward, 2008). The shape checking step can be summarized as follows. Shape of a differentiable function can be determined using basic results from calculus. For example, a concave function has a strictly decreasing first derivative, i.e., its second derivative is always negative. For Wood’s model, if β1 and β2 have the same sign, its systematic component corresponds to a function that has a stationary point in the set of positive real numbers; therefore, the limit when the independent variable tends to zero from the right permits to determine whether the function has a typical shape or not.
This analysis reveals that if β 1 is negative, the function is atypical; this result also applies when β 2 is positive. Moreover, when β 1 is positive and β 2 is negative, the function is strictly increasing; that is, it shows an atypical shape. On the other hand, for Papajcsik & Bordero’s model, if β 1 is positive the function has a saddle point at 2/β1 and a global maximum is located at 1/β1; consequently, it shows a typical shape. If β 1 is negative the function has a global minimum in the set of negative real numbers and is strictly increasing in the set of positive real numbers; therefore, in this case Papajcsik & Bordero’s model is not useful for modelling milk production. Moreover, the systematic components of the two linear models correspond to functions without saddle points; hence, they are concave or convex in their entire domain; if β 2 is negative, the functions are concave. For Wiltmink’s model, it is easy to show that if β1> 0 and β2< 0, the function is strictly increasing; thus, it is not useful for modelling milk yield and corresponds to an atypical curve.
In the following step the four production parameters of interest were computed for typical (concave, having a shape change from concave to convex in the set of positive real numbers or strictly decreasing) estimated lactation curves. The PMY corresponds to the maximum of the lactation function, while DP is the corresponding maximum argument or argmax, the point in the function’s domain where it is maximized. On the other hand, total milk yield between five and 305 DIM (TMY305) amounts to the definite integral of the lactation curve with these two time points as lower and upper bounds, respectively; that is,
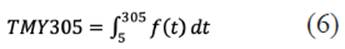
Notice that when computing TMY305 the first four days are discarded due to colostrum production. Persistency may be computed in several ways but, in general, it is a term referring to the behavior of the curve after PMY; thus, a persistent lactation is one in which the rate of decline after PMY is small (Yanar and Güler, 2009). Here, persistency was computed as defined by Johansson and Hansson (1940) who proposed to use the ratio between total milk production during the second 100 days and the first 100 days as a measure of persistency. Consequently, this parameter was computed as the ratio of two definite integrals. Table 1 shows the functional forms of each of the four models considered in this study and the corresponding associated production functions.
It is important to notice that the domain of the lactation curves is a subset of the set of positive real numbers, hence, PMY and DP are defined in this set; as a consequence, when the global maximum of the estimated curve is attained at a negative value of DIM (according to the expressions shown in Table 1), the estimated DP is zero and the estimated PMY is equal to the corresponding value of the function evaluated at 0.
Table 1 Functional forms of the fitted models and the corresponding associated production parameters.
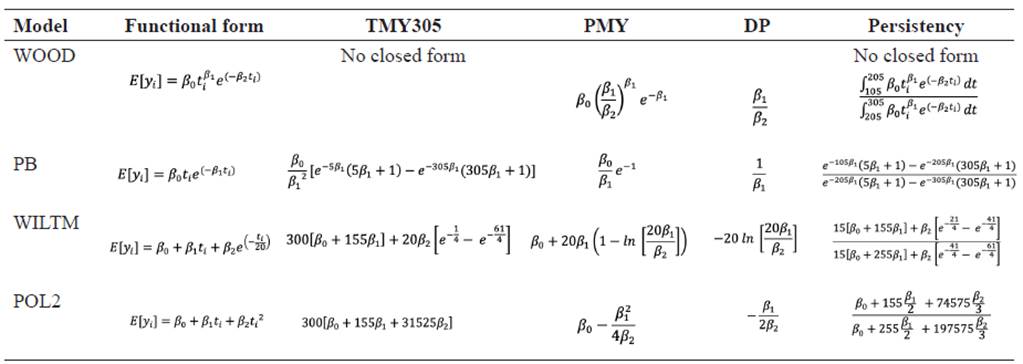
TMY305: Total milk yield between 5 and 305 days; PMY: Peak milk yield; DP: Days at peak; PB: Papajcsik and Bordero model; POL2: Second-order polynomial model; WILTM: Wiltmink model.
The integrals required to compute TMY305 and persistency in the Wood’s model were numerically evaluated using the Newton method because they do not have a closed form solution.
Results
We found that 1,382 lactations had a typical shape, which corresponded to 55.73% of the total number of lactations (2,480). Moreover, among curves with atypical shapes, the POL2 model was the most frequent, while the Wood model had the smallest frequency; however, the frequency of estimated atypical lactation curves from the Wiltmink’s model was nearly identical to the one from the POL2 model (Table 2).
Table 2 Percentages (relative to 2,480 lactations) of typical (PTFL), atypical (PAFL), and total lactations fitted (PFL) by each model.
| Model | PTFL | PAFL | PFL |
|---|---|---|---|
| PB | 3.47% | 0% | 3.47% |
| POL2 | 21.61% | 19.96% | 41.57% |
| WILM | 15.40% | 19.96% | 35.36% |
| WOOD | 15.24% | 4.35% | 19.60% |
| Overall | 55.73% | 44.27% | 100% |
PTFL: Percentages of typical curves; PAFL: Percentages of atypical curves; PFL: Total lactations fitted; PB: Papajcsik and Bordero model; POL2: Second-order polynomial model; WILTM: Wiltmink model.
Table 3 shows the frequencies of curves with and without negative estimated values relative to the 1382 curves without shape problems for each one of the fitted models.
Table 3 Frequencies (relative to 1,382 lactations) of curves with and without negative estimated values.
| Model | Negative | Positive |
|---|---|---|
| PB | 0% | 6.22% |
| POL2 | 2.03% | 36.76% |
| WILTM | 3.40% | 24.24% |
| WOOD | 0% | 27.35% |
| Overall | 5.43% | 94.57% |
PB: Papajcsik and Bordero model; POL2: Second-order polynomial model; WILTM: Wiltmink model.
Thus, 5.43% of the typical lactations yielded negative estimates, while 94.57% of them were strictly positive (1307 lactations). As to the selected models, among typical lactations with positive estimated milk yield values the POL 2 model exhibited the best fit for most of the lactations, followed by Wood’s model, Wiltmink’s model, and the PB model.
Table 4 presents the frequency of selection of each model by parity group computed from the 1307 lactations with typical shapes and positive estimated values. The second-order polynomial was the most frequently selected model across all lactation groups.
Table 4 Frequencies of selected models by parity group.
| Parity group | PB % | POL2 % | WILTM % | WOOD % |
|---|---|---|---|---|
| 1 | 6.7 | 37.3 | 34 | 22 |
| 2 | 5.5 | 43.9 | 28.5 | 22.1 |
| 3-5 | 5.6 | 37.7 | 25.2 | 31.5 |
| 6-13 | 9 | 34.3 | 24.7 | 31.9 |
PB: Papajcsik and Bordero model; POL2: Second-order polynomial model; WILtM: Wiltmink model.
Subsequently, the 1,307 estimated lactation curves were used to estimate the four production parameters of interest. The overall averages of the four estimated parameters were: PMY: 17.28 kg, DP: 57.17 days, TMY305: 3489.86 kg, persistence: 0.83 (Table 5).
Table 5 Descriptive statistics for the 1,307 estimated lactation curves of Gyr cattle performing in Colombian low tropic.
| Descriptive Statistics | TMY305 | DP | PMY | Persistency |
|---|---|---|---|---|
| Minimum | 1530.39 | 0.30 | 12.01 | 0.46 |
| Maximum | 6657.63 | 109.44 | 30.44 | 1.22 |
| Average | 3489.86 | 57.17 | 17.28 | 0.83 |
| Standard deviation | 958.21 | 23.41 | 3.68 | 0.13 |
| Coefficient of variation | 0.27 | 0.41 | 0.21 | 0.16 |
TMY305: Total milk yield between 5 and 305 days; PMY: Peak milk yield; DP: Days at peak.
Table 6 shows some descriptive statistics of the four parameters of interest for each of the following groups: first lactation, second lactation, third to fifth lactation and six or more lactations.
According to these results, the highest averages for TMY305, DP and PMY were found in the third to fifth lactation group, and the highest average for P was found in the first lactation group.
Table 6 Descriptive statistics of estimated lactation curves for the first lactation, second lactation, third to fifth lactation and six or more lactation groups of Gyr cattle performing in Colombian low tropic.
| Parity group | Statics | TMY305 | DP | PMY | Persistency |
|---|---|---|---|---|---|
| 1 | Minimum | 1,530.39 | 11.13 | 12.01 | 0.52 |
| Maximum | 5,362.45 | 109.44 | 28.13 | 1.22 | |
| Average | 3,187.98 | 58.92 | 15.80 | 0.85 | |
| Standard deviation | 803.48 | 19.92 | 3.58 | 0.13 | |
| Coefficient of variation | 0.25 | 0.34 | 0.23 | 0.16 | |
| 2 | Minimum | 1,930.03 | 6.34 | 12.10 | 0.49 |
| Maximum | 6,359.38 | 104.84 | 26.48 | 1.20 | |
| Average | 3,520.89 | 56.49 | 16.98 | 0.83 | |
| Standard deviation | 973.58 | 22.89 | 3.57 | 0.14 | |
| Coefficient of variation | 0.28 | 0.41 | 0.21 | 0.16 | |
| 3-5 | Minimum | 1531.59 | 0.30 | 12.16 | 0.52 |
| Maximum | 6,657.63 | 109.33 | 30.44 | 1.22 | |
| Average | 3,667.67 | 57.15 | 18.04 | 0.84 | |
| Standard deviation | 983.66 | 25.08 | 3.66 | 0.13 | |
| Coefficient of variation | 0.27 | 0.44 | 0.20 | 0.16 | |
| 6-13 | Minimum | 1,614.24 | 11.51 | 12.21 | 0.46 |
| Maximum | 5,160.98 | 108.29 | 29.78 | 1.05 | |
| Average | 3,089.92 | 55.87 | 16.99 | 0.80 | |
| Standard deviation | 820.88 | 22.68 | 3.43 | 0.13 | |
| Coefficient of variation | 0.27 | 0.41 | 0.20 | 0.17 |
TMY305: Total milk yield between 5 and 305 days; PMY: Peak milk yield; DP: Days at peak.
Discussion
In this study, milk yield records from a Gyr cattle population performing in the Colombian low tropic were used to study milk yield dynamics through the estimation of lactation curves and four production parameters derived from it. To the best of our knowledge, this is the first study involving thousands of lactations from individuals performing in several regions of Colombian low tropic in this particular breed. Four models were fitted to each lactation and five criteria were used to choose the model with the best fit.
As pointed out before, lactation curves of Gyr cattle have not been studied in Colombia. On the other hand, several studies have been conducted in Brazil. For example, Pereira et al. (2012) studied lactation curves in first parity Gyr cows in Brazil. Those researchers focused on comparing several measures of persistency in order to find one well-suited for genetic evaluation. However, their study aimed to predict breeding values for these measures of persistency and their modelling approach was based on random regression models.
The average persistency suggests that, in general, cows from this population are good at keeping the productivity level after PMY; the overall mean of persistency was close to the unit (Table 5). This is an indication of a good productive performance of animals from this population which can be a consequence of genetic, management and environmental factors.
Milk yield is expected to increase after parturition until reaching the peak milk yield and then decrease until the end of lactation; this is a typical behavior. Thus, milk yield dynamics is expected to be described by functions showing this trajectory. Hence, a concave function or a function changing from concave to convex may describe such shape as far as they meet the condition of having a maximum within a certain subset of the set of positive real numbers. This subset corresponds to the range where peak milk yield is usually attained. For example, a function having a maximum at 250 days would not be useful because it does not describe the usual behavior. However, curves not following this trajectory (atypical curves) are frequently found. In the Colombian low tropic, it has been found that certain individuals do not show a peak, milk yield is described by a strictly decreasing function (Ossa et al., 1997); thus, this type of curve was considered typical in this study. As pointed out by Macciota et al. (2003) when analyzing atypical curves, it is important to determine if they are the result of some biological phenomena or data-specific features such as missing data. Hence, studying these curves permits to find errors in data as well as individuals with extreme or erratic performance. Further, these individuals could be used to detect management conditions that induce these lactation trajectories.
Regarding data problems that cause atypical curves, a common one is the lack of records during the first weeks of lactation. So far, this problem has not been studied in depth; hence, there is not a threshold establishing an upper limit for the time at which the first record must be collected (e.g., at most 40 DIM). Days at first record is not always used as a criterion to edit datasets to be used for lactation curve estimation; when doing so, the threshold is defined ad hoc, and it is set around 40 or 45 days. For instance, Pereira et al. (2012) discarded lactations not having the first record within 45 days postpartum. Here, it was found that 74% of atypical curves did not meet the condition of having a record within 45 DIM.
As to the factors inducing atypical lactation curves, it has been found that these can be the result of environmental and management conditions of tropical dairy systems with low individual production levels using Bos taurusBos indicus crossbred cattle (Vinay-Vadillo et al., 2012). Notwithstanding, this kind of curves is not exclusive of these systems because they have also been found in dairy operations located in temperate regions using specialized breeds (Macciota et al., 2003). Tekerli et al. (2000) studied factors affecting the shape of lactation curves in Holstein cattle in Turkey. They found that farm, calving year and season, parity, and interval between calving and conception were associated with curve shape. Therefore, results from this research may be used for further studies concerning lactation dynamics in Colombian Gyr cattle.
Problems with data may also cause negative predictions. Such predictions do not occur in the observed DIM interval, but when extrapolating too far from its limits. Thus, negative predictions for this lactation stage may be found because of lack of records in early lactation. A similar situation can be found with unfinished lactations when projecting total yield to 305 DIM. However, in these cases, useful inferences can be performed within the range of observed records. For instance, if the DIM range [85, 170] was available, then PMY and DP could be estimated. In addition, this occurs with linear models because the functional form of their systematic components may take negative values. Notice that for β 0 > 0, the range of the functions describing the systematic component of the two non-linear models considered in this study is the set of positive real numbers.
Records from lactations with an atypical shape were sent to ASOCEBU in order to detect possible errors in the dataset. Some errors that may lead to estimated lactation curves exhibiting an atypical shape are: typos corresponding to very high yields towards the end of lactation which may have a high leverage (this may be due to incorrect recording of yield or days in milk) and errors when recording parity (what seems to be a single lactation may correspond to records from two consecutive lactations). After discarding errors in the dataset, further analysis should be performed in order to identify why these lactations showed such trajectories.
In general, the POL2 model had the best fit in most lactations, while the PB model was the one selected with the lowest frequency (Table 2). On the other hand, Wood’s model, one of the most frequently used models to fit lactation curves (Macciotta et al., 2001; Quintero et al., 2007), was the third most frequently selected. However, when checking the frequencies of typical curves without negative estimated milk yield, the Wood model was second in the ranking of most fitted models; in this group, the POL2 model was still the one that fitted most of the lactations (Table 2). Our results are in agreement with those reported by Ossa et al. (1997) who found that, with the exception of first-parity cows, a second-order polynomial fit milk yield data better than the Wood’s model in dual purpose-hybrid cows from the Caribbean region of Colombia. It is worth mentioning that, as can be seen in Table 2, the PB model did not yield atypical functions because β 1 was always positive. Using simple results from calculus, it can be shown that under this setting this function cannot have such a shape. In addition, this function either has a global maximum or is strictly increasing in the set of positive real numbers. Consequently, the high frequency of lactations in which the observed data showed an almost flat or u-shaped trend is one of the reasons explaining the low overall frequency of this model being selected as the one with the best fit (last column of Table 2). However, among lactations with typical trajectories, the PB model was still the one with the smallest selection frequency. Hence, our results suggest a poor fit of the PB model to milk yield records from Gyr cattle in Colombian low tropic dairy systems located in the regions considered in this study.
It is very important for Gyr cattle breeders to assess the productive performance of their herds because it is a relevant input for decision making. Some herds have the infrastructure to record milk yield on a daily basis; hence, they know their actual productive performance. However, this is not the case in many dairy operations, especially in low tropic systems where economic resources are limited. In these cases, statistical modelling would permit the computation of dairy production parameters such as total milk yield during a given period, peak milk yield, days at peak, and persistency.
Our results set the basis for the characterization of milk yield dynamics and assessment of productive performance of purebred Gyr cattle under the environmental and management conditions of low tropic areas in Colombia. To the best of our knowledge, this is the first study modelling Gyr cattle lactation curves in Colombia, considering records from thousands of individuals performing in several herds. Hopefully, these results along with those derived from other analyses carried out with the same dataset (e.g., cross-validation of total milk yield computed using partial milkings) will contribute to data-driven decisions in herds from the studied region.

