


 English (pdf)
 Article in xml format
 Article references
 Send this article by e-mail
 Cited by SciELO
  Cited by Google
  Similars in
SciELO
Similars in
SciELO  Similars in Google
 Permalink
INTRODUCTION
Colombia is one of the major producers of avocado cv. Hass in the world (Juya and Rivillas, 2019; Minagricultura, 2021). However, this crop has been established in very rainy areas of the high-Andean region where predominate strongly acidic soils, rich in exchangeable aluminum and with low availability of several nutrients (Osorio, 2014). Plant nutrition, through fertilization, is a critical factor for the productivity and quality of the fruit (Hofman et al., 2015). Avocado cultivation in these areas is recent and little is known about the removal of nutrients carried out by the fruit. Recent studies (Tamayo et al., 2018; Tamayo-Vélez et al., 2022; Rebolledo-Roa and Burbano-Díaz, 2023) on nutrient removal of avocado cv. Hass in Colombia suggested similarities with those reported in other countries where avocado has been widely cultivated (e.g., in Mexico). Rebolledo-Roa and Burbano-Díaz (2023) recommended the use of this information to elaborate fertilization programs. However, it is unclear if there are differences among localities and years. This has caused many producers to not achieve adequate yields and to present quality problems associated with nutritional and phytopathological disorders (Ramírez-Gil et al., 2020; Snijder et al., 2002). For this reason, it is necessary to know their nutritional needs and thus avoid under/overdose, which in turn can compromise the crop nutritional balance and yield or increase the risks of water contamination and production costs.
By knowing the removal of nutrients in the fruit, a fertilization program can be established that replaces what was extracted in the harvest in adequate proportions and quantities (Salazar, 2002; Mellado-Vázquez et al., 2015) that guarantee desired yields (>20 t ha-1) and post-harvest quality. However, the hypothesis of this study is that the amount of nutrient removed in the fruit of avocado Hass is affected by the site and the year of production that in turn affects conditions of the orchard (e.g., soil, weather, and management). Thus, the objective of this study was to determine the effects of site and year of productions on the removal of nutrients during the harvest stage of different tissues of the avocado fruit cv. Hass in two farms (El-Sinaí and La-Escondida) located in the high-Andean tropical zone of Colombia in three years of production (2018-2020).
MATERIALS AND METHODS
Locations. Two farms were selected: (i) La-Escondida farm (Cabeceras village, Rionegro, Antioquia): 6°5'58.3" N; 75°26'30.5" W, 14 years-old, altitude 2,200 m, minimum temperatures and maximum annual average of 12.6°C (January-February being the months with minimal temperatures) and 21.1°C (August being the month with maximal temperatures), average relative humidity of 85%, annual rainfall 1,837 mm; May and September-November being the rainiest months with precipitations of 348-390 and 202-343 mm/month, respectively; February and July-August were the driest months with precipitations of 54-98 and 30-172 mm/month, respectively (Fig. 1 and 2); this farm is placed in a moist-forest lower montane (Holdridge, 1967); (ii) El-Sinaí farm (Bellavista village, Anserma, Caldas): 5°16'57.12" N; 75°47'59.23" W, 7 years-old, altitude 2,000 m, annual average minimum and maximum temperature of 14.4°C (December being the month with minimal temperatures) and 22.9°C (August being the month with maximal temperatures), average relative humidity 87%, annual rainfall 2,091 mm; Abril and November being the rainiest months with precipitations of 148-290 and 109-346 mm/month, respectively; February-January and June are the driest months with precipitations of 34-86 and 94-101 mm/month, respectively (Fig. 1 and 2). This farms is located in a lower-montane moist-forest ecological life zone (Holdridge, 1967).
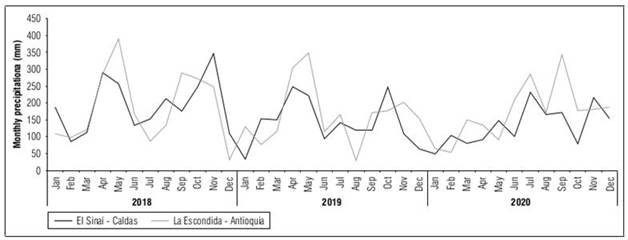
Figure 1. Monthly precipitation in El-Sinaí and La-Escondida farms in the three evaluation years (2018-2020).
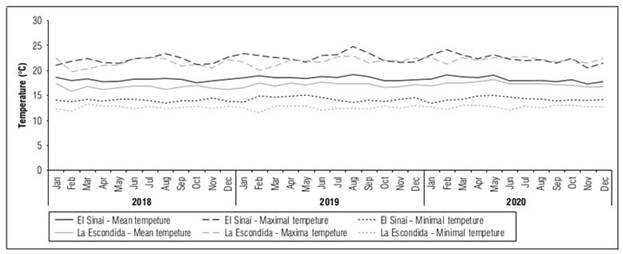
Figure 2. Mean, maximum and minimum monthly temperature El-Sinaí and La-Escondida farms in the three evaluation years (2018-2020).
Soils. For La-Escondida farm the soil testing results were: texture silty loam (Bouyoucos), pH 5.41 (saturation extract), bulk density 0.71 Mg m-3, organic matter content 170.8 g kg-1 (Walkley-Black); Ca, Mg and K 3.90, 1.20 and 0.95 cmolc kg-1(1M-NH4CH3CO2), respectively; P 8.0 mg kg-1 (Bray-II), S 48.6 mg kg-1(0.08-M Ca(H2PO4) 2). This soil is located in a relief that varies from flat to slightly undulating, with slopes ranging between 3-12%, and belongs to the Rionegro lithological association, which is oriented to intensive commercial agriculture and classified as Typic Melanudand (IGAC, 2007). For El-Sinaí farm (same methods): silty loam texture, pH 5.82, bulk density 0.79 Mg m-3, soil organic matter 126.2 g kg-1; Ca, Mg, and K 5.65, 1.29 and 0.42 cmolc kg-1, respectively, P 20.1 mg kg-1, S 20.0 mg kg-1. This soil is derived from volcanic-ash, which indicates that it is generally light soils, with mountainous topographies, with undulating relief with slopes less than 20% (Corpocaldas, 2020). Nutrient supply plans (kg ha-1) were made in the two orchards, the quantities were determined based on soil analysis by Dr. Samuel Salazar (Tab. 1).
Table 1. Detail of the nutrient supply (kg ha-1) during the 3 years of evaluation.
| Nutrient | 2018 | 2019 | 2020 | |||
|---|---|---|---|---|---|---|
| El-Sinai | La-Escondida | El-Sinai | La-Escondida | El-Sinai | La-Escondida | |
| N | 56.6 | 81.4 | 42.7 | 69.4 | 270.2 | 270.5 |
| P2O5 | 166.5 | 364.9 | 160.6 | 238.7 | 225.3 | 221.5 |
| K2O | 540.5 | 370.0 | 515.7 | 504.9 | 552.7 | 358.7 |
| CaO | 84.8 | 147.0 | 103.8 | 72.4 | 130.8 | 141.7 |
| MgO | 35.7 | 44.4 | 45.0 | 40.1 | 185.8 | 101.1 |
| S | 156.9 | 127.0 | 167.9 | 119.8 | 398.8 | 220.1 |
| Fe | 5.8 | 8.7 | 5.7 | 10.3 | 23.6 | 11.0 |
| Mn | 4.6 | 6.8 | 6.0 | 2.7 | 0.2 | 1.0 |
| Zn | 33.7 | 28.9 | 30.5 | 26.2 | 40.6 | 22.4 |
| B | 16.7 | 9.5 | 18.2 | 22.0 | 21.1 | 21.7 |
Tree selection. In each farm, the 15 most productive avocado trees, which at the time of selection had more than 200 fruits/tree in the olive stage (E-A: diameter 20-34 mm) (Fig. 3) and with similar height, phenological stage, health and agronomic management. Fruit sampling was conducted from these trees (10 fruits/tree) at the harvest stage (24% dry matter in the pulp) in the main harvest, using the methodology adapted from Mellado-Vázquez et al. (2015). Briefly, in each of these trees, 10 fruits were collected with a dry matter content in the pulp ≥24%, after obtaining their fresh weight, the fruits were washed with distilled water; then they were separated into peel, pulp, seed-coat, and seed and their fresh weight was obtained and their nutrient content measured as explained below Mellado-Vázquezet al. (2015).
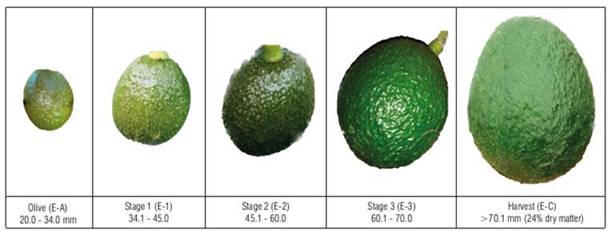
Adapted from Álvarez-Bravo and Salazar-García (2017).
Figure 3 Development stages of the fruit, own elaboration.
Variables. After obtaining their fresh weight, the fruits were washed with distilled water; then they were separated into peel, pulp, seed-coat, and seed and their fresh weight was obtained. The tissues were cut into thin slices and dehydrated in a forced air digital oven at 60°C until constant weight. The dried samples were pulverized in a stainless steel micromill and passed through a 40 sieve (mesh size 1 mm). Subsequently, the concentration of N, P, K, Ca, Mg, and S, was determined in the laboratory ( Mellado-Vázquezet al., 2015). For this purpose, the samples underwent wet digestion with HNO3 and HClO4 and then the concentration was determined as follows: N by the Kjeldahl method; K, Ca and Mg by atomic absorption; P and S by colorimetry (Bhandari, 2018). This was repeated in the 3 years (2018, 2019, 2020).
For each farm and in each year, the concentration of macronutrients was expressed in percentage. By multiplying their concentration by the dry weight of each tissue was obtained the nutrient content (mg/tissue). Then, by adding the contents of the same element, the accumulated value in each fruit was obtained (mg/fruit).
Statistical analysis. The experimental design was completely randomized, the factors evaluated were year, site, tissue, and their interactions (year×site, year×tissue, site×tissue, year×site×tissue). Each combination had 15 replicates. For each element, a multifactorial Anova were conducted to determine significant differences between nutrient content by the factors considered. The least significant difference (LSD) was used for mean separation. In all cases a significance level P≤0.05 was used. The statistical analysis were performed with the software R-Studio.
RESULTS AND DISCUSSION
The content and concentration of macronutrients in the tissues and whole fruit of avocado cv. Hass varied significantly (P≤0.05) depending on the year, site, and tissue (pulp, seed, peel and seed-coat) and their interactions. The Anova’s performed indicated that there were significant (P≤0.05) simple or interactive (dual and triple) effects of the factors considered. This suppports the hypothesis that the nutrient removal of avocado fruit cv. Hass changes depending on the site and year, and it is different depending on the fruit plant tissue considered. Likewise, these factors affected the amount of nutrient removed in the fruit.
In general, the tissue with the highest content (mg/tissue) for all nutrients was the pulp. It is relevant to highlight that the proportion with which each tissue contributes to the total weight of the fruit must be considered, thus, pulp and seed are those that more contributed with the total fruit dry weight (Tab. 2) (Salazar, 2002).
Table 2. Relative distribution (%) of dry weight in the different tissues of avocado cv. Hass fruit.
| Tissue | El-Sinai | La-Escondida |
|---|---|---|
| Pulp | 60.5 | 62.0 |
| Seed | 23.4 | 23.5 |
| Skin | 14.8 | 13.7 |
| Seed coat | 1.2 | 0.8 |
On the other hand, in the concentration of nutrients per tissue there was an opposite behavior, the seed-coat, which is the tissue in the smallest proportion in the fruit, was the one with the highest concentration of most nutrients. This tissue plays a key role in seed viability, Salazar (2002) reported that premature fruit drop has been associated with degeneration and death of the seed-coat and seed in initial or intermediate stages of fruit development.
Likewise, nutrient content in the fruit presented some differences between the sites depending on the element or the year. The differences may be due to some soil, climate, phenological stages and flower-to-harvest cycle variations in each farm, for instance the values of organic matter, available P and K were different between sites. As mentioned by Salazar-Garcia et al. (2011) in avocado in Michoacán there were changes in the nutritional composition of the fruit due to different types of climate, irrigation, flowering season and soil and orchard management.
Nutrient content and concentration per tissue
The N content was significantly (P<0.05) affected by the triple interaction (year×site×tissue). During the three years, the pulp was the tissue that accumulated more N in both sites (Fig. 4A). In 2018, the N content for both sites was highest for the pulp with values of 338 and 286 mg/tissue, respectively, followed by the seed, shell and seed-coat. For 2019, the N content in pulp continued to be the highest with respect to the rest of the tissues for the two sites, but it was below to previous year with values of 195 and 179 mg/tissue, respectively. In that same year, the N content for La-Escondida in the shell (76 mg/tissue) was above that of the seed (63 mg/tissue), contrary to the trend that had been occurring, higher content in seed vs. the shell. In 2020, the same situation occurred, but for the site El-Sinaí where the peel presented a value of 90 mg/tissue and the seed 65 mg/fruit. In that same year, it was also the pulp that presented the highest content of N 177 and 215 mg/tissue for El-Sinaí and La-Escondida, respectively.
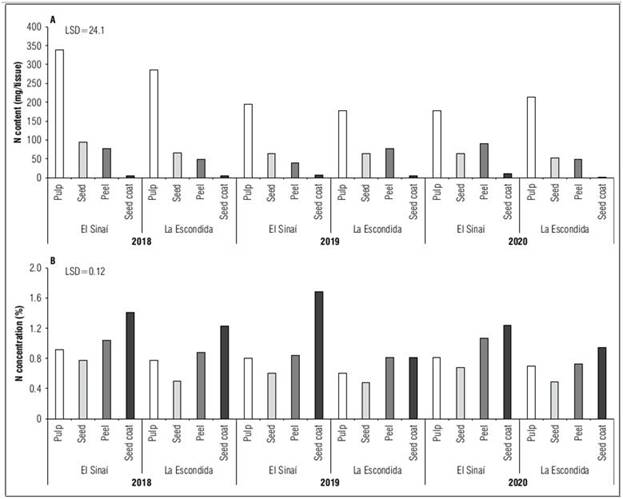
Figure 4. Content and concentration of N in the tissues of the avocado fruit cv. Hass (pulp, seed, peel and seed-coat) for three years (2018-2020) in the two farms (El-Sinaí and La-Escondida). Each column is the average of 15 repetitions. LSD= least significant difference with a P ≤0.05.
The N concentration in the different tissues was significantly affected by the triple interaction. For this case, during the three years, the seed-coat was the tissue that presented the highest N concentration with values of 1.41, 1.68 and 1.24% for El-Sinaí and 1.23, 0.81 and 0.94% for La-Escondida (Fig. 4B).
The P content was also significantly (P<0.05) affected by the triple interaction. As in N, for all years, the pulp was the tissue that presented the highest P content. Likewise, during the three years, El-Sinaí had higher contents for this tissue compared to La-Escondida (ES: 48, 41, 39 mg/tissue; LE: 35, 24, 29 mg/tissue). In general, in the years 2018 and 2019, between the two sites the trend was the same, higher P content in the pulp followed by the seed (ES:16, 13 mg/tissue; LE: 10 mg/tissue), the shell (ES: 8.5 mg/tissue; LE: 4.8 mg/tissue) and the seed-coat (ES: 0.7, 0.9 mg/tissue; LE: 0.4, 0.3 mg/tissue) (Fig. 5A). In 2020, the P content in the case of El-Sinaí in both seed and shell was very similar, 18 mg/tissue, La-Escondida maintained the trend, seed 8 mg/tissue and shell 5 mg/tissue.
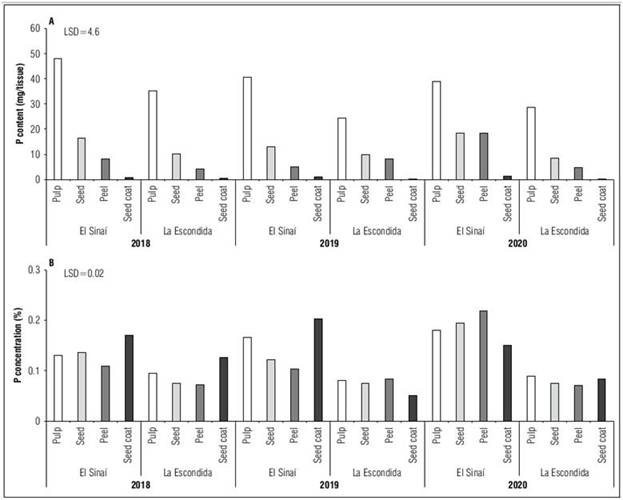
Figure 5. Content and concentration of P in the tissues of the avocado fruit cv. Hass (pulp, seed, peel and seed-coat) for three years (2018-2020) in two production units (El-Sinaí and La-Escondida). Each column is the average of 15 repetitions. LSD= least significant difference with a P ≤0.05.
The P concentration in the different tissues was also significantly (P<0.05) affected by the interaction triple. In 2018, the seed-coat was the tissue that presented the highest concentration of P with values of 0.17% (El-Sinaí) and 0.13% (La-Escondida), after the seed-coat, both sites presented variations, the second tissue with the highest concentration of P in El-Sinaí was the seed (0.14%), while in La-Escondida it was the pulp (0.10%). For 2019, in El-Sinaí the highest P concentration was also in the seed-coat (0.20%), followed by the pulp, seed and peel, while in La-Escondida it was the peel that presented the highest concentration (0.08%) and the seed-coat was the lowest (0.05%) (Fig. 5B). Likewise, in 2020 in El-Sinaí the peel presented the highest concentration (0.22%) compared to La-Escondida, which for that same year the lowest concentration was in that same tissue (0.07%).
The K content was significantly (P<0.05) affected by the interaction of the three factors under study year×site×tissue. In the three years, the content of this nutrient in the pulp is very marked, which is quite high compared to the other tissues (ES: 437, 322, 280 mg/tissue; LE: 518, 393, 418 mg/tissue); Likewise, higher contents are observed in La-Escondida vs. Sinai (Fig. 6A). In general, over the years the trend was the same, the second tissue with the highest K content was the seed, except for La-Escondida in 2019 where the behavior was different and the second tissue with the highest K content was the shell. with a value of 133 mg/tissue. In 2020, the same situation occurred in El-Sinaí, the shell was the second tissue with the highest K content (139 mg/tissue). Finally, for the three years and the two sites, the seed-coat was the tissue with the lowest K content with values of 6.2, 9.5 and 15.5 mg/tissue for El-Sinaí and 5.1, 10.7, and 2.1 mg/tissue for La-Escondida, respectively.
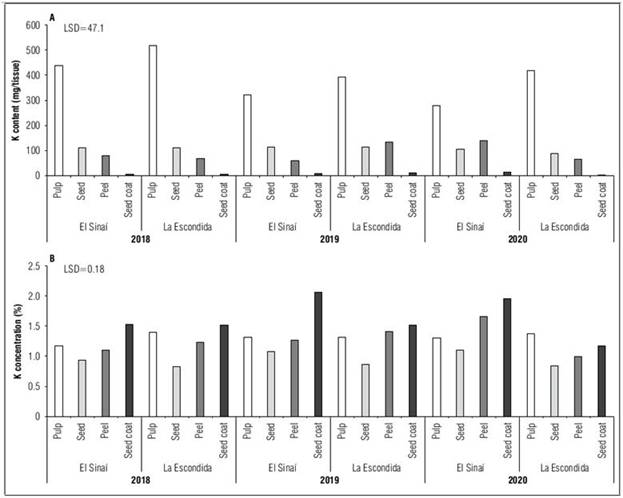
Figure 6. Content and concentration of K in the tissues of the avocado fruit cv. Hass (pulp, seed, peel and seed-coat) for three years (2018-2020) in two production units (El-Sinaí and La-Escondida). Each column is the average of 15 repetitions. LSD= least significant difference with a P≤0.05.
The K concentration in the different tissues was significantly (P<0.05) affected by the triple interaction. During the three years the seed-coat was the tissue with the highest concentration of K (El-Sinaí: 1.53, 2.06, 1.95%; La-Escondida: 1.52% (2018-2019), except in 2020 in La-Escondida, where the tissue with the highest concentration of K was the pulp (1.37%). Likewise, for all years and the two sites, the seed was the tissue with the lowest concentration of K with values of 0.93, 1.07 and 1.10% for El-Sinaí and 0.83, 0.87 and 0.83% for La-Escondida (Fig. 6B). On the other hand, the pulp was the second tissue with the highest concentration in most cases, only variation occurred in 2019 for La-Escondida where the peel was above the pulp (1.40, 1.31%, respectively) and in 2020 the same situation occurred for El-Sinaí where the K concentration values in the peel were higher than the pulp (1.65, 1.30%, respectively).
The Ca content in the fruit of avocado cv. Hass was significantly (P<0.05) affected by the interaction of the three factors under study year×site×tissue. It is striking that in 2018 for both sites the Ca content was higher in most tissues compared to subsequent years (Fig. 7A). Again, the pulp was the tissue with the highest Ca content in general, but for this particular year the values were 55 and 72 mg/tissue followed by the seed with values of 17 and 26 mg/tissue, the peel with 12 and 13 mg/tissue and the seed-coat with 1.3 and 1.2 mg/tissue for El-Sinaí and La-Escondida, respectively. In 2019, as already mentioned, the pulp had the highest content, but it is worth noting that this year both seed and shell were very similar with values of 6 mg/tissue for both tissues in El-Sinaí and 19 mg/tissue for the seed and 20 mg/tissue for the shell in La-Escondida, respectively. Likewise, 2020 had a behavior where the pulp had values of 26 (El-Sinaí) and 38 (La-Escondida) mg/tissue, the seed 10 (El-Sinaí) and 13 (La-Escondida) mg/tissue, the shell of 13 mg/tissue in both sites and the seed-coat of 3 (El-Sinaí) and 0.5 (La-Escondida) mg/tissue.
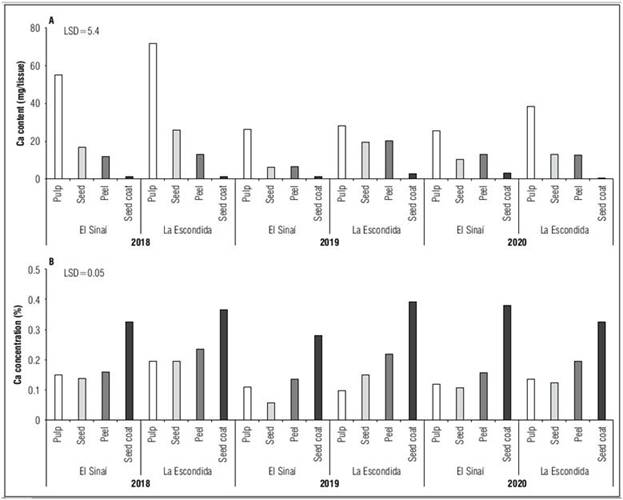
Figure 7. Content (A) and concentration (B) of Ca in tissues of avocado fruit cv. Hass (pulp, seed, peel and seed-coat) for three years (2018-2020) in two production units (El-Sinaí and La-Escondida). Each column is the average of 15 repetitions. LSD= least significant difference with a P ≤0.05.
The concentration of Ca in the different tissues was significantly (P<0.05) affected by the triple interaction of the three factors under study. In all years the seed-coat was the tissue with the highest concentration of Ca, in the case of El-Sinaí the values fluctuated between 0.32 and 0.38% and in La-Escondida between 0.37 and 0.32% (Fig. 7B). Then, the shell presented values of 0.16, 0.14 and 0.16% for El-Sinaí and 0.23, 0.22 and 0.20% for La-Escondida, this being the second tissue with the highest concentration. On the other hand, the seed and pulp had irregular behavior between years and between sites, the values in the pulp fluctuated between 0.15 and 0.12% and 0.19 and 0.13%, while for the seed the values fluctuated between 0.14 and 0.11% and 0.19 and 0.12% for El-Sinaí and La-Escondida, respectively, in some cases having similar values.
The Mg content in the fruit of avocado cv. Hass was also significantly (P<0.05) affected by the interaction of the three factors under study year×site×tissue. During the three years of evaluation, the pulp in the two sites presented the highest content (El-Sinaí: 30, 22 and 14 mg/tissue; La-Escondida: 35, 23 and 33 mg/tissue). In 2018, the trend was the same for both El-Sinaí and La-Escondida, the second tissue with the highest Mg content was the seed (8 and 7 mg/tissue) followed by the shell (7 and 5 mg/tissue) and finally the seed-coat (0.8 and 0.7 mg/tissue, respectively). For the year 2019, while in El-Sinaí the same trend as the previous year occurred, La-Escondida had a variation, the seed presented a value of 7 mg/tissue while the shell presented a Mg content of 11 mg/tissue. In 2020, the same behavior occurred, but in El-Sinaí, where the seed had a value of 5 mg/tissue and was below the shell, which had a Mg content of 9 mg/tissue. In the case of La-Escondida, the seed and the shell presented the same Mg content 6 mg/tissue (Fig. 8A).
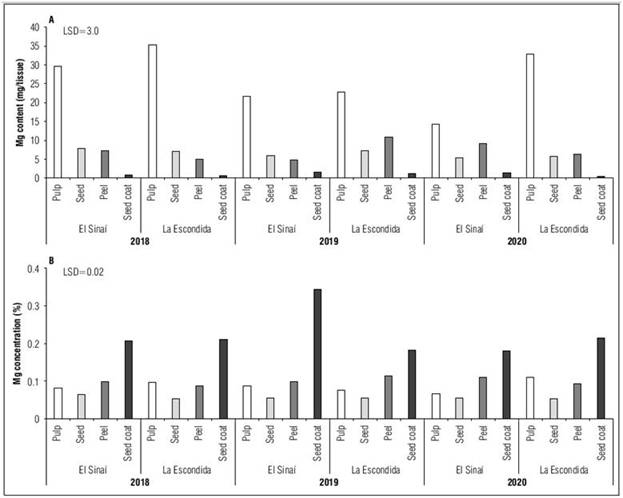
Figure 8. Content (A) and concentration (B) of Mg in the tissues of the avocado fruit cv. Hass (pulp, seed, peel and seed-coat) for three years (2018-2020) in two production units (El-Sinaí and La-Escondida). Each column is the average of 15 repetitions. LSD= least significant difference with a P ≤0.05.
The concentration of Mg in the different tissues was significantly (P<0.05) affected by the interaction of the three factors under study year×site×tissue. In all years and as in the nutrients already mentioned, the seed-coat was the tissue with the highest concentration of Mg in the two sites, with values of 0.21, 0.34 and 0.18% for El-Sinaí and 0.21, 0.18 and 0.21% for La-Escondida (Fig. 8B). Likewise, for the three years, the tissue with the lowest Mg concentration in the two sites was the seed with values between 0.07 and 0.06% for El-Sinaí and values between 0.05 and 0.06% for La-Escondida. In the case of the pulp and the peel, the values were very similar, these fluctuated between 0.08 and 0.07% and between 0.10 and 0.11% for El-Sinaí and between 0.10 and 0.11% and between 0.09 and 0.11% for La-Escondida, respectively.
The B content in the fruit of avocado cv. Hass was also significantly (P<0.05) affected by the interaction of the three factors under study year×site×tissue. It is worth highlighting that, during the three years of evaluation, the pulp in the two sites presented the highest S content (El-Sinaí: 20, 28 and 18 mg/tissue; La-Escondida: 24, 17 and 18 mg/tissue) and this is quite notable with respect to the rest of the tissues (Fig. 9A). On the other hand, for the three years a similar trend is evident between the two sites, where the second tissue with the highest B content is the seed (El-Sinaí: 7, 5 and 6 mg/tissue; La-Escondida: 6, 9 and 4 mg /tissue), followed by the shell (El-Sinaí: 4, 3 and 6 mg/tissue; La-Escondida: 3, 6 and 3 mg/tissue) and finally the seed-coat (El-Sinaí: 0.4, 0.7 and 0.8 mg/tissue; La-Escondida: 0.4, 0.6 and 0.2 mg/tissue).
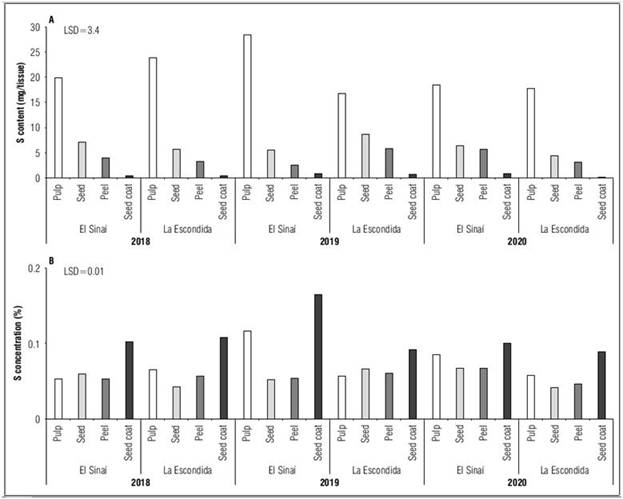
Figure 9. Content (A) and concentration (B) of S in the tissues of the avocado fruit cv. Hass (pulp, seed, peel and seed-coat) for three years (2018-2020) in two production units (El-Sinaí and La-Escondida). Each column is the average of 15 repetitions. LSD= least significant difference with a P ≤0.05.
The concentration of B in the different tissues was significantly (P<0.05) affected by the interaction of the three factors under study year×site×tissue. In all years the seed-coat was the tissue with the highest concentration of S, in the case of El-Sinaí the values fluctuated between 0.10 and 0.16% and in La-Escondida between 0.11 and 0.09%. In 2019, in El-Sinaí, it is highlighted that the second tissue with the highest concentration of B was the pulp with a high value of 0.12%, compared to the other years in the same site and with La-Escondida. Likewise, the seed and shell concentrations for this same case were similar with values of 0.05% (Fig. 9B). In general, in 2020, in El-Sinaí the behavior of the seed and the shell was very similar, the values were 0.07% for both tissues, while La-Escondida presented values for the seed of 0.04% and for the shell of 0.05%.
Nutrient content in the fruit
The N content in the fruit was significantly (P<0.05) affected by the interaction of the two factors under the year×site study. In 2018, El-Sinaí had a higher N content (515 mg/fruit) compared to La-Escondida (406 mg/fruit), for this year the contents were higher compared to subsequent years (Tab. 3). In that sense, for 2019 the N content in fruit was not significantly different between La-Escondida (324 mg/fruit) and El-Sinaí (307 mg/fruit). Then, in 2020, a situation was finalized, with no significant differences between El-Sinaí and La-Escondida with values of 341 and 318 mg/fruit, respectively.
Table 3. Average content of nutritional elements (mg/fruit) in the fruit of avocado cv. Hass in two productive units (El-Sinaí and La-Escondida) for three years (2018-2020).
| Nutrient | 2018 | 2019 | 2020 | LSD (P<0.05) | |||
|---|---|---|---|---|---|---|---|
| El-Sinaí | La-Escondida | El-Sinaí | La-Escondida | El-Sinaí | La-Escondida | ||
| N | 514.7 a | 405.5 b | 306.9 c | 323.6 c | 341.5 c | 317.8 c | 59.3 |
| P | 73.2 a | 49.8 bc | 59.4 b | 42.3 c | 77.1 a | 41.9 c | 11.0 |
| K | 635.3 ab | 701.6 a | 505.8 b | 649.7 ab | 538.9 b | 575.4 b | 103.9 |
| Ca | 85.1 b | 111.8 a | 40.2 d | 70.5 c | 51.6 cd | 64.3 c | 13.8 |
| Mg | 45.6 a | 48.0 a | 33.9 b | 42.3 a | 30.2 b | 45.3 a | 6.5 |
| S | 31.3 a | 33.0 a | 37.2 a | 31.8 a | 31.4 a | 25.5 a | NS |
LSD= indicates the minimum significant difference (P<0.05). Horizontal comparisons. Means followed by different lowercase letters are significantly different to each other (P<0.05).
The content of P and Mg in the fruit were significantly (P<0.05) affected by the interaction of the two factors under the year×site study. It is worth highlighting that, during the three years of evaluation, the P content in the fruit was significantly (P<0.05) higher in the site El-Sinaí compared to La-Escondida, in addition to this, the Escondida had higher values in Mg concentration in the fruit. It is worth to mention that more P2O5 was added in La-Escondida than El-Sinaí, but more soil-available P was detected in the soil of El-Sinaí (20.8 mg kg-1) than in La-Escondida (8.0 mg kg-1). This suggested than soil conditions may have more control on the P accumulated in the fruit than the P-fertilization management.
The content of K and Ca in the fruit was significantly (P<0.05) affected by each factor separately, but not by the interaction of the two factors under study year×site, in general, La-Escondida presented a significantly (P<0.05) higher value than El-Sinaí (642.23 vs. 560.01 mg /fruit, respectively) for potassium; On the other hand, a significantly (P<0.05) higher Ca content in fruit was present in La-Escondida (82.2 mg/fruit) than in El-Sinaí (58.9 mg/fruit) (Tab. 1), in this case this coincided with higher Ca-supply in the fertilization program (Tab. 1), but the value of soil-available Ca was higher in El-Sinaí. The differences observed in K content in the fruits may be associated to the fact that soil-available K was higher in La-Escondida (0.95 cmolc kg-1) than in El-Sinai (0.42 cmolc kg-1) in despite that in general more K2O was added into El-Sinai’s soil (Tab. 1). Again, soil K condition may have more differences among years (2018 > 2019, 2020) in K and Ca in the fruits may also be associated with lesser precipitation in the last two years that might reduce K mobility in the soil (El-Sinaí: 2018: 2 304 mm year-1; 2019: 1 704 mm year-1; 2020: 1 584 mm year-1; La-Escondida: 2018: 2 232 mm year-1; 2019: 1 980 mm year-1; 2020: 2 052 mm year-1).
The S content in the fruit was not significantly affected by each individual factor, nor by the year×site interaction. In general, the average value was 31.7 mg/fruit. In the three years and in the two sites, the values obtained for El-Sinaí were 31.3, 37.2 and 31.4 mg/fruit and for La-Escondida 33.0, 31.8 and 25.5 mg/fruit (Tab. 1).
The nutrient content in the different tissues of the avocado fruit cv. Hass for all macronutrients had the same trend, the pulp was the tissue that presented the highest content in all cases because it is the tissue with the highest proportion in the weight of the fruit, as previously mentioned. Likewise, in the case of nutrient concentration, the seed-coat was the tissue that concentrated the most nutrients in most cases. This agrees with Mellado-Vázquezet al. (2015), who report that the seed-coat was the tissue that presented the highest concentration values of all nutrients in avocado cv. Mendez. Data similar to those presented here were reported by Tamayo et al. (2018) and Salazar (2002).
Taking as reference the production values of the trees selected during the evaluation years, in this work it was possible to quantify the amounts of nutrients removed by each of the fruit tissues of avocado cv. Hass, making it clear that these may vary between years and sites. Below are the concentration ranges in the different tissues per tissue and per fruit and the ranges of quantities removed in the fruit, expressed in terms of kg t-1 for the macronutrients. The order of macronutrient removal in the fruit (mg/fruit) was: K (506-702) > N (307- 515) > Ca (40-112), P (42-77) > Mg (30-48) > S (26-37) when considering that the fresh fruit can have an average value close to 200 g, the amount removed by one fresh ton of cv. Hass avocado can be calculated. When considering the extraction of macronutrients in terms of kg t-1, for which an average fruit weight of 200 g and an average moisture content of 24% was considered, the values in descending order are: K (2.53-3.51) > N (1.53-2.57) > Ca (0.20-0.56), P (0.21-0.38) > Mg (0.15-0.24) > S (0.13-0.18).
The above data coincides with the results obtained by Maldonado-Torres et al. (2007), Tamayo et al. (2018) who indicated a differential accumulation of nutrients in the fruit, with K being the most concentrated. However, the position of S generates discrepancy with values reported by other authors (Tamayo et al., 2018).
The practical implications of these results can lead to defining, at least in part, the crop fertilization plan in relation to the removal of nutrients in the fruit as reported by Rebolledo-Roa and Burbano-Díaz (2023). These authors demonstrated that a fertilization program based on nutrient removal increased the tree productivity in 20 kg/tree in the second year of application compared with traditional fertilization program. It is necessary to work on issues of fertilization efficiency, a topic for future research. Likewise, it is necessary to consider the demand for nutrients by other tissues (flowers, leaves, branches, stems and roots), their recycling and translocation in rainy tropical environments for avocado and compare them with published data available for drier subtropical environments where avocado is commonly cultivated.
The soil and climate conditions of each of the farms in which the trial was carried out influenced the numerical trends of some variables such as the concentration of nutrients, which in the fruit tissues of the cv. Hass behaved in general in similar ways. It is also worthy to evaluate the impact of fertilization programs with different soil and climate conditions because the data suggested different degree of control of these factors on fruit nutrient accumulation.
CONCLUSION
The nutrient content in tissues presented the following trend: pulp > seed, peel > seed-coat. This was affected by interactions with Years and sites, while the concentration of nutrients in the tissues presented an inverse behavior. This indicates the importance for developing local/regional approaches associated to particular conditions of soils and weather variations. The removal of nutrients in the fruit expressed in kg t-1 (macronutrients) had the following order: K 2.53-3.51, N 1.53-2.57, Ca 0.20-0.56, P 0.21-0.38, Mg 0.15-0.24 and S 0.13-0.18, which are comparable with those reported locally in Colombia and other countries such as Mexico and Peru. Since the data of nutrient removal and nutrient concentration in the fruit tissues were obtained from high-productive trees, they may be used as a reference of fruit nutritional status for farmers interested in monitoring and improving plant nutrition of low-yield trees.

