


 English (pdf)
 Article in xml format
 Article references
 Send this article by e-mail
 Cited by SciELO
  Cited by Google
  Similars in
SciELO
Similars in
SciELO  Similars in Google
 Permalink
Introduction
Response-Contingent Positive Reinforcement (RCPR) describes an increase in the frequency or duration of a behaviour as a result of a reinforcer being delivered. RCPR may increase the likelihood of behaviours due to an individual experiencing self-mastery or achievement following a behaviour (Wang & Feng, 2022). Thus, decreased environmental and social reinforcement may result in the extinction of “healthy” adaptive behaviours and, consequently, lead to the dysphoric mood and passivity that often characterize depression (Shindaini et al., 2022), with empirical evidence supporting the relationship between a low rate of RCPR and emotional distress (Fernández-Rodríguez et al., 2022).
The idea that low RCPR might produce dysphoria and depressive symptoms has prompted suggestions that, from a behavioural perspective, low RCPR may be a critical factor in the etiology and maintenance of clinical depression (Berman et al., 2022; Santos et al., 2021). Empirically-supported psychological interventions for depression, such as behavioural activation (BA), are based on this hypothesis. A low rate of RCPR is also present in other problems addressed by contextual and behavioural approaches, such as experiential avoidance disorder (Dahl et al., 2004) and behavioural avoidance and inhibition (Wagener & Blairy, 2015). RCPR also plays an important role in cases of substance abuse, especially in relation to the deprivation of environmental rewards and engagement in psychoactive substance-free activities (Meshesha et al., 2018).
Carvalho et al. (2011) developed the Reward Probability Index (RPI) to assess ability to experience environmental rewards during the months prior. Factor analyses revealed that its two-factor structure explained 41.1% of the variance (Carvalho et al., 2011). Factor 1 is called Reward Likelihood (11 items) and combines items from the “Potentially Reinforcing Events” and “Instrumental Behaviours” dimensions. Factor 2 is called Environmental Suppressors (9 items) and combines items from “Availability of Reinforcement” and “Aversive Stimuli in the Environment”. The RPI showed good internal consistency for the overall scale (a = .88), as well as for the dimensions (Reward Likelihood: a = .80; Environmental Suppressors: a =.87), and good convergent validity given the moderate to strong correlations with depression scores and measures of activity and avoidance (Carvalho et al., 2011).
Wagener and Blairy (2015) validated the French-language version of the RPI. They reported that the two-factor model showed a good fit. They assessed internal consistency using the Cronbach’s alphas of the two RPI factors. The subscales obtained good internal consistency (Reward Likelihood: a = .87; Environmental Suppressors: a = .86). In another study, Voss et al. (2021) conducted a psychometric evaluation of the RPI in a population of emerging adult drinkers in the United States using two studies with different samples (Study 1: n = 393; Study 2: n = 602). Study 1 conducted an exploratory factor analysis (EFA) that yielded a two-factor model. Study 2 applied several confirmatory factor analyses (CFAs) that showed that the two-factor model of a 17-item version (after removing items 4, 17, and 18) obtained the best fit. The two dimensions presented good internal consistency (Reward Likelihood: a = .86; Environmental Suppressors: a = .84).
In sum, RCPR seems to predict and correlate with the acquisition and maintenance of affective disorders (Fu et al., 2021). It is also related to evidence-based therapies such as BA, and its usefulness in problems related to substance use is being explored. However, to the best of our knowledge, the psychometric properties of the RPI have not been analysed in Spanish-speaking countries. Collado et al. (2014) conducted the only study that mentions a Spanish version of the RPI, in which the RPI was translated for a preliminary study that analysed the efficacy of BA in Latinos in the US. Obtaining evidence of the psychometric properties of the Spanish version of the RPI would provide an assessment tool that would enrich research and clinicians’ assessments for BA in Spanish-speaking countries. For this purpose, the present study aimed to analyse the psychometric properties, factor structure, and gender invariance of the RPI in a large Colombian sample.
Method
Participants
The sample consisted of 1129 adult participants (M = 27.56 years, SD = 8.92; 74.2% women, 25.3% men, .44% did not report gender) from 28 Colombian departments corresponding to the five regions of Colombia (Bogotá, Atlantic, Central, Eastern, and Pacific). They participated voluntarily in the research and provided informed consent. Some participants were excluded because they did not meet the age criteria (n = 26) or because they did not complete the entire survey (n = 6). Exclusion criteria included the presence of psychosis or a current diagnosis of a severe psychiatric or neurological disorder. None of the participants stated that they suffered from these types of disorder and so no participants were excluded for this reason. Participants did not receive financial compensation.
Participants were mainly employed (39.4%), single (72.9%), with university education (48.9%), at a medium socioeconomic level (42.9%), and from the Bogotá region (46.5%). Thirty-four participants (3%) reported a history of hospitalization for mental health reasons.
Instruments
Reward Probability Index (RPI). The RPI (Carvalho et al., 2011) is a 20-item self-report measure designed to approximate RCPR by evaluating the magnitude of environmental rewards. The scale assesses the four dimensions of RCPR across two factors: Reward Likelihood and Environmental Suppressors. Participants rate each item on a 4-point Likert scale (1 = strongly disagree; 4 = strongly agree) for the past few months, with higher scores indicating higher reward levels. The psychometric properties of the RPI were established through three studies (Carvalho et al., 2011). The measure demonstrated strong internal consistency (a = .88) and good two-week test-retest reliability (r = .69). Convergent validity was established from the strong correlations shown between measures of activity, avoidance, reward, and depression (r > .60).
Environmental Reward Observation Scale (EROS). The EROS (Armento & Hopko, 2007) is a scale that assesses environmental reward using ten items that are responded to on a 4-point, Likert-type scale. The scoring range is 10- 40, with higher scores indicating higher perception of reinforcement. The scale seeks to detect the magnitude of reinforcing events, the availability of reinforcement in the environment, and the individual’s ability to elicit such reinforcement. The EROS presents strong internal consistency (a = .88) and excellent one-week test-retest reliability (r = .85) (Armento & Hopko, 2007). The validation study for the Colombian population (Valderrama et al., 2016) found appropriate levels of internal consistency (a = .87) and a one-factor internal structure explaining 46.82% of the variance.
Behavioral Activation For Depression Scale (BADS). The BADS (Kanter et al., 2007) assesses the behaviours responsible for change (i.e., behaviours that should lead to increased contact with RCPR) according to the BA treatment model. The instrument has 25 items comprising four dimensions: Activation (Items 3, 4, 5, 11, 12, and 23), Avoidance/Rumination (Items 8, 9, 10, 13, 14, 15, 24, and 25), Difficulties at Work or School (Items 1, 2, 6, 21, and 22), and Social Impairment (Items 16, 17, 18, 19, and 20). The BADS also provides a total score (Kanter et al., 2007) and uses a 7-point, Likert-type scale. The scoring range is 0-150, with higher scores indicating greater activation. In the Colombian validation (Leal et al., 2016), the BADS showed appropriate levels of internal consistency (a = .92) and acceptable levels in its dimensions (a >.81). Significant correlations were observed with the Zung’s Self-Assessment Scale for Depression (r = -.726). CFA indicated that the four-factor model obtained an acceptable fit.
Zung's Self-rating Depression Scale (Zung-SDS). The Zung-SDS (Zung, 1965) consists of 20 items that are responded to on a 4-point, Likert-type scale. The scoring range is 20-80, with scores equal to or greater than 40 considered an indicator of the probable presence of a clinically-relevant major depressive episode (Campo-Arias et al., 2005). The validation study of the Colombian version of the instrument showed an adequate internal consistency (a = .85), sensitivity of 88.6% (95% CI (82.9, 98.9)) and specificity of 74.8% (95% CI (68.4, 80.2)) (Campo-Arias et al., 2005).
Procedure
The present study was conducted as part of a master’s thesis and followed the ethical guidelines of the Psychology Research Center at Fundación Universitaria Konrad Lorenz. The research adhered to the Declaration of Helsinki of ethical principles for medical research involving human participants.
Phase I. Authorization. Authorization was obtained from the original authors of the RPI for its use for academic and research purposes. The permission was requested and granted via email from the researchers who designed the scale (Carvalho et al., 2011) and those who had translated the version used in studies with Spanish speakers (Collado et al., 2014). The Spanish translation of the RPI was used in the study by Collado et al. (2014), but to the best of our knowledge, it has not been submitted to psychometric analyses.
Phase II. RPI adaptation. A pilot test was conducted with a group of 60 undergraduates to detect problems of clarity in each of the items of the RPI. Appropriate adjustments were subsequently made according to the observations in the pilot sample.
Phase III. Application of the RPI. To conduct a psychometric analysis of the RPI, the instruments presented above were applied to the sample of 1129 participants. The sample was recruited through a referral chain or snowball sampling via social networks and the Internet. The questionnaires were applied through a survey platform, with participants completing them in an average of 25 minutes and 7 seconds. The sample was randomly divided into two groups (n1 = 563; n2 = 566). The size of each group was big enough for the analyses to be performed according to the guideline stating that a minimum of 10 to 15 participants must be recruited per item to perform the confirmatory factor analyses (Price, 2016).
Data analysis
We examined the data before conducting the statistical analyses and found no missing values. The sample was then randomly divided into two sub-samples using SPSS 19©. For the first random sample (n = 563), we conducted an exploratory factor analysis (EFA) using Factor 10.5 (Lorenzo-Seva & Ferrando, 2006). Using the polychoric correlation technique, we selected the robust diagonally weighted least square estimation method (robust DWLS) with direct oblimin rotation. We applied the optimal implementation of parallel analysis (PA) using minimum rank factor analysis (Timmerman & Lorenzo-Seva, 2011) and the Hull method using robust CFI and robust RMSEA (Lorenzo-Seva et al., 2011) to determine the number of factors to retain in EFA. We computed Unidimensional Congruence (UniCo), Explained Common Variance (ECV), and mean of item residual absolute loadings (MIREAL) indexes to assess essential unidimensionality. Values larger than .95 and .85 in UniCo and ECV, respectively, suggest that data can be treated as essentially unidimensional, whereas for MIREAL, a value lower than .30 suggests unidimensionality (Ferrando & Lorenzo-Seva, 2018). Lastly, we obtained corrected item-total correlations to analyse the discrimination item index.
For the second subsample (n = 566), we adopted the robust DWLS estimation method using polychoric correlations to conduct the CFA using LISREL 8.71©. We computed the Satorra-Bentler chi-square test for both the single-factor model and the two-factor model, alongside the following goodness-of-fit indexes: (a) the root mean square error of approximation (RMSEA), (b) the comparative fit index (CFI), and (c) the non-normed fit index (NNFI), (d) the standardized root mean square residual (SRMR), (e) the expected cross-validation index (ECVI), and (f) the parsimony normed fit index (PNFI). According to Hu and Bentler (1999), RMSEA values of .08 represent a good fit, and values below .05 indicate that the model has a very good fit to the data. For the SRMR, values of less than .08 represent a reasonable fit, and values of less than .05 indicate a good fit. Concerning the CFI and NNFI, values greater than .90 indicate a good fit, and those greater than .95 denote that the model has a very good fit to data. Lastly, lower ECVI values indicate a better fit of the model, and higher PNFI values indicate a more parsimonious model.
The construct reliability and evidence of the convergent and discriminant validity of the measurement model for RPI were analysed according to the suggestions made by Brown (2015). We calculated the composite reliability coefficient (CR) to reveal construct reliability. CR values higher than .70 indicate high construct reliability and adequate internal consistency. We analysed three additional criteria to learn more about the convergent validity of the measurement model, namely (a) that factor loadings should be statistically significant (standardized loadings estimates should be .40 or higher, and ideally .70 or higher), (b) CR should be higher than .70 in each factor, and (c) the average variance extracted (AVE) should be equal to or higher than .50 for each construct of the RPI. Lastly, to assess discriminant validity we considered two criteria: (a) inter-construct correlations of below .80, these provide evidence that the discriminant validity is adequate; and (b) that the square root of AVE (√AVE) of each factor should be greater than the inter-construct correlations between factors.
Following the guidelines provided by Jöreskog (2005) and Millsap and Yun-Tein (2004), we performed additional multi-group confirmatory factor analyses (CFAs) on the whole sample (n = 1129) to test for metric, scalar, and strict invariances across gender. We compared the relative fit of four increasingly restrictive models: the multiple-group baseline model, the metric invariance model, the scalar invariance model, and the strict invariance model. We compared the RMSEA, CFI, and NNFI indexes of the nested models, and selected the more constrained model (i.e., second model vs. first model, third model vs. second model, fourth model vs. third model) if the following criteria suggested by Cheung and Rensvold (2002) and Chen (2007) were met: (a) the change in RMSEA (ΔRMSEA) was lower than .01 and (b) the changes in CFI (ΔCFI) and NNFI (ΔNNFI) were equal to or greater than -.01.
To explore the internal consistency of the RPI, we computed Cronbach’s alpha and McDonald’s omega using the MBESS package in R on the whole sample (Kelley & Lai, 2012; Kelley & Pornprasertmanit, 2016), while providing percentile bootstrap 95% confidence intervals (CI) (Viladrich et al., 2017). Descriptive data were calculated with SPSS 19©. Lastly, we calculated Pearson correlations between the RPI and other scales to assess the validity evidence concerning other relevant constructs measured in this study. Correlations were interpreted according to the guidelines provided by Cohen (1988), which state that r between .10 and .30 indicates a small correlation, r between .30 and .50 a medium correlation, and r > .50 a strong correlation. Values of r greater than .70 are considered very strong correlations and are needed to establish convergent validity (Chmielewski et al., 2016).
Results
Descriptive statistics of instruments
Table 1presents the scale scores and internal consistency indexes that show the reliability of the instruments used for this sample.
Table 1 Statistics and internal consistency coefficients of the instruments for each sample
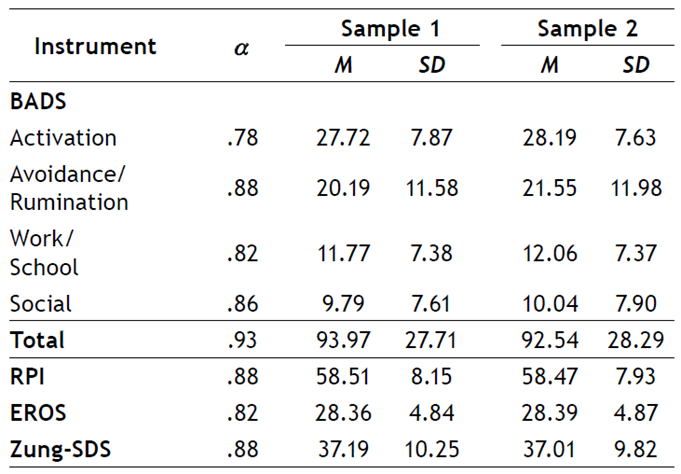
Note: Zung-SDS: Zung Self-report Depression Scale; EROS: Environmental Reward Observation Scale; BADS: Behavioral Activation Depression Scale; RPI: Reward Probability Index. M: Media; SD: Standard Deviation; a: Cronbach’s alpha
Psychometric Quality of the Items
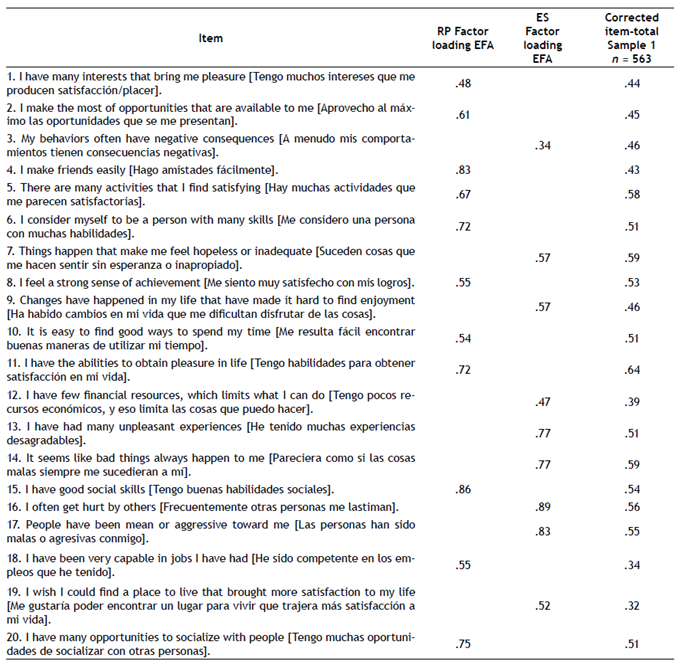
Table 2 shows the items of the RPI, their translations into Spanish, and the corrected item-total correlations found in the first random sample (n = 563). All items showed good discrimination, with corrected item-total correlations ranging from .32 (Item 19) to .64 (Item 11). Cronbach’s alpha was .88 (95% CI (.87, .89)), whereas McDonald’s omega coefficient was .88 (95% CI (.87, .89)) for the total sample. The internal consistency of both dimensions was good (Reward Probability: a = .85, 95% CI (.84, .87), ω = .86, 95% CI (.84, .87); Environmental Suppressors: a = .83, 95% CI (.82, .85), ω = .83, 95% CI (.82, .85)).
Validity evidence based on internal structure
Dimensionality. We conducted an EFA on the RPI using the first random sample. The Bartlett’s test statistic was statistically significant at 5928.7(190), p < .001, and the result of the Kaiser-Meyer-Olkin test was very good (.90).
The PA suggested that two factors be extracted, which accounted for 51% of the variance. The results of the Hull method when applied to robust CFI and RMSEA also suggested that two common factors be retained to obtain a very good fit (CFI= .970 y RMSEA= .067). Table 2 also shows that factor loadings were good for all items, with Reward Probability from .479 (Item 1) to .864 (Items 15) and Environmental Suppressors from .336 (Item 3) to .887 (Items 16). Values of UniCo (.925), ECV (.765), and MIREAL (.314) suggest that the data should not be treated as essentially unidimensional. In conclusion, the results of the EFAs we conducted suggest that RPI can be treated as a two-dimension measure.
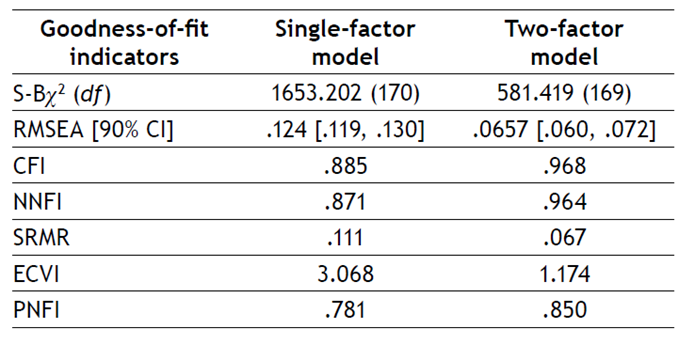
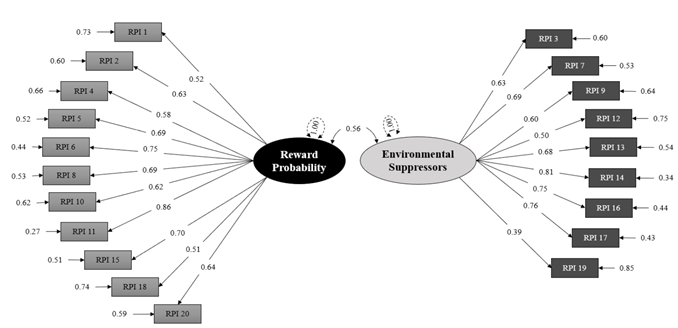
To corroborate the EFA results, we conducted a CFA on the second random sample (n = 566) to analyse the single-factor model and the two-factor model. The fit of the single-factor model was poor (X2/df = 9.724, p < .001; RMSEA = .124, CFI = .885, NNFI = .871; and SRMR = .111), whereas the two-factor model produced clearly better results (X2/df = 3.440, p < .001; RMSEA = .066, CFI = .968, NNFI = .964; and SRMR = .067). The ECVI and PNFI values also support the superiority of the two-factor model (see Table 3). The results of the completely standardized solution of the two-factor model can be seen in Figure 1.
Construct reliability and convergent and discriminant validity of the measurement model. The CR values were higher than .70 for both factors (Reward Probability = .89 and Environmental Suppressors = .87), which indicates that the RPI showed high construct reliability. Regarding convergent validity, all factor loadings were statistically significant, with six standardized loadings higher than .70 and 13 higher than .40. Only Item 19 showed a factor loading slightly below the cutoff of .40 (lambda l = .39). The AVE values were lower than the cutoff of .50 for the two constructs (Reward Probability = .44, Environmental Suppressors = .43). However, the convergent validity of the constructs can be considered acceptable when the CR values are higher than .70 and AVE values higher than .40 (Huang et al., 2013).
Additionally, all CR values were very high, and the AVE values were higher than .40, which supports the convergent validity of the RPI. The RPI was also shown to have good discriminant validity because the inter-construct correlation was below .80 (correlation between Reward Probability and Environmental Suppressors = .55). Moreover, the square roots of the AVE values of each factor were higher than theinter-construct correlation between this latent variable and any other factor (√AVE of Reward Probability = .66 and √AVE Environmental Suppressors = .66, higher than .55).
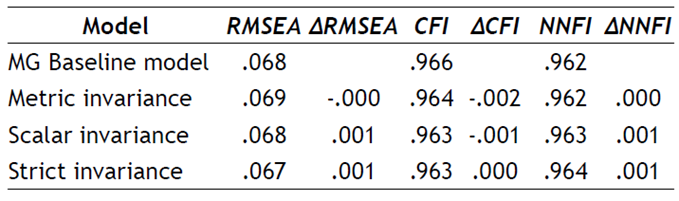
Measurement invariance. Table 4 presents the results of the measurement invariance analysis. The measurement invariance at metric, scalar, and strict levels was supported across gender because changes in RMSEA, CFI, and NNFI were below .01.
Validity evidence based on relationships with other variables
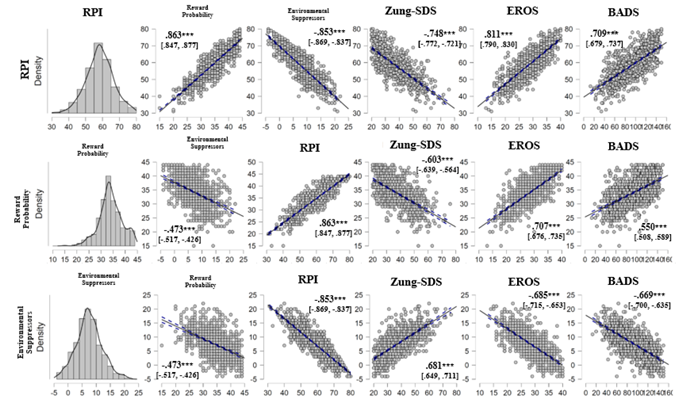
The correlations that the RPI obtained with other relevant constructs are theoretically coherent and statistically significant: p < .001 (see Figure 2 and Table 5). The RPI subscales showed correlations with the other assessed constructs that conformed to the expected directions and sizes. We observed strong correlations between the RPI total score and other measures of activation and avoidance (BADSactivation =.57, BAD Savoidance/rumnation = -.60), environmental reward (EROS = .81), and depression (Zung-SDS = -.75). These correlations supported the convergent validity of the RPI. The relationships were largely consistent across both RPI factors.
Table 5 Pearson correlations between the scores for RPI and its two dimensions and the dimensions of BADS
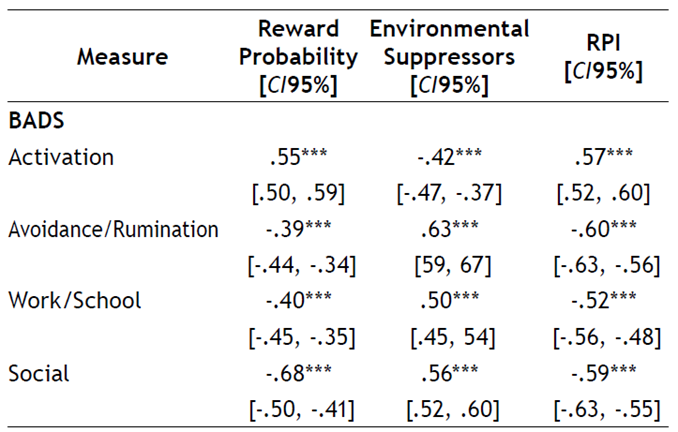
Note. BADS: Behavioral Activation Depression Scale (dimensions: Activation, Avoidance/Rumination, Work/School and Social); ***p < .001.
Discussion
The objective of this research was to analyse the psychometric properties of the RPI in a Colombian sample. We administered the RPI and another related instrument to a sample of 1129 adult participants. The validity evidence obtained through parallel analysis and Hull’s method regarding internal structure suggests a bifactorial structure with adequate CFI and RMSEA values. All items showed good loadings on the dimensions Reward Likelihood (>.34) and Environmental Suppressors (>.45). The indexes of unidimensionality (UniCo, MIREAL, and ECV) did not support a single-factor model of the RPI. With regard to the CFA, the two-factor mo-del presented in Carvalho et al. (2011) obtained a good fit to the data. The two-factor model also obtained a good fit in the French version of the RPI (Wagener & Blairy, 2015).
The measurement model of the RPI showed adequate construct reliability and convergent and discriminant validity. Specifically, the CFC was above .70, indicating that RPI has high construct reliability. In addition, all loadings were statistically significant (with values higher than .40), except for Item 19, which demonstrates convergent validity. As for discriminant validity, inter-construct correlations were lower than .80, and the values of the square root of AVE were higher than the correlation of the dimensions.
The complete RPI also obtained good internal consistency, according to a and ω coefficients (.88 and .89, respectively). The observed reliability was similar to that found by Carvalho et al. (2011) with the general population (a = .88). Likewise, the internal consistency of the two subscales was good (Reward Probability: .85 and .86; Environmental Suppressors: .83 in both indicators). Again, these results are similar to those reported in previous studies (Carvalho et al., 2011; Wagener & Blairy, 2015).
This study is the first in providing empirical evidence of the measurement invariance of the RPI across gender. It therefore adds to the findings put forward by Voss et al. (2021) on emerging adult drinkers, who found factorial equivalence across ethnic groups and education levels. Adding further evidence of measurement invariance is relevant because it allows the RPI scores of different groups of participants to be compared (Greiff & Scherer, 2018).
The RPI also showed convergent construct validity given the high magnitude of the correlations (i.e., > .70) with similar and conceptually-related constructs such as the perception of reinforcement (EROS), activation (BADS-Total), and depression (Zung-SDS). As expected, significant and positive correlations were found with the EROS and BADS. This indicates that the higher Response-Contingent Positive Reinforcement (RCPR), the higher the perception of environmental reinforcement and the level of activation or engagement in “healthy behaviours” (Manos et al., 2010). In terms of the proposal that low RCPR may be a critical factor in the etiology and maintenance of clinical depression, significant, negative, and large correlations were found with depression (Carvalho & Hopko, 2011; Lewinsohn, 1974). Thus, exposing oneself to rewarding activities or events is related to lower levels of self-reported depression (Armento & Hopko, 2007). This evidence of convergent construct validity suggests that the RPI can be used as a clinical indicator, especially in the intervention of depression or other disorders, as well as studies which seek to recognize the availability of reinforcement, the ability to obtain reinforcement, and exposure to aversive events (Ryba et al., 2014).
Some limitations of the present study are worth mentioning. Firstly, the psychometric properties of the RPI were ana-lysed in a nonclinical sample. Subsequent studies should analyse the functioning of the RPI in clinical samples in which RCPR is thought to play a relevant role. Secondly, the sample had a 3 to 1 ratio of women to men, meaning that the current findings can be better generalized to women. Secondly, the sample had a 3 to 1 ratio of women to men, meaning that the current findings can be better generalized to this population. However, this limitation is reduced given the measurement invariance that the two-factor model of the RPI demonstrated in this study. Thirdly, evidence of convergent construct validity was obtained only with measures related to depression. However, the RCPR could be useful in understanding problems related to ineffective instrumental behaviours and is related to other constructs such as exposure to aversive experiences, experiential avoidance (Dahl et al., 2004), and behavioural avoidance inhibition (Wagener & Blairy, 2015). Thus, exploring the relationship between the RPI and measures of these constructs might increase information on the convergent construct validity of the instrument. Fourthly, we have only explored the psychometric properties of the RPI in a sample from one Spanish-speaking country. Further studies should analyse the functioning of the RPI in other Spanish-speaking countries and analyse the measurement invariance across these samples. Lastly, this study did not obtain data concerning the sensitivity of the RPI to psychological interventions such as BA. Subsequent studies might analyse the treatment sensitivity of the RPI in interventions aimed at increasing RCPR.
To conclude, the present research reported on the adequacy of the two-factor model, the construct reliability and convergent and discriminant validity, the measurement invariance across gender, and the convergent construct validity of the RPI in a large Colombian sample. Further studies should analyse the psychometric properties of the RPI in other Spanish-speaking countries and clinical samples.

