English (pdf)
 Article in xml format
 Article references
 Send this article by e-mail
 Cited by SciELO
  Cited by Google
  Similars in
SciELO
Similars in
SciELO  Similars in Google
 Permalink
Introduction
Developing countries are particularly vulnerable to the impacts of climate change (IPCC, 2018), especially those populations that depend directly on natural resources, which tend to be more exposed and impacted (Olsson et al., 2014). International donors have pledged resources to increase adaptation capacity in developing countries, but how are these resources distributed at the sub-national and local levels? And how does this distribution take stock of future changes in climate patterns? In this paper, we address these questions using a case study of the allocation of adaptation aid in Ecuador.
The climate change adaptation paradigm has gained significant momentum on the global agenda since the Paris Accord in 2015 (Nalau, et al., 2015). This historic agreement has spurred commitments to enhance the resilience of local communities in the face of climate change. The IPCC has defined adaptation to climate change in human systems as the process of making adjustments in response to current or anticipated climate conditions and their impacts in order to mitigate harm or leverage advantages (Pörtner et al., 2022). Adaptation finance typically arises through bilateral or multilateral international financing transfers to developing countries and usually focuses on technical assistance and building adaptive capacity, decreasing sensitivity, or reducing exposure (Barnett and O’Neill, 2010; Barret, 2014).
In 2016, the world’s largest economies pledged to help low-income countries tackle climate change through mitigation and adaptation by providing aid (Manuamorn et al., 2020). However, it is widely recognized that resources allocated to support developing countries in their adaptation efforts have not met the commitments made since the Paris Accord5. Leading up to the 26th Conference of the Parties in 2021, on the inaugural day of U.S. President Joe Biden’s Leaders’ Summit on Climate Change, the United National climate chief emphasized the critical need for tangible evidence that this commitment would be fulfilled6 . The outcomes of COP 26 in October 2021 underscored that there remain several issues to be resolved before sufficient aid can be channeled to local communities as required to attain the global climate goals. However, progress appears to be jeopardized by shifts in geopolitics related to the effects of the COVID19 pandemic and Russia’s invasion of Ukraine in early 2022.
Given the importance of international funding for formulating and implementing climate adaptation actions, it is crucial to assess whether countries are effectively directing this aid toward enhancing the adaptation capacity of vulnerable populations and those anticipated to be impacted in the future. The allocation of adaptation aid is particularly relevant at the sub-national level, where the majority of forthcoming adaptation initiatives are expected to focus on accelerating progress toward the SDGs7.
Thus, the primary question driving this paper is twofold: What are the drivers for the allocation of climate aid at sub-national and local levels, and what are the geographical patterns of this allocation? We identify the main drivers by considering projections of the effects of climate change at sub-national level along with existing rationales for the allocation of adaptation aid. In doing so, this article identifies areas with adaptation needs that may be underserved and offers explanations for this discrepancy. Ecuador was chosen as a case study because it has defined precise mechanisms for the allocation of international aid across levels of government. This structured approach potentially reduces the influence of certain political factors in aid allocation (e.g., local clientelism), facilitating a deeper exploration of the impact of local policy, administrative capacities, and socioeconomic vulnerability.
The article is divided into four sections. In Section 1, we establish the theoretical background of climate justice and the allocation of adaptation aid. We pinpoint the factors typically associated with the distribution of such aid. Section 2 outlines the quantitative methodology used to explain how adaptation aid is distributed across sub-national jurisdictions in Ecuador. In Section 3, we present the findings and discussion of the data, highlighting the role of projected physical vulnerability in the allocation of adaptation aid and its spatial distribution. Finally, in the conclusions, we underscore the implications of our study for decision-making processes and outline potential avenues for future research on the issue of adaptation and climate justice.
2. Theoretical background: the allocation of adaptation finance
Climate change affects populations differently due to many factors rooted in economic and social injustices (van Wesenbeeck et al., 2016) that are often race-, gender-, or class-based in nature. Some populations are systematically exposed to higher variations in temperature and precipitation, resulting in crop losses or excess water availability that sometimes destroys infrastructure (Li et al., 2021; Mills-Novoa et al., 2022). Others face greater barriers in accessing technology or to financial resources to diversify their sources of income. Thus, the allocation of financial resources to address the impacts of climate change must be approached as a matter of justice issue.
For over two decades, the term climate justice has been used to address and contest unequal exposure to climate change impacts, differential responsibility for its causes, and exclusions of certain groups from the key arenas acting on the issue. This body of literature underscores that if inequalities in climate change adaptation are not factored into the design, implementation, or evaluation of public interventions, they may prove ineffective or, in some cases, exacerbate the vulnerability of the very populations they aim to assist (Eriksen et al., 2021). “Getting adaptation right” for present and future generations is a growing concern among scholars of climate change and social justice (see Schlosberg and Collins, 2014). In particular, sustainability policy requires that politicians recognize the right time to act, often entailing the initiation of measures that will only yield effects in the medium or long term (Klauer et al., 2013).
The existing literature suggests that vulnerable countries do receive more adaptation aid for projected climate change, but the extent to which this is true is debated. Betzold and Weiler (2017) found that countries facing higher exposure to climate change risks receive more adaptation aid, both on a per capita basis and as a percentage of all adaptation aid. Weiler et al. (2018) also found that countries with greater physically exposure to climate change tend to receive more adaptation aid per capita, as do poorer countries, small island developing states, and least developed countries.
In contrast, Saunders (2019) found that, on average, countries most vulnerable to climate change receive smaller allocations of adaptation finance from bilateral donors than their less vulnerable counterparts. Donner et al. (2016) found that tracking adaptation aid is problematic, as there is no clear definition of what separates adaptation aid from standard development aid.
In sum, while there is some evidence indicating that vulnerable countries receive more adaptation aid, the extent to which this holds true remains a topic of ongoing debate.
Given the predominantly localized impacts of climate change, such as changes in precipitation patterns and temperatures, much of the policy development on climate adaptation and related actions have unfolded at the local level (Vogel and Henstra, 2015). The diversity of conditions to which local populations are exposed highlights the importance of designing adaptation initiatives that take stock of the specific physical, social, economic, and political factors contributing to vulnerability to climate change.
The extensive and varied body of literature that quantifies sub-national resource distribution of foreign aid indicates that emerging patterns can be explained by a combination of recipient needs, and recipient merits. In the remainder of this section, we review how these factors affect the allocation of adaptation aid and present the hypotheses that will guide our empirical analysis.
The needs of the recipients relate to the presence of physical and socioeconomic vulnerabilities. The former arises from alterations in precipitation dynamics (Brown et al., 2017; Wang et al., 2018) and temperature fluctuations (Pokorná et al., 2018; Yu et al., 2019). For example, in South America, changes in precipitation patterns have increased episodes of floods and droughts (Torres-Batlló and Martí-Cardona, 2020). Numerous studies have indicated that adaptation aid levels increase in jurisdictions with higher physical vulnerability (Barret, 2013; Berrang-Ford et al., 2014; Weiler et al., 2018). Hence, our first hypothesis (H1) posits that there will be a positive association between higher levels of physical vulnerability and increased levels of adaptation aid in sub-national and local jurisdictions (H1).
While the impacts of climate change continue to manifest globally, experts project that many of the most severe impacts will unfold in the decades to come (Pörtner et al., 2022). Given the crucial role of models and projections in designing effective adaptation policies (Warnatzsch and Reay, 2019), we anticipate a positive correlation between higher projected levels of physical vulnerability and current levels of adaptation aid (H2).
The second aspect of the recipient needs relates to socioeconomic vulnerability, often rooted in fundamental development deficiencies such as low income, limited access to quality services, and job instability. In his study of aid allocation at sub-national level in Bangladesh, Dipendra (2020) found a positive correlation between socioeconomic needs and aid allocation. Likewise, Barret’s study of the allocation of sub-national adaptation finance in Malawi indicated that adaptation finance tends to be directed towards districts with low socioeconomic climate vulnerability (Barret, 2013). Thus, we anticipate that low socioeconomic levels will be associated with higher levels of aid allocation (H3).
Regarding recipients’ merits, it is important to recognize that institutional failure is one of the main enhancers of the adverse effects of climate change. Institutions play a crucial role in implementing adaptation measures. However, institutions in many vulnerable regions, which are often concentrated in developing countries, can be characterized by instability and unreliability (Steinberg 2012). As a result, there have been calls for development aid to concentrate on enhancing adaptive capacity to alleviate the worst of the vulnerabilities to climate change (Juhola et al., 2016; Scheraga and Grambusch, 1998; Schlosberg and Collins, 2014).
The local level plays a key role in addressing adaptation-related concerns, such as land-use planning. Here, local stakeholders can exchange knowledge about place-based exposure and sensitivity to climate risks. However, local capacity for policy formulation and implementation is highly variable. In Latin America, this capacity is considered low because States tend to be highly centralized. Politicians and officials tend to prioritize patronage in their interactions with sub-national units, which in turn have limited access to financial resources for sustaining independent policy initiatives (Eakin and Lemos, 2006; Méndez, 2020).
Institutional capacity plays a pivotal role in determining access to climate funds (Garschagen & Doshi, 2022), as it allows recipients to meet with the many technical requirements imposed by donors (Amerasinghe et al., 2017; Tanner et al., 2019). Extensive research in the field of environmental governance highlights the importance of local capacity in effectively utilizing aid financing to advance environmental goals (Andersson and Ostrom, 2008; Oliveira, 2002). In these studies, local capacity includes but is not limited to planning, control, oversight, and securing the participation of relevant stakeholders in decision-making and accountability (Aranha, 2017; Mason, 2000; Shah and Thompson, 2004). Drawing from this literature, we expect higher levels of local policy and administrative capacity to be positively associated with higher levels of adaptation aid (H4).
Indeed, local absorptive capacity encompasses more than just the policy and administrative capacity of the public sector. Numerous studies on development aid and environmental decentralization have demonstrated that the degree of organization or the density of civil society also play a significant role in allocation decisions. A well-organized civil society can exert political pressure on sub-national governments to prioritize problems related to climate change and can actively contribute to implementation efforts and oversight (Andersson and Ostrom, 2008; Appe and Pallas, 2018). Hence, our fifth hypothesis (H5) posits that higher levels of local absorptive capacity, will show a positive association to higher levels of adaptation aid.
3. Methods
This section provides the context and specifies the rationale for the case selection by framing Ecuador´s situation regarding climate change and adaptation aid. It then describes the dependent and independent variables and the sources of data.
3.1 Case selection
Ecuador, situated on the western coast of South America, covers an area of approximately 283500 km2 and shares its borders with Peru to the south and Colombia to the north (Figure 1). The country boasts a wide range of climate zones and an extraordinary array of geographical systems, ranging from high-altitude glaciers to tropical rainforests in the upper tributaries of the Amazon, and from dry tropical forests on the Pacific Coast to the Galapagos Islands, which stand as an insular outpost in the Pacific. Many of Ecuador’s ecosystems are highly vulnerable and have already shown great sensitivity to climate variability and long-term change (Savo et al., 2016). As these regions face increasing pressure from shifting climate patterns and other direct and indirect factors (i.e., deforestation, agricultural and livestock practices), they will likely deteriorate, leading to a decline in the quality of environmental goods and services8.
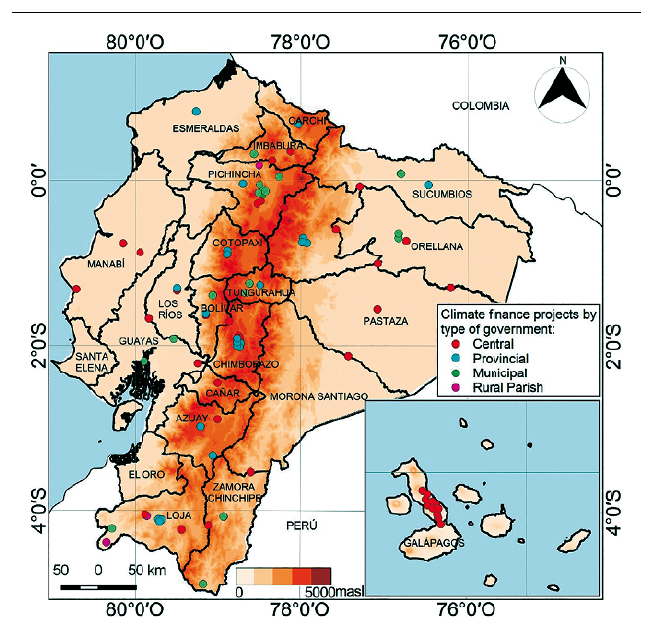
Figure 1. Ecuador’s political division, altitude, and spatial distribution of climate finance projects executed by type of government, period 2008-2019
Furthermore, the Ecuadorian territory is highly susceptible to extreme weather events, particularly flooding due to increased rainfall in the El Niño phenomenon and increased aridity during La Niña. These phenomena have resulted in substantial loss of life and infrastructure, exerting a lasting adverse impact on the economy (Demoraes and D’Ercole, 2001).
Ecuador has a multi-level system of governance comprising four interconnected tiers: national, provincial, municipalities and rural parishes. Despite the legal framework’s promotion of decentralization, the concentration of power primarily lies with the head of the national government mainly through their control over fiscal resources (Dávila et al., 2018; Ortiz et al., 2017). Moreover, between 2008 and 2018, the national government bolstered its control over the allocation of international cooperation funds via a nationalistic approach in which projects are required to align with the national development plan, which is defined every four years (Chiriboga, 2015). Sub-national and local governments in Ecuador have the authority to manage resources from international cooperation and are obligated to report their use to the national government.
Ecuador is home to various ethnic groups; however, poverty falls unequally among the indigenous population (87%) and in rural areas (96%). For non-indigenous peoples (mestizo, white and afro-Ecuadorian,) poverty rates are 61%. In high-poverty areas, public services for health, education, and sanitation are scarce, and labor is remunerated with low wages. Over the past five decades, cities have received an influx of migrants from rural areas, contributing to increased poverty rates in urban areas (Villacís et al., 2011).
These characteristics create incentives for the national government and international cooperation agencies and their allies to allocate adaptation funds in Ecuador, which has historically been an early adopter of all forms of cooperation for climate change initiatives (see Carmin et al., 2012). In 2009, the Government of Ecuador declared climate change adaptation and mitigation as national priorities through Executive Decree 1815. The Ministry of Environment was made responsible for formulating and implementing a national strategy and plan. Ecuador defined a National Climate Change Strategy 2012-2025 that laid out the strategic and institutional foundations for designing national climate change plans accross prioritized sectors, with a focus on building capacities. The National Climate Change Plan for 2015- 2018 prioritizes the following sectors: agriculture and other land uses, water, ecosystems, energy, risk management, and capacity building. These documents are aligned with the National Development Plan, which is renewed every four years and serves as the overarching framework for International Cooperation funding. The National Climate Change Strategy 2012-2025 was also formulated to achieve outcomes in both adaptation and mitigation. Ecuador submitted its Nationally-Determined Contributions to the UNFCCC in 2019 and its Third National Communication to the UNFCCC in 2017.
3.2 Variables and data
In this research, the allocation of economic aid for adaptation to climate change was used as a dependent variable, and climate vulnerability (socioeconomic and physical) and local capacity as independent variables.
3.2.1 The allocation of financial aid for adaptation to climate change
This study uses a database constructed from primary four sources: first, the registry of international cooperation projects maintained by the Ministry of Foreign Relations, which records projects by donor country or organization, the implementing agencies, and the amount invested. A subset of climate change-oriented projects (covering both mitigation and adaptation) was extracted from this database for 2008-2019. One researcher codified this registry in two waves to identify whether projects were labeled as climate change, related to mitigation or adaptation, or had climate change components but no label (see Díaz, 2021).
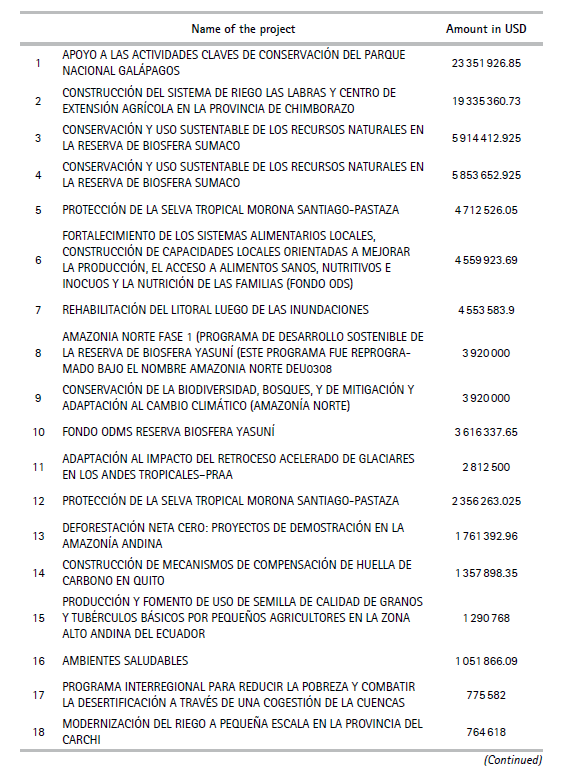
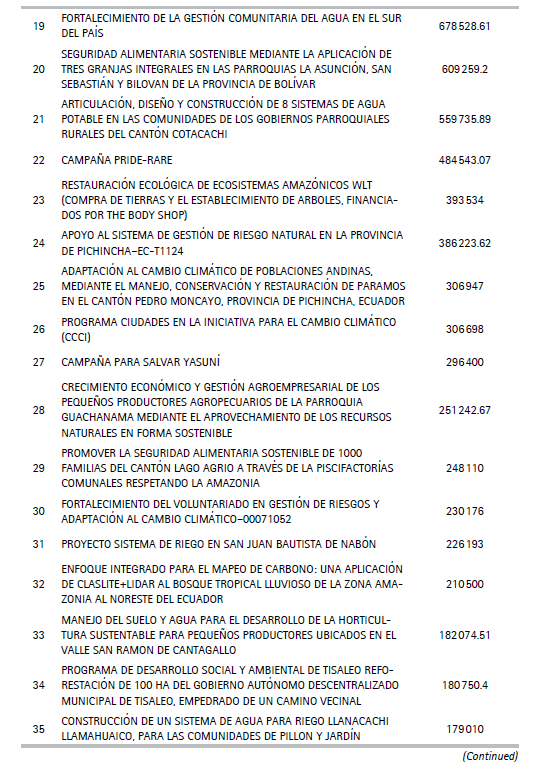
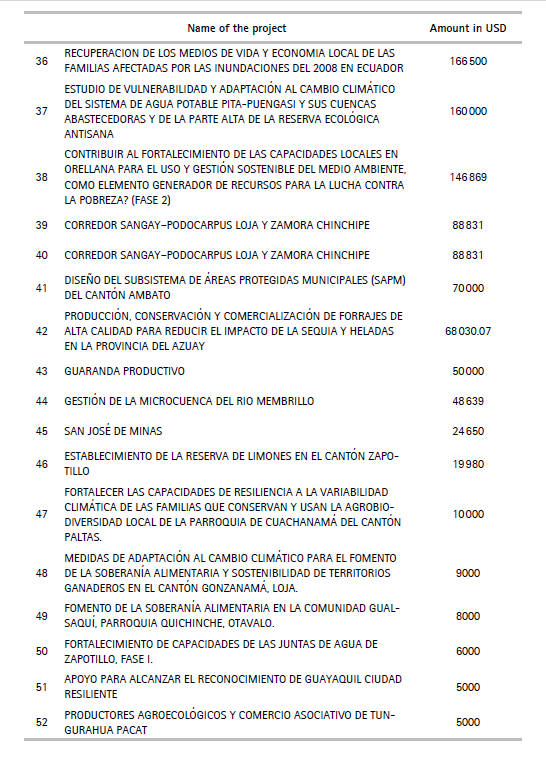
The registry contains 167 projects channeled mainly by multiple agencies through the national government (90%). These projects are strategically aligned with eleven categories defined by the national government: natural patrimony (protected areas), hydrological patrimony, food sovereignty, agriculture and cattle, human settlements, health, productive and strategic sectors, land use, agriculture, energy, industrial processes, and waste management. A subset of 52 projects is dedicated to climate adaptation specifically but include water provision for human consumption and irrigation, disaster relief, environmental planning, mechanisms for offsetting carbon footprints, biodiversity conservation, and restoration. Of this subset of projects, 50.9% were implemented by the national government, 18.9% by provincial governments, 24.5% by municipalities, and 5.7% by the rural parishes (Figure 1). Roughly 88% of these projects fall under non-reimbursable and technical cooperation categories and 12% under debt swaps. The allocation of adaptation aid was calculated for all sub-national jurisdictions using the natural logarithm of the average of adaptation aid received between 2008 and 2019 per 10.000 inhabitants.
3.2.2 Variables related to physical vulnerability
To measure physical vulnerability, we considered areas facing threats of flooding or drought (Demoraes and D’Ercole, 2001), dry days (droughts), days with extreme rainfall, and periods of high temperatures. This assessment spanned from 1981-2015, and included projections for high temperatures, droughts, and rains based on the Representative Concentration Pathway Scenario: RCP 4.5. This scenario represents an optimistic response to stabilizing the anthropogenic components of radiative forcing by 2100 (Thomson et al., 2011). There are multiple limitations to meteorological data in Ecuador. Among these is the fact that the existing operational network of the national weather service is not capable of reproducing the complex patterns of precipitation in the Andes (Rollenbeck and Bendix, 2011). However, despite the limitations, authorities and researchers alike have not validated satellite data in this context. Consequently, this paper does not undertake further robustness testing related to this data source.
3.2.3 Variables related to socioeconomic vulnerability
Socioeconomic vulnerability is measured using a battery of indicators, including the Theil Index, the Human Development Index, poverty by consumption, income, unmet basic needs, total population, population of women, rural population, literacy rate, rate of infant mortality and nemployment rate. Socioeconomic data were extracted from the National Institute of Statistics and Census databases for the 2000-2016 period.
3.2.4 Variables related to local capacity
As indicated above, the institutional capacity of local governments is considered an essential driver for the allocation of adaptation finance. To assess this capacity, we utilized a survey on institutional capacity conducted by the Consejo Nacional de Competencias in collaboration with sub-national governments (provincial, municipal, and rural parish) in 2016. This survey contains data for institutional capacity divided into five broad categories: planning, finance, administration, regulation and control, and governance. Based on these categories, the National Council of Competencies (CNC) constructed an institutional capacity index, where equal weight was assigned to each indicator within the aforementioned categories.
Finally, data on the level of organization of civil society at the sub-national level was extracted from the Information System of Civil Society Organizations9. The total number of organizations per province in 2021 was used as a proxy for the potential political demand for climate change actions.
3.3 GWR model
Geographically weighted regression (GWR) is a traditional regression-based spatial statistics technique that incorporates local spatial weights and calibrates a set of local linear models for any number of nearby data locations (Ciotoli et al., 2017; Warsito et al., 2018; Zhou et al., 2019). GWR allows the modeling of non-stationary spatial relationships (e.g., climate, demographic factors, physical environment characteristics) in geographic data. Unlike OLS, which assumes that the regression coefficients are constant throughout the spatial domain, GWR allows for the estimation of local coefficients that vary according to geographical location. Hence, employing GWR instead of OLS is a viable option when there is suspicion that the relationship between the dependent variable and the independent variables may vary in different parts of the geographical area. Furthermore, GWR proves beneficial when the data exhibit heterogeneous spatial patterns, indicating significant variable value fluctuations across various parts of the geographical area. Finally, GWR is a valuable tool when the goal is to identify the geographical areas where the relationship between the dependent variable and the independent variables is either stronger or weaker. In sum, this procedure allows local as opposed to global models of relationships to be measured and mapped (Fortheringhtam et al., 2002; Oshan et al., 2019;) and can be expressed as follows:
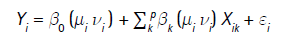
where,
Yi: dependent variable at location-i,
(µi vi): coordinate for location-i,
β0 (µi vi): intercept location-I,
βk (µi vi): coefficient for independent variable k at location-i,
Xik: Independent variable at location-i,
εi: Residual location-i
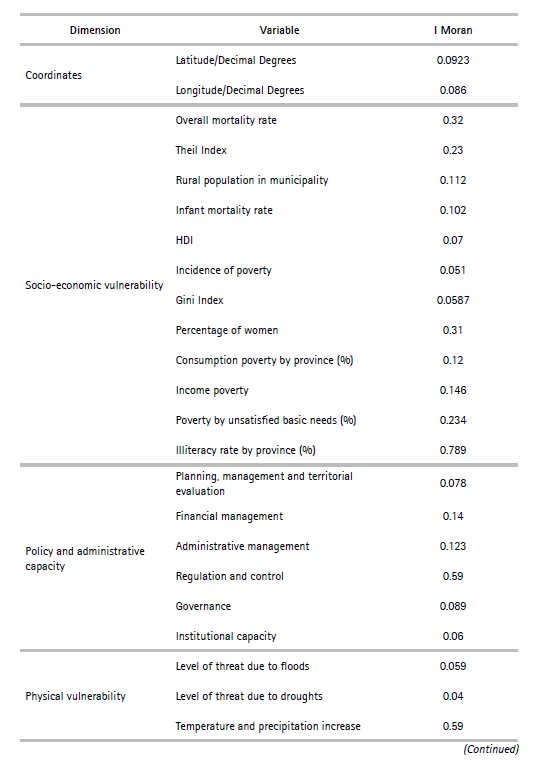
The variables considered in the analysis were subjected to the assumptions of normality, linearity, and multicollinearity, to verify whether the data follow a normal distribution and to avoid collinearity between pairs of explanatory variables or multicollinearity between more than two variables in the regression analysis (Fotheringham and Oshan, 2016; Hawkins, 1973; Wheeler and Tiefelsdorf, 2005). Also, the spatial autocorrelation in the distribution of the variables was evaluated using the Moran Index, showing no spatial autocorrelation. Subsequently, predictive variables were selected using the step regression method, which is a combination of forward selection and backward elimination (Ghani and Ahmad, 2010) under a significance level p ≤ 0.1. Step-by-step selection methods include or exclude variables by generating a different model in each iteration. Finally, the selection of the best model was based on the adjusted R2 and the Akaike Information Criterion (AIC). The first measures the performance of the model and corresponds to the square of the correlation coefficient between the predicted and observed values. The second is a measure of model performance and is helpful in comparing different regression models. It is considered a good model when there is minimal data loss; that is, the model with the lowest AIC value provides a better fit to the observed data (Akaike, 1974).
The construction of the economic aid allocation model for climate change adaptation in Ecuador using GWR covered 39 jurisdictions where climate adaptation projects are located. These jurisdictions comprised 20 provinces (Figure 1), 12 municipalities (Ambato, Cotacachi, Gonzanama, Guaranda, Guayaquil, Lago Agrio, Orellana, Pedro Moncayo, Quito, Tisaleo, Zamora, Zapotillo) and seven rural parishes (Guachanama, Limones, Quince, San José de Minas, Jipijapa, Quichinche, Zhud).
4. Results
4.1 Models for the allocation of adaptation aid
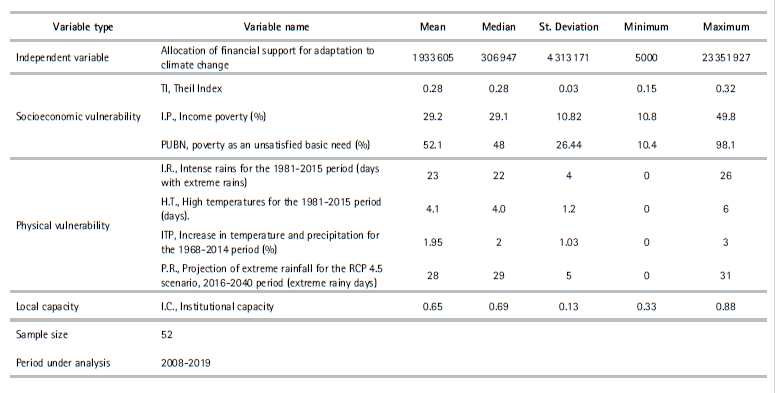
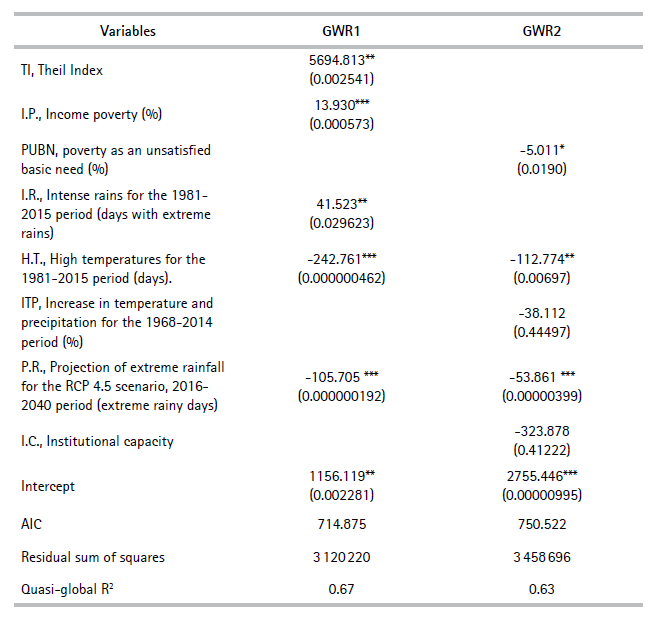
Regarding the allocation of economic aid for adaptation to climate change in the 2008-2019 period, the data reveal a total value of $98613869, with notable variations among projects. The highest funding allocation amounted to $23 351927 and was directed towards biodiversity conservation and restoration projects (Province of Galapagos) and the lowest was $5000 (Municipality of Guayaquil) for an environmental planning project the average is average of $1 933605 for water supply projects for human consumption and irrigation other projects include disaster response, environmental planning, and carbon footprint compensation mechanisms. Table 1 provides a comprehensive overview summary statistics for all dependent variables considered in the two best GWR models.
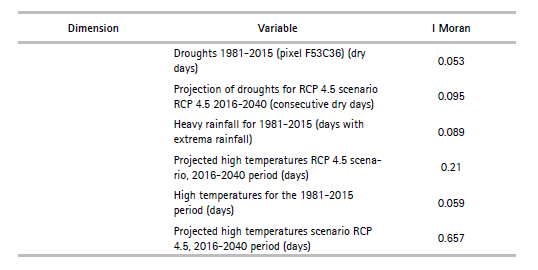
GWR made it possible to determine two models for the allocation of economic aid for climate change adaptation based on variables related to physical and socioeconomic vulnerability and local capacity. These two models were selected because they achieved the lowest AIC (<751) and the highest R2 and adjusted R2 (>0.6), which means that more than half of the variability of aid allocation is explained using only five variables (Table 2). Some of the variables excluded from these models include those that serve for socio-demographic control such as total population, population of women, rural population, and unemployment rates.
The GWR1 model shows that most variables positively influence (p<0.05) the allocation of adaptation aids. For each unit of change of TI, I.P., and I.R. there is an increase in the average score of the allocation of economic aid for climate adaptation of $5694.81, $13.93, and $41.52 respectively. However, a one-unit increase H.T. and P.R. results in a $242.76 and $105.71 decrease for financial aid. For the GWR2 model, all variables negatively influence (p<0.1) the allocation of aid for adaptation. Each unit of change of PBUN, H.T., ITP and P.R. results in a decrease in the average score of the allocation of economic assistance for climate adaptation of $5.01, $112.77, 38.11, and $53.86 respectively (Table 2).
Table 1. Summary statistics for all dependent and independent variables selected in the two GWR models.
4.2 Allocating adaptation aid where it matters?
Based on five variables, two related to socioeconomic vulnerability and three to physical vulnerability, the GWR1 model explains 67% of the variability for the allocation of economic aid for adaptation to climate change in sub-national and local jurisdictions in Ecuador. Similarly, with five variables, the GRW2 model explains 63% of the variability; however, this model includes one variable related to local capacity, one to socioeconomic vulnerability, and three to physical vulnerability.
According to GWR1, both physical vulnerabilities have a mixed influence on the amount of adaptation aid allocated in sub-national and local jurisdictions.
More specifically, those jurisdictions that reported heavy rains in the period 1981-2015 (I.R.) receive more aid. For each unit of change of I.R. namely, the number of days with extreme rains, the average score of the allocation of economic aid for climate adaptation increases by $41.5. In stark contrast, climatic variables such as observed high temperatures (H.T.) and extreme rainfall projections under the RCP4.5 scenario for 2016-2040 (P.R.) are negatively associated with adaptation aid. For each unit of change of P.R. namely, the projected number of days with extreme rains, the average score of the allocation of economic aid for climate adaptation decreases by $105.7. On the socioeconomic dimension, those jurisdictions—which, on average, have higher inequality (TI) and more poverty (I.P.)—also receive more aid. Finally, local capacity, both in terms of policy and administrative capacity and organizational level, was not associated with the level of adaptation aid allocated. In short, the GWR1 model offers partial support for H, 1full support for H3, and no support for H2, H4, and H5.
Table 1 illustrates that the GWR2 model reveals a consistent negative influence of all variables on the allocation of adaptation aid. In the GWR2 model, jurisdictions characterized by lower values of observed high temperatures (H.T.), extreme rainfall projections (P.R.), and increases in temperature and precipitation (ITP), poverty due to unsatisfied basic needs (PUBN), and local capacity (I.C.) tend to receive greater amounts of aid for adaptation. Specifically, each unit of change of PBUN, H.T., ITP and P.R. results in a decrease in the average score of the allocation of economic aid for climate adaptation by $5.01, $112.77, $38.11 and $53.86 respectively. In summary, the GWR2 model does not support any of the hypotheses raised as sub-national and local jurisdictions with more significant physical and socioeconomic vulnerability and greater institutional capacity receive less economic aid for adaptation.
4.3 Spatial distribution of climate the allocation of adaptation aid in sub-national jurisdictions in Ecuador
For the analysis of the spatial distribution, the GWR1 model was selected due to its lower AIC and a higher Quasi-global R2 , indicating superior model quality. In addition, all the variables in GWR1 are statistically significant for a p<0.05.
The spatial distribution analysis conducted through the GWR technique shows the spatial variation of the association between the variables in the model. In Figure 2, the areas in red indicate a relatively high allocation of adaptation finance in the country’s central region (provinces of Chimborazo, Napo, Imbabura, Los Ríos y Orellana) and Galápagos. This diverse set of areas presents a vulnerability to floods (Los Ríos), high density of poverty (Chimborazo), and the presence of clusters of protected areas (in Imbabura, Napo, Orellana, and Galápagos) as well as the presence of extractive activities (Napo, Orellana). The areas in dark blue (low-low group) identify provinces, municipalities, or rural parishes that receive less adaptation aid than the rest of the sub-national and local jurisdictions. The largest of those areas are located in the Gulf of Guayaquil, an area with high exposure to sea-level rise and the dry areas in the provinces of Manabí and Loja where droughts are frequent. The light blue zones (low-high group) represent jurisdictions receiving less adaptation aid than neighboring areas despite facing similar challenges, highlighting disparities in aid distribution. This is the case for example of the province of Esmeraldas, located at the very northern tip of the country, on the Pacific Coast and adjacent to Imbabura. Some jurisdictions in Imbabura receive higher amounts of adaptation aid than its neighbors in Esmeraldas although they show similar levels of inequality (see Figure 3a), are part of the same watershed (Cayapas River watershed) and harbor the same protected area (the Cotacachi-Cayapas Ecological Reserve).
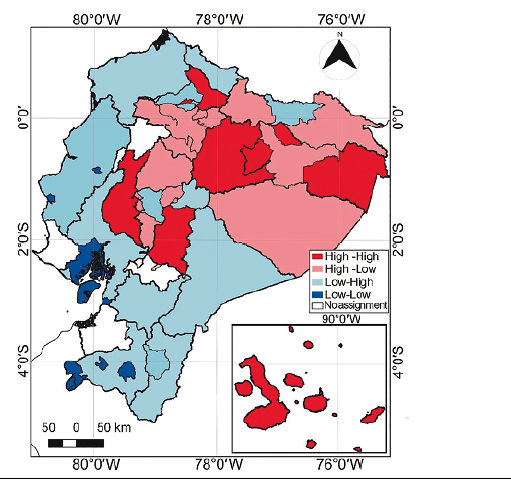
Figure 3 shows the spatial distributions of clusters for the local coefficients of each independent variable of the GWR1 model. More specifically, Figure 3a shows a positive correlation between inequality (I.T.) and aid allocation (dependent variable), with the greatest inequality generally present in the northwestern part of the country. Figure 3b also shows a positive correlation, with the highest values of the income poverty coefficient (I.P.) present in the dry and arid jurisdictions of the central region and southern provinces, respectively. In the central region, there is a greater effect of the extreme rainfall (I.R.) observed (Figure 3c), which is correlated with higher amounts of adaptation aid. Finally, figures 3d and 3e show negative correlations between the coefficients of the projections of extreme rainfall (P.R.) and historical maximum temperatures (H.T.) with the dependent variable. As the mean values of these independent variables increase, the mean values of adaptation aid decrease. The areas with the highest values for both coefficients are located in the northeastern and southern parts of the country.
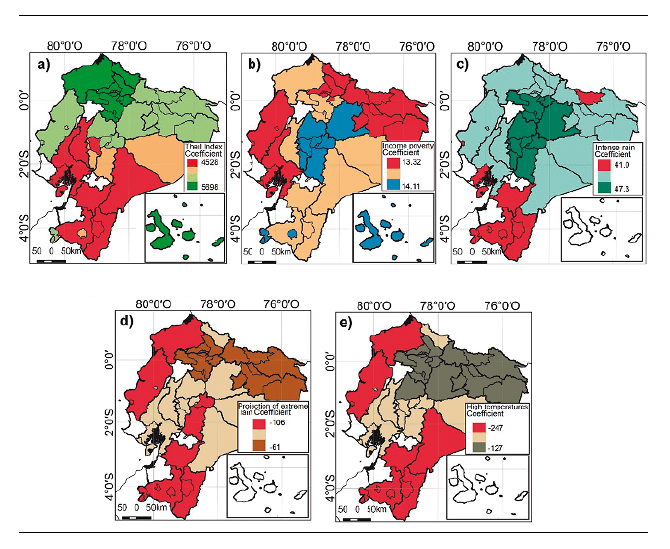
Figure 3. Coefficients for the GWR1 model for adaptation aid: a) Theil Index, b) income poverty, c) intense rain, d), Projection of extreme rain for the RCP4.5 scenario (2016-2040) and e) high temperatures. The jurisdictions in white did not exist before 2010 or have no projects reported in the database.
5. Discussion
This paper delves into the distribution of climate adaptation aid within Ecuador’s sub-national and local contexts, aiming to assess whether this distribution effectively considers both current and projected climate change patterns and their geographical distribution. The objective is to identify spatial and generational disparities that may need to be addressed by policymakers and international donors working to increase adaptation capacity.
Although the study of the observed variables shows similar results to previous findings of sub-national adaptation finance, it also reveals noteworthy distinctions and some unexpected findings. First, as reported in other contexts (see Barnett, 2014; Dipendra, 2020), physical vulnerability influences the allocation of adaptation aid; however, data suggest a positive bias towards jurisdictions where rainfall is historically intense. Episodes of flooding in the coastal lowlands and mountain riverine floods on the Andes mountains are frequent and often associated with urban development, deforestation and other land use change as well as poor flood risk management (Burgos Choez et al., 2019; Pinos & Timbe, 2020; Sierra et al., 2021). In some of these areas, some local governments, municipal water utilities, private land owners and communities are acquiring land to secure water provision and reduce the risk of such events (Echavarría, 2012; Kauffman, 2014). However, the local effects of climate change are still only poorly understood as more site-specific climate data is still lacking (Cadilhac et al., 2017).
Despite the positive bias towards intense rainfall, projections of extreme rains show a negative relationship with the amounts allocated for adaptation. Our findings suggest that existing actions are not taking stock of future physical vulnerability and thus leaving future generations exposed to the effects of climate change. This phenomenon could be attributed to the lack of precise climate data, but it might also be influenced by the inertia of past decisions and the prioritization of short-term political interests. Nevertheless, maintaining the current trend is problematic because as the effects of climate change intensify and changes become irreversible, some jurisdictions may be ill-prepared to assist regions in need and might be currently using resources that could be best allocated elsewhere to secure effective adaptation to future changes. In essence, the current approach, which prioritizes regions with a history of extreme rainfall events, runs the risk of generating maladaptation—an outcome where decisions aimed at improving adaptive capacity or reducing vulnerability inadvertently yield more negative than positive effects (Barnett and O’Neill, 2010).
Second, in line with findings from other contexts (Barrett, 2013; Dipendra, 2020), socioeconomic vulnerability to climate change influences the allocation of adaptation finance. However, it is crucial to emphasize that some of these areas have been recipients of a great share of international development cooperation in the past and have not yielded the expected results. The prime example is the province of Chimborazo, which hosts some of the most impoverished indigenous communities and some of the highest concentration of international aid in the country (Bretón, 2002). This underscores the importance of fostering innovative approaches for the inclusive design and implementation of adaptation actions innovations are essential to prevent the mere symbolic incorporation of climate concerns into existing ineffective environmental interventions (see Böhmelt et al., 2016) and the continuation of ineffective development projects.
Third, in contrast to the findings reported by Barrett (2013) and Dipendra (2020), the model with the best fit does not contain a term for local capacity. This finding suggests that decisions about the allocation of international cooperation resources may be ultimately made at the central level, where considerations of local capacity are not always taken into account when approving climate related projects. However, other dynamics, such as complex national-sub-national networks of patronage, may be also at play. Moreover, this finding raises questions about the capacity of currently or potentially affected local communities to play a leading role in the policy processes that address climate change. It also calls for more in-depth studies of local capacity that take into account the intricate negotiations involved in climate change interventions among donors, the national government, and the recipients.
Another potential explanation for this finding relates to the quality of the data used as proxies for the independent variables. The institutional capacity index was built by the public organization in charge of supporting sub-national governments to increase their capacity. The I.C. database shows some surprising figures of high capacity in very small municipalities and relatively low capacity in bigger municipalities that manage more complex issues and have more resources available. Moreover, the index used for this research has been discontinued and a new one is being designed making it impossible to use an alternative measure of institutional capacity. In addition, data on the level of organization of civil society includes all kinds of organizations, not only those that may have purposely stated an interest in climate change, development, poverty, or environmental concerns. Thus, this proxy could be skewing the social demand for climate finance in some jurisdictions and hence the level of political pressure put on local decision-makers to allocate adaptation funds.
The thematic and spatial distributions of adaptation aid speak of a lack of anticipated actions that may affect the capacity of certain types of populations to adapt to climate change in the future. Failure to invest resources and develop capabilities to reduce vulnerability to extreme rains is concentrated among vulnerable populations in the northwest, where most of the Afro-Ecuadorean and the biodiverse Chocó ecosystem are under siege by the development of the palm oil industry and illegal mining (Parra, 2019). Additionally, indigenous and peasant communities, as well as urban settlements in the Amazon, are also affected. This distribution reproduces historical patterns of marginalization of regions where state presence and capacity are extremely low and where some of the most aggressive expansion of extractive activities are taking place (Lapierre and Aguasantas, 2018). Paradoxically, these regions hold substantial potential to contribute to the global climate agenda, particularly in terms of carbon sequestration.
Finally, future studies should strive to include a broader spectrum of stressors extending beyond climate change, as alterations in precipitation could also be related to ongoing deforestation and other factors. In addition, other factors, such as time, that were not assessed in this paper may be relevant for future analysis. Researchers could use a panel design to evaluate the cumulative effect of adaptation projects in sub-national jurisdictions. This approach could reveal whether some form of learning or path dependence exert influence on the allocation of adaptation aid.
6. Conclusions
The present study suggests that existing climate adaptation finance in Ecuador is biased towards the current generations, which are vulnerable to experiencing intense rains. Future generations and risks associated with high temperatures receive less attention than problems related to intense rains, although the former is likely to be salient in the future. To align with the principles of equity outlined in the UNFCCC, it is imperative that strategies aimed at mitigating the impacts on local-level stakeholders take into account the anticipated consequences of climate change on future generations.
In this regard, devising strategies and projects with jurisdictions that will face the risks of climate change in the future should receive more attention in the allocation of adaptation aid. As highlighted by Eriksen et al. (2021), retrofitting adaptation measures into existing development agendas is not enough to improve adaptation or avoid maladaptation (see also Barnett and O’Neill, 2010). A more localized approach to the formulation of adaptation policies may help consider the inevitable and irreversible changes in the present to avoid relying on potentially more extensive and more costly interventions in the future.
The findings of this study confirm the importance of global calls to localize climate and development goals effectively to produce more favorable policy outcomes. Localization could help take local conditions into account provided that it entails a concurrent focus on devolving authority, transferring financial resources, and enhancing local capacity creation. However, this requires ambitious and complex climate policies underpinned in true multi-level and cross-sectoral structures for decision-making that systematically consider territorial and generational inequalities.