


 English (pdf)
 Article in xml format
 Article references
 Send this article by e-mail
 Cited by SciELO
  Cited by Google
  Similars in
SciELO
Similars in
SciELO  Similars in Google
 Permalink
INTRODUCTION
Colombia has been identified as an agricultural country with a great variety of biological material. This country produces diverse fruits, vegetables, medicinal plants and, recently, nutraceuticals, such as microalgae, for local consumption and export. This activity is mainly concentrated in rural areas, where the transportation and energy infrastructures in some regions are inadequate, leading to a reduction in crop quality (Subramaniam, 2016). In addition, the struggle to access new and efficient conservation technology limits farmers’ options in preserving crop quality. Drying operations, cold chains, and microbial disinfection, among other postharvest processes, are necessary to increase the shelf life of biological materials once they are harvested (Subramaniam, 2016). However, it has been reported that due to nonoptimal equipment designs, the energy consumption of these operations is high, and the quality of the final product is usually compromised (Salami et al. 2010). The design of agro-industrial equipment that extends the useful life of biological products as dryer, and cold rooms is typically implemented with empirical correlations or simply based on practical knowledge bases that, though significant, often omit important phenomena. Therefore, these devices are inefficient in both energy use and unit operation performance, which can affect the final quality of the product (Precoppe et al. 2015). Air distribution in dryers should be addressed in different ways, to fill the design, optimization and scale up gap.
With the emergence of higher computational efficiencies, it is now possible to use computational fluid dynamics to solve problems involving mass, energy, and momentum transport equations in computer aided design (Parpas et al. 2018). Although computational fluid dynamics - CFD has been widely used in the automotive and aerospace industries, its use has been limited in agroindustry. Moreover, coupling CFD with the design of experiments - DOE method that is normally applied for in vivo checks can generate complete integration in computer aided design when coupled with in silico experiments.
For example, the coupling between response surface methodology - RSM and CFD has recently been used in the optimization of solar heaters (Qader et al. 2019), miscible liquid mixers (Mansour et al. 2020), and bubble columns (Gholamzadehdevin & Pakzad, 2019). The coupling of CFD with the design of factorial type experiments has also been reported to study the relationships among the configuration of a ring baffle (Samruamphianskun et al. 2012), the hydrodynamic phenomena of a reactor and the use of response surfaces in the design of cooling microchannels (Bal et al. 2018). Recently, CFD coupled with RSM was used to determine the optimal geometry parameters that maximize the Nusselt number and minimize the friction factor in a double-pipe heat exchanger (Arjmandi et al. 2020).
Drying is the main food preservation method used in developing countries (Nema et al. 2015), and although there are promising drying technologies (Figiel & Michalska, 2017), nearly 85 % of industrial dryers are convective, with hot air used as a drying medium (tray dryer). This is due to the simple design, low construction cost and capacity of convective dryers to dry products at high volume (Darabi et al. 2015). The influences of relative humidity and air velocity on the drying process are key factors in the energy reductions responsible for an estimated 15 to 20 % of industrial energy use (Ndisya et al. 2020). Indeed, the improper distribution of air inside a drying chamber can lead to inefficient and nonuniform drying. Hot air is usually introduced near the first tray and passes over other trays; therefore, some trays have superior air flows compared to others due to pressure losses, resulting in a biological material with a heterogeneous final humidity. In addition, increments in air velocity used to solve this problem lead to higher energy costs (Tzempelikos et al. 2012). These issues have been reported in convective dryers in both simulations and experimental validations; however, due to their low manufacturing cost, they are still widely used in developing countries (Esparza et al. 2019; Precoppe et al. 2015; Vargas et al. 2018).
Traditional kinetics models do not account for the influence of flow and transport properties, which are based on the geometrical configurations and operating parameters of tray dryers (Chilka & Ranade, 2018). Therefore, 3D models of dryers have been created in CFD and experimentally validated by several researchers. With this powerful tool, it is now possible to check for nonhomogeneous spatial distributions of variables such as turbulence viscosity (μt ), the turbulent transfer of momentum by eddies giving rise to an internal fluid friction or effective thermal conductivity (k eff ), a measure of a material’s ability to transfer energy; however, this information has to be linked to the drying kinetics (Subramaniam, 2016) to obtain a more robust model that can predict spatial humidity. Once a completed model has been developed, it is even possible to integrate physical models with multi-objective optimization processes to achieve a complete integration of computer-assisted dryer design (Defraeye, 2014). With a CFD model, local values of turbulence viscosity and effective thermal conductivity can be calculated (Böhner et al. 2013; Tzempelikos et al. 2012; Vargas et al. 2018) and the variations in values can be estimated with a uniformity index. For example, Khatir et al. (2013) set a temperature uniformity index for CFD optimization of a commercial bread-baking oven, and Precoppe et al. (2015) showed a uniformity index for local velocities in a tray dryer. In this study, a CFD tray dryer model is coupled with a DOE method and surface response methodology to determine optimal geometric parameters (distance between the trays, air inlet position and dryer length) and improve turbulence viscosity, effective thermal conductivity, and uniformity in the dryer.
MATERIALS AND METHODS
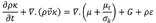
Mathematical model and numerical simulation. The momentum and continuous equations were set for the air as follows (ANSYS, 2017):


Where, ρ is the density of air (kg/m3); t is the time (s),
 is the velocity (m/s);
is the tensor and μ
t
is the turbulent viscosity (Pa s); c
u
is the turbulence model constant.
is the velocity (m/s);
is the tensor and μ
t
is the turbulent viscosity (Pa s); c
u
is the turbulence model constant.
The k-ε model was used to model the turbulence (ANSYS, 2017). This model has been proven to be efficient in turbulence modeling for tray dryers (Dasore & Konijeti, 2019; Margaris & Ghiaus, 2006):


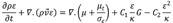
The modeled energy equation is
Where, (k eff ) is the Effective thermal conductivity (W/ m k); C 1 C 2 C 3 is the Turbulence model constant; G is the production of turbulence kinetic energy; T is temperature (°C).
For k-ε model the effective thermal conductivity is given by:
Where in this case, is the thermal conductivity (K). The default value of the turbulent Prandtl (P rt ) number is 0.85. Equation 8 shows the relationship between turbulent viscosity and thermal effective coefficient. The higher the turbulent viscosity, the higher the thermal effective coefficient.
The model constants have the following default values: cu=0,09, C1=1,44, C2=1.92 and σk=1 σε=1.3.
The air thermal properties were, density 1.225 (kg/m3), cp 1006.43 (j/kg.K), thermal conductivity 0.0242 (W/m.K), viscosity 1.78e-5 (Kg/m.s)
The boundary conditions were the velocity inlet for the air inlet and the pressure outlet for the air outlet. A no-slip boundary condition was used for all the walls. All models were solved with Fluent-ANSYS software (using second-order upwind methods and a coupled pressure-velocity scheme). The COUPLE algorithm was used alongside a Fluent® solver to solve the pressure-velocity coupling equations 1 and 2 (ANSYS, 2017). The numerical model was run until it converged. The simulation strategy was 300 hundred interactions, residuals 1 e-3 quick algorithm was used to solve turbulent and energy equations.
Prior to the tray dryer parameterization, the model was validated against the local velocities measured for conditions and a tray dryer presented by Tzempelikos et al. (2012).
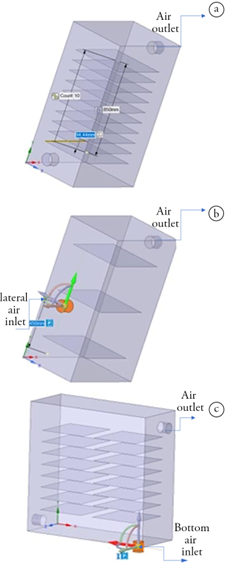
Original tray dryer geometry. The original tray dryer (Figure 1a) consists of a rectangular aluminium chamber with dimensions of 873 mm (length) x 545 mm (width) x 1310 mm (height). The dryer has an air inlet located at the bottom of the left side face, which has a turbine that is responsible for circulating air from the outside to the inside with a resistance system for heating the air that enters the chamber. The diameter of the duct is 109 mm. Additionally, a camera with an air outlet is located at the upper part of the right lateral face. The cabinet has 10 fixed aluminium trays that are 94.44 mm apart (dimensions of each tray are 581 mm × 500 mm) for a drying area of 2.92 m2. Homogeneity problems were previously described in this type of dryer, where different final humidities were obtained at the spatial level for equal drying times (Esparza et al. 2019).
In addition to the original tray dryer, two additional dryers were parameterized: a dryer with a lateral inlet TDLI (Figure 1b) and a dryer with a bottom inlet TDBI (Figure 1c) The dryers were parameterized with three design variables: the position of the air inlet, the distance between the trays and the dryer length.
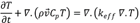
Figure 1 Tray Dryer Modeling (Geometry). a) original tray dryer; b) dryer with a lateral inlet (TDLI); c) dryer with a bottom inlet (TDBI).
Position of the air inlet - Pinlet ranges from 0 (initial position) to 900 mm. Dryer length (L) ranges from 0 (initial position) to 500 mm, and distance between the trays (h) ranges from 100 to 450 mm. These values were chosen as the maximum values due to the construction constraints. It is important to note that when h changes, the number of trays changes automatically to meet the desired h, which will be explained later in detail in this document. Ansys 2017 R1 (Student version) was used to create the geometry and the mesh.
Response variable. The response variables in this work are (μ t ), (k eff ) and its uniformity index γ, (μ t ) and (k eff ) is the average of the turbulence viscosity and effective thermal conductivity of all nodes, which are calculated with equation 4 and with equation 8 for each node.
Esparza et al. (2019) demonstrated with experiments and simulations that variations in k eff directly affect drying speed. Spatial variations for these variables create nonhomogeneity during the drying process. To quantify these variations, the uniformity index of the effective thermal conductivity is established, which shows the variation of a variable in space, where a value of 1 means maximum uniformity. The uniformity index (ANSYS, 2017) is calculated using the equation below, where ϕ i is the value of the effective thermal conductivity at a point and A i is the total volume where the variable is being evaluated. The analysis volume was defined in the space where the trays are located, as shown in figure 1.

Experimental design and optimization. The dryer was parameterized with three design variables: the position of the air inlet, the distance between the trays and the dryer length. The sample points of these parameters were chosen by using central composite design. Central composite design - CCD is based on 2-level factorial designs augmented with centre and axial points to fit quadratic models. Regular CCDs have 5 levels for each factor (Arjmandi et al. 2020). Table 1 shows the sample points for which the response variable is calculated. Working with this type of experimental design, the sample points not only reduce the number of points required but also increase the accuracy of the response surface. For all sample points, the inlet velocity was fixed to 3 ms-1. With the values calculated with the CFD code, a surface is generated. Genetic aggregation is the default algorithm used to generate response surfaces. It automates the process of selecting, configuring, and generating the type of response surface best suited for each output parameter (ANSYS, 2017). Finally, the optimization is carried out by setting the objective function based on the generated response curve. In this work, the objective was to maximize the turbulent viscosity, effective thermal conductivity, and its uniformity index.
RESULTS AND DISCUSSION
Table 1 shows the μ t , k eff and γ results for all the design points analysed in the TDLI (TDBI also has an experimental design; however, data is not presented). Point 4, 7 and 12 show the best values regarding turbulence (the selected points were those with which the highest values of turbulence, thermal conductivity and uniformity index were simultaneously obtained) and effective thermal conductivity due to the linear relationship between turbulence and effective thermal conductivity (Figure 2a). Likewise, these points show the highest uniformity index values. To better understand the behaviour of turbulence and uniformity, these data are used to construct the response surface. Figure 2b shows the behaviour of effective thermal conductivity and uniformity with respect to h value and length at a fixed value of 450 mm for Pinlet. The effective thermal conductivity values and the uniformity increase with increasing increments in the distance between trays (Figure 2c). However, increased increments in the distance between trays means a smaller number of trays. In addition, these graphs also show that for a constant value of h, the uniformity is reduced, but the effective thermal conductivity is barely affected by the increment in tray dryer length (Figure 3b). These findings are important criteria in the design and scale-up of tray dryers, as shown later in this document.

Figure 2 (a) Average turbulent viscosity vs Average effective thermal conductivity. Influence of L and h on effective thermal conductivity (b), and uniformity index (c). The position Pinlet is constant (450 mm) for the tray dryer lateral (TDLI).
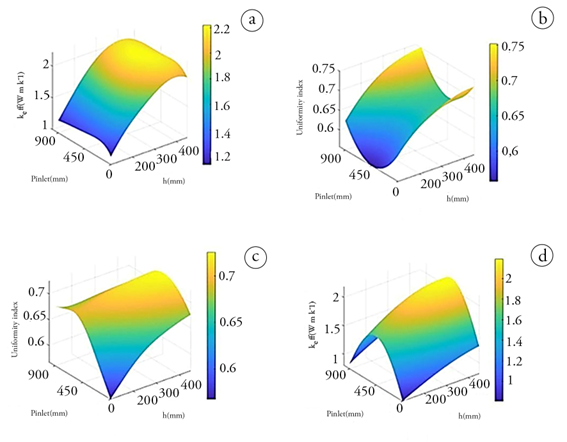
Figures 4a and 5a show the effective thermal conductivity and uniformity performance related to Pinlet and h for the dryer with a lateral inlet with a constant length of 500 mm. In this case, h also has a strong effect on turbulence. The increments in h enhance effective thermal conductivity and uniformity. In addition, the lateral inlet at position zero (original position) shows poor uniformity and effective thermal conductivity values (blue zones in the surface graphic). These results imply that the current position of the inlet in the original dryer does not maximize effective thermal conductivity.
For the equipment with the air inlet located at the bottom inlet, the inlet position becomes more relevant in relation to the effective thermal conductivity (Figure 2c). The maximum effective thermal conductivity value is found when the position is in the middle of the bottom wall of the dryer. Conversely, uniformity is negatively affected when the input position is in the middle (Figure 3d). The results of this work show that elements that interrupt flow decrease turbulence and effective thermal conductivity but increase homogeneity. Tzempelikos et al. (2012) found reductions in turbulence values due to trays that drastically interrupt the flow.
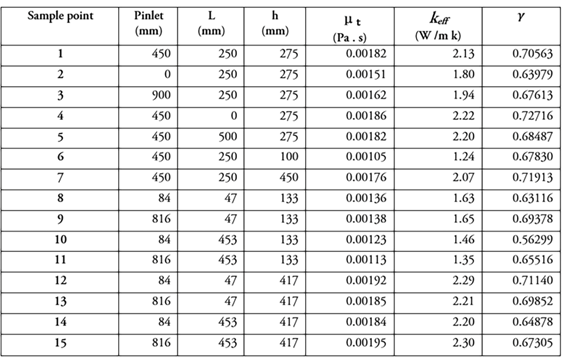
Figure 3 Influence of h and Pinlet on effective thermal conductivity with a constant length of 500 mm: a) tray dryer lateral inlet (TDLI); b) tray dryer bottom inlet (TDBI). Influence of h and Pinlet on uniformity with a constant length of 500 mm: b) tray dryer lateral inlet (TDLI); c) tray dryer bottom inlet (TDBI).
A turbulent flow around the food matrix improves the mass and heat transfer in the layer that is formed around the food material (Sabarez, 2016). It is important to note that turbulence is an important factor affecting the drying rate during the external heat and mass transfer controlling phases (Sabarez, 2016). Beyhaghi et al. (2016) and Lecorvaisier et al. (2010) found better diffusivity coefficients in turbulent flows than in laminar flows, showed that the drying time for a turbulent flow was less than that for a laminar flow, and the evaporation rate (or evaporative mass flow rate) was greater for a turbulent flow than a laminar flow.
As stated before, the decrease in turbulence and therefore effective thermal conductivity affects the drying speed, and an uneven distribution of effective thermal conductivity generates different drying speeds between the trays (Esparza et al. 2019). An increased increment of h creates a smaller number of trays. A value of h between 90 and 100 mm represents 10 trays, while a value of 400 to 450 mm represents 3 trays. Having more trays implies a greater drying area; however, as this work shows, it also implies a reduction in the values related to turbulence, effective thermal conductivity, and uniformity. A trade-off between effective thermal conductivity, uniformity and drying area must be found.
An objective function must be established carefully with specific constraints that a researcher can use to interpret the physical parameters of what constitutes an optimal design (Khatir et al. 2013). In this case, a large h means higher turbulence, effective thermal conductivity, and uniformity, but it also means fewer trays and therefore less drying area. However, with the findings related to the scale-up process, a comparison with similar drying areas can be performed. Table 2 shows the comparison of three configurations with respect to the original dryer. A 4-tray dryer with a width of 500 mm shows an 80 % increase in turbulence and effective thermal conductivity. However, it is a larger dryer and has a slightly smaller drying area than the original dryer. With the constraints on the drying area and knowing that increasing the length of the dryer means larger equipment, it is possible to determine the maximum surface curve. The optimal design for a dryer with a lateral inlet is an inlet position located in the middle, 500 mm larger than the original and a drying area of 2.13 m2. This design shows an increase of 80 % in effective thermal conductivity and 11 % in uniformity compared to the original dryer. The optimal design of a tray dryer with a bottom inlet has the following conditions: an inlet position located in the middle, 500 mm larger than the original and a drying area of 3.896 m2. This design shows an increase of 40 % in effective thermal conductivity and a 4 % increment in uniformity compared to the original dryer.
Figure 4 shows the effective thermal conductivity isocontours in a plane located in the middle of the dryer for the 3 designs in table 2. This figure shows many red, yellow, and green areas in designs b and c compared with the original tray dryer. The challenge is to have most of the areas in the dryer exhibit yellow, green, and red areas inside the trays. As mentioned before, the zones with red colors (high turbulence and effective thermal conductivity) will have faster humidity removal rates.
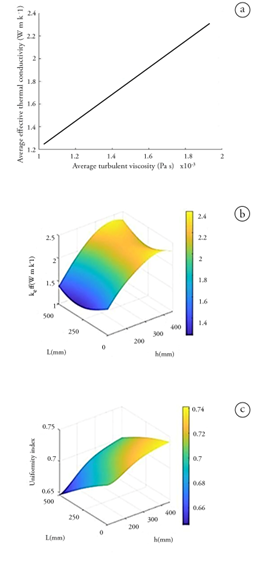
Figure 4 Effective thermal conductivity isocontours for different tray dryer configurations: a) Original tray dryer; b) TDLI 4 trays and c) TDLI 8 trays.
Table 2 Design parameters obtained for the analyzed geometries. Comparison between the original tray dryer with respect to the dryer with a lateral inlet (TDLI) and dryer with a bottom inlet (TDBI).
k eff : Effective thermal conductivity. Pinlet: Position of the air inlet. L: Dryer length; h: Distance between the trays; γ: Uniformity index.
Computer-aided design using CFD helps clarify the turbulence and effective thermal conductivity behavior in dryer equipment, and several works have shown the strong relationship between humidity removal and vigorous eddy viscosity to improve the mass transfer in the food boundary layer (Handayani et al. 2023). However, it is still necessary to correlate the findings in this theoretical research with empirical data, where the dryer design parameters can be modified experimentally, and the local humidity can be measured.
Finally, coupling experimental design with RSM can be a powerful tool for designing a tray dryer. In this case, design parameters such as dryer length, number of trays and inlet position were evaluated. A digital twin allows for a fast development design. Several design configurations can be evaluated before equipment construction and coupling with a design of experiments method, and an optimized number of runs can be found. This work shows that filling the dryer with many trays decreases the turbulence, effective thermal conductivity, and homogeneity; concerning the air inlet, the best effective thermal conductivity results are found when the air inlet is in the centre. Finally, the scale-up process regarding the dryer length increment shows small variations in effective thermal conductivity. These results present a new outcome regarding the tray dryer scale-up process.
Practical applications. This research shows an optimized dryer prototype using parameterization which can be used by the industry and by small producers who want to give added value to the products obtained from the field since it does not require a high investment for its implementation.

