


 English (pdf)
 Article in xml format
 Article references
 Send this article by e-mail
 Cited by SciELO
  Cited by Google
  Similars in
SciELO
Similars in
SciELO  Similars in Google
 Permalink
1. Introduction
Academic performance (AP) could be defined as the value attributed to the learning outcomes of students in each subject area compared to the level of knowledge expected from their peers. AP is an indicator of university assurance and considers pedagogical, institutional, sociodemographic - past AP, and psychosocial variables [1,2]. Dropout caused by AP is a common indicator to estimate student achievement. According to national regulations, each university determines the evaluative criteria to give an assessment of AP considering the weighted average in each assignment, the number of credits enrolled, the number of subjects passed, or another effectiveness indicator in a specific period [3,4]. Unlike graduation and dropout rates, AP can be measured in the early stages of the educational process and has different ways of quantifying (average grades per subject, rate of courses earned per semester). Other advantages of AP could be measured continuously, monitored at any time of university trajectory, and is a good predictor of dropout [5-7]. In general, many studies are interested in determining the factors that affect AP to generate explicative and predictive models that allow early intervention before students drop out [5-7].
In higher education context, it is usual to identify AP as a learning result. In fact, AP can be classified into two categories: immediate, determined by the achievement of students in their academic trajectory until they obtain their professional qualifications. Mediate refers to the learning results or achievement obtained through applying the competencies received in the student trajectory and determines the effectiveness of labor incorporation [8]. This type of mediate AP is frequently measured by government standardized tests in most countries. In Colombia this kind of test is called Saber-Pro [9].
Saber-Pro is presented by all Colombian university students. This test is proposed by the Colombian Institute for Education Evaluation (ICFES) to measure the mediate AP acquired throughout their trajectory. According to Colombian Law, Saber-Pro was instituted as compulsory and included evaluation of verbal, quantitative, and English proficiency, critical reading, and written communication, as well as evaluating the subject area of knowledge for several fields. Like Saber-Pro, Graduate Record Examination (GRE) evaluates and predicts mediate AP in verbal, quantitative, and analytics abilities for admit students in many United States higher education institutions [10,11]. Scholastic Assessment Test (SAT) and American College Test (ACT) are two other examples of standardized tests widely used by student students, and they are mandatory to access postgrads and labor organizations in many countries worldwide [12].
University quality manifests a broad relationship with academic results of standardized tests, this kind of examination could indicate accomplished objectives related to skills development and learning results at the end of the academic program, establishing a comparison between institutions and programs over time [13,14]. Therefore, Saber-Pro constitutes an objective mediate AP indicator that help to know how each program or university is positioned concerning its reference group [15].
Learning outcomes acquired from the development of academic activities are relevant indicators when evaluating students and the academic programs in which they are enrolled. To this, some Latin American higher education institutions have implemented strategies measuring variables associated with AP according to standardized tests. Nevertheless, these studies have represented a significant advance in establishing criteria for improving the quality of higher education and academic performance, impacting the productive and social environment [16-18].
Satisfactory AP is achieved by the interaction of different variables, including the knowledge acquired by students according to the learning process, pedagogy, didactics, and course organization. Pedagogical, sociodemographic, and institutional factors are essential to classify students with differential mediate AP [19-21].
From the pedagogical factor, mediate AP is understood from the effectiveness of all the teaching strategies used by professors, evaluation, and didactic material, as well as the procedures that professors followed to cover all the learning objectives and contents [22]. From institutional factors, university structures are included, as well as their influence on the particularities of students. The program of choice, number of students per course, maximum number of credits enrolling, availability of scholarships or subsidies, the policies, structure, and functionality of each educational program, number of students per course, number of times a subject is repeated, academic level, and the program of choice would be relevant [1,23].
Sociodemographic factor concentrates on variables that allow students to be classified by differential traits, define the social and cultural guidelines where the student develops, and can affect and mediate AP. These include socioeconomic income, sex, proceeding region, high school graduation, parents' educational level, employment status, access to information and consultation resources, previous AP [20,24-26].
Different studies have concluded that nations' quality of life and future sustainability depend on technological progress and the development of engineering knowledge and techniques [27,28]. For this reason, there is a sustained effort by higher education institution to develop strategies for recruiting and retaining students in science, technology, engineering, and mathematics. Much of this effort is based on predictive and explicative models of AP [29,30]. Engineering, specially in areas like computer, industrial, environmental and electronic play an important role in deploying sustainable, innovative and nature-based solution to deliver Sustainable Development Goals (SDG´s) according to 2030 agenda.
In this research, results of Saber-Pro 2019 from environmental, industrial, computer, and electronics engineering were integrated with academic institutional databases of a private university of Colombia. This research aims to identify and quantify the risk associated with low AP according to Saber-Pro test. We proposed a model to support predicting and estimating potentiate risk factors of AP in engineering students. Until this research, these variables have not yet been explored to explain and predict student AP using an integration of academic institutional databases and mandatory standardized tests.
2. Method
To determine factors associated with Academic Performance (AP), a retrospective case-control study according to a quantitative approach was carried out. Cases were defined as students with low AP in Saber Pro. According to sociodemographic factors, variables such as gender (female and male), nature of the high school (public or private), region of origin, program in which they are enrolled, and age were considered. Within the institutional factor, variables like having a subsidy or scholarship, number of subjects taken per semester, Grade Point Average (GPA) in the midterm, follow-up, and final grades were considered. At the same time, the number of times a student repeats an assignment, credits approval, and the semester in which they presented Saber-Pro were considered. In pedagogical factors, type of contract, age, salary, level of study, and qualification scores of professors in pedagogy, management, institutional identity, and didactics were considered. According to students' previous AP, the GPA of students in subjects related to citizen comprehension (CC), writing communication (WC), critical reading (CR), and quantitative reasoning (QR) during their academic trajectory also were included.
The sample consisted of 77 students from environmental, industrial, computer, and electronics engineering in a private university located in the east of Colombia who presented Saber-Pro tests in 2019. Students with scores below 159.3 in Saber-Pro were classified with low AP; this score corresponds to the average established for high-quality accredited universities in Colombia in 2019 [31]. The scope of this study was correlational and explanatory. Correlational in order to determine the relation of variables considered in all factors with AP according to Saber Pro. Explanatory in order to explain and predict risk measures of all AP-related variables.
A bivariate statistical analysis was initially carried out. In the case of qualitative variables, Chi-squared independence was used, and in quantitative variables, ANOVA or Kruskal-Wallis were performed if data were distributed parametrically or not. For the definitive logistic model, those variables with p-values lower than .25 were chosen to be entered according to Hosmer-Lemeshow criteria. All analysis was performed with 95% of confidence.
Canonical discriminant analysis was proposed to validate if a correct classification was achieved between students with low and average AP. The classification rules were assigned to identify 100% of students with low AP. All statistical component was developed in R software using the package candisc [32].
2.1 Logistic regression approach
A logistic regression model was performed to identify the association between factors and AP. This model allowed calculating Odds Ratio (OR) for each variable according to low AP.
The model's predictive quality was evaluated using the goodness-of-fit criteria and area under the curve (AUC) based on sensitivity and specificity. The model was set with 2/3 of the data and the remaining 1/3 for validation.
In the logistic model, the dependent variable Yi (defined as the event that a student has low AP) is calculated according to expression (1):
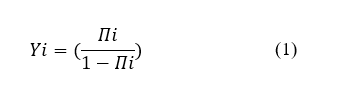
Where:
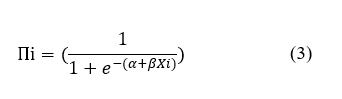
Πi: is the probability that student i will experience low academic performance, and it is the value of the dependent variable in case i for the regression coefficients 𝛼 and β.
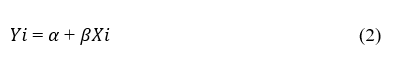
Expressed as regression, the logistic model can be represented as:
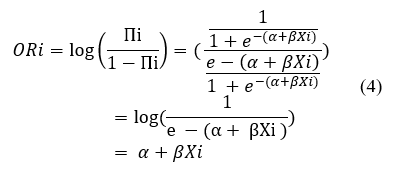
The risk ratio OR indicate the probability that a student has low AP concerning one who has normal AP according to the value assumed by the independent variable 𝑋𝑖. This value constitutes a level of the relative effect of each variable in AP. According to this, the OR can be estimated from the logistic regression model as follows:
For logistic regression, all hypotheses were tested with a significance of 0.05.
We hypothesized that variables associated with sociodemographic, pedagogical, institutional, and past academic performance were included as risk variables and are significantly correlated with AP according to the Saber-Pro test.
3. Results
Most of the students included had small incomes (about 85%). More than 78% of them came from public schools, and nearly 7% live far from the campus in rural areas. Finally, 10% came from other Colombian regions but live in local university residencies. As of 2019-1, the engineering faculty has four programs with 536 students, where 15.41% study environmental engineering, 46.64% in computer engineering, 29.85% in industrial engineering, and 7.65% in electronics engineering.
3.1 Classification of university students
Considering the mean score of high-quality accredited universities in Colombia, 46 (59.74%) were in low AP, and the remaining 31 (40.26%) obtained normal AP.
A descriptive analysis is reported from pedagogical (Tables 1 and 2), institutional (Table 3), and sociodemographic factors (Table 4). Statistical differences were tested with low AP according to the Hosmer-Lemeshow methodology, where variables with a p-value < .25 or less are considered significant [33].
Pedagogical variables associated with low AP are if chair professors directed courses (p<.001), older (p=.045), paid less for their work (p=.002), without a master's degree (p=.23), and with low scores in didactics (p=.17). Students with low scores in subjects of quantitative reasoning (QR), English (EN), critical reading (CR), citizen comprehension (CC) and written communication (WC) (p<.001) were associated with low AP (Table 1 and 2). These variables were selected to be included in the multivariate logistic regression model.
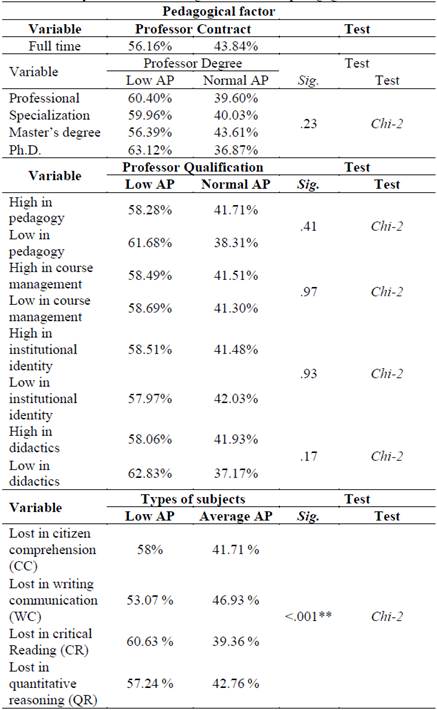
Table 2 Quantitative analysis of AP according to variables in pedagogical factor
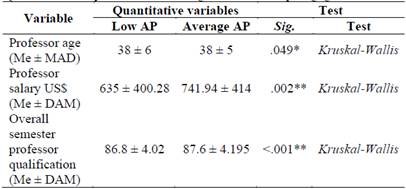
*,** and *** indicates statistical differences with .05, .02 y >.01 of significance.
Source: own
According to institutional factors, variables associated with low AP were student has not had any subsidy (p<.01), has enrolled in few concurrent subjects/semester (p<.01), has obtained low partial (p<.01), and final grades (p<.01). Student who has high repetition rate (p<.01), has been in an advanced semester at the time of presenting Saber-Pro (p=.18) and has had a lower number of subject approval (p<.01) has been associated with low AP (Table 3).
In the sociodemographic factor, the female sex (p=.02) comes from rural and foreign regions (p<.01), enrolled in industrial engineering (p=.02), and being older (p<.01) are variables associated with low AP. Critical remarks suggest high student competencies in CC, WC, CR, and QR acquired during their student trajectory increment AP. According to Saber-Pro, students with poor subject results are likelier to have low AP (Table 4).
Table 3 Bivariate analysis of AP according to variables in institutional factor.
| Institutional factors | |||||
|---|---|---|---|---|---|
| Variable | Professor Contract | Test | |||
| Low AP | Normal AP | Sig. | Test | ||
| Have a subsidie | 53,41% | 46.59% | >0.01** | Chi-2 | |
| Not have a subsidy | 63.60% | 36.40% | |||
| Concurrent subject/semester (Me ± DAM) | 5 ± 1 | 5 ± 1 | 0.061 | Kruskal-Wallis | |
| Cancelation subject/semester (Me ± DAM) | 1 ± 1 | 1 ± 0 | >0.01** | Kruskal-Wallis | |
| Midterm exam scores (Me ± DAM) | 3.7 ± 0.7 | 4 ± 0.6 | >0.01** | Kruskal-Wallis | |
| Follow-up score (Me ± DAM) | 4.2 ± 0.4 | 4.2 ± 0.3 | >0.01** | Kruskal-Wallis | |
| Final exam score (Me ± DAM) | 3.8 ± 0.8 | 4 ± 0.7 | >0.01** | Kruskal-Wallis | |
| Repetition rate (Me ± DAM) | 1 ± 0 | 1 ± 0 | 0.029** | Kruskal-Wallis | |
| Level or semester | 9 ± 1 | 9 ± 0 | 0.18 | Kruskal-Wallis | |
| Credits per semester (Me ± DAM) | 10 ± 3 | 10 ± 3 | 0.27 | Kruskal-Wallis | |
| Approval credits per semester (Me ± DAM) | 9.5 ± 3.5 | 9 ± 3 | 0.41 | Kruskal-Wallis | |
| Average semester grades (x̄ ± Sd) | 4 ± 0.52 | 4.232 ± 0.47 | 0.048** | ANOVA | |
| Accumulated average grades (Me ± DAM) | 3.8 ± 0.2 | 3.9 ± 0.1 | 0.027** | Kruskal-Wallis | |
| Approved subject per semester (Me ± DAM) | 4 ±1 | 5 ± 1 | >0.01** | Kruskal-Wallis | |
*,** and *** indicates statistical differences with .05, .02 y >.01 of significance.
Source: own
Table 4 Bivariate analysis of AP according to variables in sociodemographic factor.
| Sociodemographics factors | ||||
|---|---|---|---|---|
| Variable | Professor Contract | Test | ||
| Low AP | Normal AP | Sig. | Test | |
| Female | 68.50% | 31.50% | 0.02 | Chi-2 |
| Male | 57.80% | 42.20% | ||
| Public School | 59.90% | 40.10% | 0.47 | Chi-2 |
| Private School | 63.00% | 37.00% | ||
| From metropolitan Region | 65.70% | 34.30% | >0.01 | Chi-2 |
| From rural nearest areas | 69.30% | 30.70% | ||
| From colombian foreign regions | 100% | 0% | ||
| From nearest big metropoli - Medellin | 31.10% | 68.90% | ||
| Study environmental engineering | 59.20% | 40.80% | 0.02 | Chi-2 |
| Study computer engineering | 45.20% | 54.80% | ||
| Study industrial engineering | 78.40% | 21.60% | ||
| Electronics engineerings | 30.90% | 69.10% | ||
| Age (Me ± DAM) | 22 ± 4.45 | 21 ± 2.97 | >0.01 | Kruskall-Wallis |
*,** and *** indicates statistical differences with .05, .02 y >.01 of significance.
Source: own
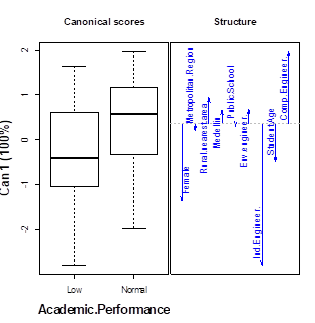
3.2 Validation of the cut-off points and discriminant variables between low and normal academic performance
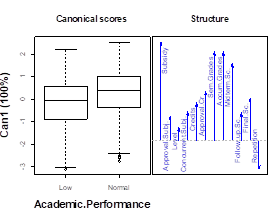
Figs. 1 - 3 show a discriminant analysis for pedagogical, institutional, and sociodemographic factors. This analysis allows us to determine which variables significantly classify between low and average AP. These models also explain 100% of the variance in their first dimension.
Canonical discriminant analysis in pedagogical factors identifies 56.71% of students with low or average (Normal) AP (Fig. 1). Variables that best discriminate against low AP were if the professor had no full-time contract (Prof.Vinculate). This result could be associated with their limited time to accompany students during extracurricular hours. Another variable that favors low AP is the professor's age (Prof.Age): older had more students with low AP. These results suggest that teaching methodologies must be updated to new disciplinary trends that older teachers did not incorporate. Another consideration is that older teachers must be more empathic with their younger students.
Nevertheless, variables that favor average AP in pedagogical factors (Fig.1) are high professor salary, high overall professor qualification, and high grades in pedagogy and didactics. According to students, good grades in a subject associated with writing communication (WC) and quantitative reasoning (QR) favored average AP. These results suggest that competencies of WC and QR acquired during student trajectory could be decisive in improving AP. A high professor's salary could be associated with motivation and responsibility, and students recognize the effort and competence of an excellent professor to give them good qualifications [34].
Canonical discriminant in sociodemographic factors was able to identify 65.34% of students with low AP. According to Fig. 3, students from rural regions, being females, studying industrial engineering and older, are associated with low AP in engineering. These results suggest reviewing industrial engineering curricula, competencies, and teaching support is a strategy to improve AP in this specific program. Finally, older working students, have families, and have less time for their academic activities could be associated with low AP [35].
The canonical discriminant model of institutional factor allows for identifying the 57.48% of students with low and normal (Normal) AP (Fig. 2). In accordance, institutional variables like have not a subsidy, repetition rate, and low accumulated, midterm, final, and follow-up grades are associated with low AP. The number of concurrent subjects and credits enrolled per semester (Credits and Concurrent. Subj) and if they had in a lower semester when students present Saber Pro were associated with low AP. This result suggests that providing economic or subsidy support could be an effective strategy to improve in a meaningful manner AP. Maintaining and promoting subsidies implies they make extraordinary efforts to have a good AP in their student trajectory. In the same way, low AP is also associated with high grades in university. According to Saber Pro, these results suggest that better performance in student trajectory is associated with good AP.
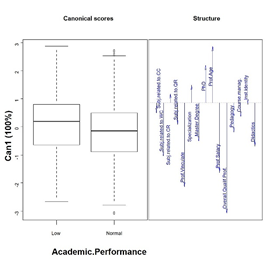
Source: own
Figure 1 canonical discriminant analysis of variables influencing AP according to pedagogical factor. This model allows identifying by cross-validation the 56.71 % of all student students.
3.3 Logistic regression to estimate risk ratios
Based on logistic regression performed as multivariate analysis and Hosmer-Lemeshow criteria using a stepwise methodology, it was possible to select those variables that best explain low AP and risk association Odds Ratio (OR) (Table 5). OR establishes a proportional relationship of the variable with AP; that is, if for females, the adjusted OR (adj.OR) obtained is 1.3, this implies that women present 1.3 times more feasibility of having low AP than men. In consequence, the female will be a risk variable. On the other hand, if the adj.OR is less than 1, the variable could be considered protective.
Source: own
Figure 3: canonical discriminant analysis of variables influencing AP according to sociodemographic factor. This model allows identifying by cross-validation the 65.34% of all students.
The logistic regression in Table 5 allows correctly classifying 73.56% of students. In addition, this model identifies 82.49% with low and 61.20% of normal AP by cross-validation. According to this, the model performs well in explaining variables affecting AP according to Saber Pro for a cut-off probability of 0.5.
Regarding pedagogical factor, the variable that most affects AP is professor degree: professors with master's and specialization have students with better AP in Saber-Pro (adj.OR 0.59 [ 0.38,0.92]) and (adj.OR 0.63 [0.4,0.99]) respectively, compared with professional (adj. OR 0.56 [0.33,0.95]) and Ph.D. which was the reference category. These results suggest that the investment made by professors and universities in postgraduate training contributes significantly to improve AP.
Logistic regression also presented risk variables considering the institutional factor (Table 4). It was observed that having a subsidy (adj.OR 0.53 [0.43,0.65]), a high ratio of approved credits per semester (adj.OR 0.43 [0.2,0.94]), good grades in subjects related to critical reading at university trajectory (adj.OR 0.43 [0.2,0.94]), good grades in midterm (adj.OR 0.86 [0.77,0.96]) and final exams (adj.OR 0.99 [0.81,0.99]) becomes protectives factor. On the other hand, a student who was at a high level or semester when presenting Saber Pro was considered at risk of low AP (OR 1.51 [0.95, 2.42]).
According to Saber-Pro, this result suggests that good performance in the university training trajectory guarantees average AP. In the sociodemographic factor, males (adj.OR 0.75 [0.59,0.95]) who had been enrolled in computer engineering (adj.OR 0.51 [0.4,0.67]) were considered protective. Older age at the moment of presenting Saber Pro (adj.OR 1.03 [1.00,1.06]), comes from a rural region (adj.OR 3.13 [1.88,5.21]), had graduated from a public high school (adj.OR 1.42 [1.09,1.84]), and had been enrolled in industrial engineering program (adj.OR 2.92 [2.35,3.65]) were risk factors of low AP according to logistic regression.
Table 5 Crude and adjusted Odds Ratio (OR) of variables related to AP in Saber-Pro.
| Factor | Variable | Adj. OR | p | Variable description |
|---|---|---|---|---|
| 95% CI in parenthesis | ||||
| Pedagogical | Professor professional - PhD | 0.56 | .032 | Protector |
| (0.33, 0.95) | ||||
| Professor specialization - PhD | 0.63 | .044 | Protector | |
| (0.4, 0.99) | ||||
| Professor master´s degree - PhD | 0.59 | .02 | Protector | |
| (0.38, 0.92) | ||||
| Professor salary | 1 | < .001 | ----- | |
| (1, 1) | ||||
| Institutional | Have subsidy | 0.53 | < .001 | Protector |
| (0.43, 0.65) | ||||
| Good grades in Critical Reading (CR) | 0.43 | .033 | Protector | |
| (0.2, 0.94) | ||||
| Good grades in Midterm Exams | 0.86 | .007 | Protector | |
| (0.77, 0.96) | ||||
| Good grades in the Final Exam | 0.9 | .041 | Protector | |
| (0.81, 1) | ||||
| Be in High level or semester | 1.51 | .088 | Risk | |
| (0.94, 2.42) | ||||
| Sociodemographic | Male - Women | 0.75 | .016 | Protector |
| (0.59, 0.95) | ||||
| Student age | 1.03 | .081 | Risk | |
| (1, 1.06) | ||||
| Metropolitan region - Medellin | 1.73 | < .001 | Risk | |
| (1.29, 2.33) | ||||
| Rural nearest area - Medellin | 3.13 | < .001 | Risk | |
| (1.88, 5.21) | ||||
| Public - private school | 1.42 | .009 | Risk | |
| (1.09, 1.84) | ||||
| Computer eng. - Environment eng. | 0.51 | < .001 | Protector | |
| (0.4, 0.67) | ||||
| Industrial eng. - Environment eng. | 2.92 | < .001 | Risk | |
| (2.35, 3.65) |
Source: own
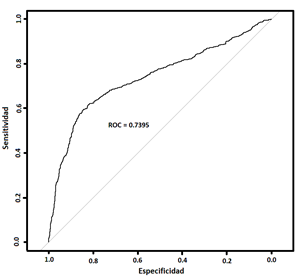
Finally, the Area Under Curve (AUC) of the Receiver Operating Characteristic (ROC) (Fig. 4) was 0.739, which establishes that this model is only for explanation, and it is not possible to make accurate predictions. It is necessary to make modifications and adjust the model with variables that provide a complement to obtain an adequate ROC. Cognitive and non-cognitive variables in psychosocial factors could be considered.
4. Discussion
The classification criteria based on the average general result of 159.3 in high-quality accredited universities presented consistency when approaching the research since the discriminant analyzes were able to explain 100% of the variance after validating the classification. According to Saber Pro, pedagogical variables such as writing communication (WC) and quantitative reasoning (QR) acquired during the student trajectory could be decisive in having a normal AP. This result is similar to the results by Gardner and Milne (2011) and Peiss et al. (2013). They demonstrated that high levels of communication skills (listening, speaking, and writing communication) in the early stages of university trajectory positively correlate with academic performance and achievement in students [37,38].
According to QR as a predictor of average AP and success in student trajectory, Mckee and Caldarella (2016) conclude that grades in subjects associated with math at high school were all strong predictors of student AP [39]. In the same way, Mutawah et al. (2018) demonstrated that student motivated with math and science in high school shows good AP when they are admitted to an student program [40]. Following these findings, universities could concentrate their effort on reinforcing competencies in subjects related to WC and QR in the curricula in all student trajectories to improve AP in Saber Pro.
Another variable that explains differences between students with low AP is the type of professor contracted full time, high professor salary, high qualification (master's degrees and PhD.), and better grades in professor's performance are related to normal AP. According to this, much research argues that good AP in students is related to the quality of the professor. Master's degrees and Ph.D. provide students with valued knowledge and technical support that is important to labor success and student motivation [41]. The results presented here are coherent with Rodríguez et al. (2019). They declared that the more significant investment in higher education of university professors is positively correlated with the more excellent knowledge acquired in all areas, which impacts better learning results for students [42].
Paying professors more for their work and the type of professor contract could not affect academic performance in big university scenarios. However, regional or low-income scenarios could be associated with labor motivation. Finally, students recognize that the effort and competence of a good professor give them good grades in the professor's performance [43-45].
Interesting results were obtained when we showed that industrial engineering, female sex, older students, and region are associated with low AP in students, otherwise, proceeding high school (public or private) was not. This result agrees with Iregui et al. (2007) and Gutierrez-Monsalve et al. (2021); they studied the efficiency of student education in Colombia and compared AP programs of many students with several variables, including if students come from public or private high schools. The main results of their research conclude that private schools could benefit from the more favorable income condition. However, when public schools are assumed to be in environments equivalent to private ones, there are no statistical differences between the AP from both types of high schools [17,46]. In the case of gender, Lin et al. (2014) and Monroy-Varela et al, (2022) reported significant associations between gender, AP, and retention indicators in engineering students in favor of women but not men. Our research is one of the few studies that report low AP in favor of women [47,48]. In the case of the region, Adeoiti et al. (2020) concluded that the proceeding region of students can affect academic performance in a university context. They concluded that rural students could have low AP compared to those from urban areas [49]. Other reports argue that most students of lower age assimilated and performed better in class than older ones. In fact, this may be due to older students almost work, have families and have less time for their academic activities, but if they work together with younger, their AP could be similar [50-52]. To our knowledge, there are no reports that publish the association between the AP considering student programs such as industrial, computer, and environmental engineering together.
Data from the risk ratio (OR) in logistic regression showed that only 16 of 56 variables had a high association with AP. According to the model, only nine have a protective effect, and the remaining seven have a risk effect. A subsidy is one of the most relevant variables that act as a protective variable. Providing economic support, especially for a student with low income, could be improved in a meaningful manner AP. Subsidy or scholarships implies that students making more significant efforts to have a good AP in their trajectory, so students with subsidy have better AP than others without [53-56].
Finally, these results present a broad relationship with the findings of Gutiérrez-Monsalve et al. (2021), where significant associations of low AP with the student's grade trajectory have subsidy and repetition rate.
5. Conclusions
According to factors related to AP in Saber Pro, professors with Ph.D. or master's degrees and well-paid were variables related to good AP. According to Saber Pro, professors with high qualifications in didactics and pedagogy had fewer students with low AP.
One interesting result is associated with student trajectory AP measure as a grade in assignments related to Citizen Comprehension (CC), Writing Communication (WR), Critical Reading (CR), and Quantitative Reasoning (QR). Students with good performance in their academic trajectory show better AP in Saber Pro. This result implies that curricula development through the career could be an essential predictor of AP.
According to sociodemographic and institutional variables, having a subsidy, a high ratio of approved credits (associated with past AP), and good grades in their university trajectory were related to good AP in Saber-Pro. Have subsidy, be male, enrolled in computer engineering, younger, comes from the urban region and had graduated from private high school, improved AP of Saber-Pro.
Based on this entire study, this model is explanatory. Therefore, prediction criteria cannot be established based on the results of the ROC curve. More variables that are interrelated with AP must be included to build a predictive model, especially in the psychosocial factor.
The study's main limitation is associated with the absence of cognitive and noncognitive variables that demonstrate a good prediction of Academic performance in engineering students [3].

