English (pdf)
 Article in xml format
 Article references
 Send this article by e-mail
 Cited by SciELO
  Cited by Google
  Similars in
SciELO
Similars in
SciELO  Similars in Google
 Permalink
Introduction
Urban inequality, residential segregation, and the concentration of poverty in informal settlements characterize many cities in Latin America and throughout the Global South (UN-Habitat, 2012; Mitlin and Saitterthwaite, 2013). UN-Habitat (2020) estimates that one billion people worldwide (about 1 in 4 urban residents) and 110 million in Latin America and the Caribbean (about 1 in 5) live in urban slums. The residents of urban slums experience multiple interconnected forms of deprivation related to overcrowding, poor quality and often hazardous housing, inadequate access to infrastructure and public services, and environmental risks, which exacerbate health and other social problems and limit opportunities for residents to take advantage of the economic opportunities offered by geographic proximity to the city (Marx et al., 2013; UN-Habitat, 2020).
There is, however, inadequate evidence on the scale, nature, and location of urban poverty. Authors such as Mitlin and Satterthwaite (2013) have called attention to the problem of underestimating urban monetary poverty when national poverty lines are employed, which do not consider the territorial variation in the prices of goods and services, the structure of household expenditures (for example, between homeowners and renters), and the quality of public infrastructure and services. The residents of informal settlements also experience deprivations directly associated with informality, such as inadequate policing (often in high crime areas), the lack of a legal address (needed to apply for jobs or obtain financial services), and the risk of eviction (Tacoli et al., 2015). Furthermore, the spatial segregation of informal settlements within many cities (from Santiago to Medellin, Cape Town, or Bangalore) creates the need to understand the spatial distribution of poverty within the city. Cities comprised of highly heterogeneous neighbourhoods also pose challenges for setting poverty thresholds, as poverty is always defined in relation to societal standards. There is broad recognition in the literature of the need for new methods to measure and understand well-being and poverty in cities (Satterthwaite, 2003; Mitlin & Satterthwaite, 2013; Tacoli et al., 2015; te Lintelo et al. 2018; Bag & Seth, 2018)
This paper illustrates the insights that can be gained by using Sen’s (1980;1993) capability approach and the Alkire and Foster (2011) counting method of multidimensional poverty measurement to analyse the scale, characteristics, and spatial distribution of poverty in segregated cities. The central theoretical idea of the capability approach introduced in 1979 by Amartya Sen (1993, p. 30) is that when assessing individual well-being, we should not focus on income or utility, but rather on capabilities, ‘the alternative combinations of things a person is able to do or be—the various “functionings” he or she can achieve’. When measuring extreme poverty in developing countries, Sen (1993, p. 31) asserts that it is reasonable to focus on deprivations in a ‘relatively small number of centrally important functionings and the corresponding basic capabilities (e.g., the ability to be well nourished and well sheltered, the capability of escaping avoidable morbidity and premature mortality, and so forth)’. Capabilities provide a better metric than income for assessing poverty because each person’s ability to convert income or resources into well-being opportunities (capabilities) and well-being achievements (functionings) varies depending on individual, social, environmental, and institutional factors. For example, the resources needed to enable a child to attend school will be greater if she has a motor disability. School attendance may also be influenced by proximity to schools or public transport or neighbourhood insecurity. A direct approach to poverty measurement based on capabilities and functionings avoids the problem of inadequately measuring deprivations when there are disparities across locations in the prices of goods and services or when some needs are satisfied by goods and services provided by the public sector or civil society, instead of market transactions.
There are a variety of multidimensional poverty measurement methods and an ongoing debate over the process of selecting dimensions and indicators and aggregation methods used in the different approaches (Gordon et al., 2001; Alkire & Foster, 2011; Pattanaik & Xu, 2018). The Alkire-Foster method, an axiomatic approach based on the extension of the FGT family of unidimensional poverty measures (Foster, Greer & Thorbecke, 1984) to the case of multiple deprivations, has been adopted by all but one (Mexico) of the eleven Latin American countries with official multidimensional poverty indices (MPIs) and at least twenty Asian and African countries.5 This approach identifies persons as multidimensionally poor when they experience an accumulation of deprivations (in selected dimensions and indicators) that surpasses a specified threshold. We argue that this approach to poverty measurement captures what Wolff and de-Shalit (2007, p.10) call a ‘clustering of disadvantage’. While a large proportion of the population, even in high income countries, experiences some form of deprivation (poor health, unemployment, etc.), ‘the most serious disadvantage occurs when disadvantages cluster together’ (Wolff & de-Shalit, 2007, p.10).
We use the capability approach and the Alkire-Foster method to analyse the spatial distribution of poverty in the City of Buenos Aires (CBA). The CBA, Argentina’s most prosperous city and the nation’s capital, forms part of Greater Buenos Aires, a sprawling megacity, the 13th largest in the world, with a population of over 15 million (United Nations Population Division, 2018). The standard of living in the CBA is relatively high, ranking 30th with a score of 68.56 on the City Prosperity Index, just above Mexico City and Lima and below Warsaw, Athens, and Barcelona (UN-Habitat and ICL, 2015). However, it is marked by stark inequality and the segregation of poverty in informal settlements. We explain how we have dealt with the challenges of poverty measurement in the CBA, assess the poverty gaps between formal and informal neighbourhoods and across the city’s 15 districts, compare the results based on multidimensional and income poverty measures, and analyse the dimensional composition of poverty and disparities across population subgroups. The paper also seeks to contribute to an expanding literature on multidimensional poverty measurement in Argentina, a country with no official MPI (Waisgrais et al., 2017; Salvia et al., 2017; DGEC, 2021, among others).
The paper is organized as follows. The second section describes the growth of informal settlements and residential segregation in the CBA. The third section presents the data sources and poverty measurement methodology and justifies the normative choices made in designing an MPI for the CBA. The fourth section reports and discusses the empirical results, and the fifth section concludes.
I. The informal settlements of the CBA
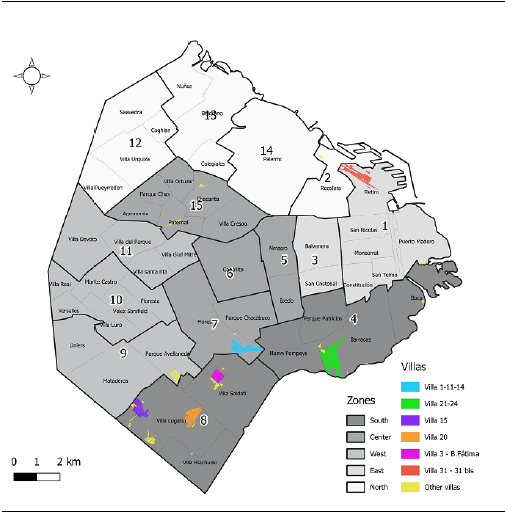
Informal settlements (known locally as villas6) first appeared in the CBA during the first half of the 20th century when workers who migrated to the city to look for jobs in the expanding industrial sector were forced to construct their own housing on unoccupied public or private land. The population of the settlements reached around 225,000 in 1976 before falling to below 13,000 in 1983 due to the policy of eradication and compulsory relocation of residents imposed by the military dictatorship that governed Argentina in 1976-1983 (de la Torre, 2008). The population growth rate in the settlements accelerated during the deindustrialization process of the 1990s and especially following the severe economic and social crisis of 2001 (Defensoría del Pueblo, 2016). According to national census data, the proportion of the city’s population living in informal settlements increased from 1.8% in 1991 to 3.9% in 2001 and 5.7% in 2010 (DGEC, 2015). The census data, however, are both outdated and subject to underestimation associated with the difficulty of surveying households in highly insecure and densely populated settlements. Combining information from a recent cadastral survey (SISU, 2018), which registered a total of 55 informal settlements, and official projections of the CBA’s total population (DGEC, 2018), we estimate that approximately 330,000 people or 10.8% of the city’s population currently live in informal settlements.
As most of the settlements are in the city’s southern zone, their expansion has contributed to increasing residential segregation and spatial concentration of poverty (Figure 1). The southern zone (districts 4 and 8) accounts for 15% of the total population (DGEC, 2018) and 62% of the population living in informal settlements (SISU, 2018). Close to half (42%) of the population in the southern zone lives in an informal settlement. The social isolation produced by residential segregation is reinforced by the increasing segmentation of the labour market (between formal and informal sectors) and education system (between private and public schools) in Argentina, which diminish opportunities for social interaction between people from different socioeconomic groups (Katzman, 2001). In addition, insecurity in the settlements, especially violence related to the drug trade (CMN, 2017), limits social integration both within the settlements and with the rest of the city (Lépore et al., 2012).
II. Data source and methodology
A. Household survey data
The poverty estimates presented in this paper are based on data from the Government of the CBA’s 2019 Annual Household Survey (AHS) (DGEC, 2019a). This survey provides statistically representative samples for the CBA, each of its 15 districts, and each of two sampling frames (‘villas, informal settlements, and temporary neighbourhoods’ and the ‘rest of the city’). The 2019 AHS sample was comprised of 14,319 individuals and 5,848 households (1,739 and 454 in villas, respectively).7
The 2019 AHS included a supplementary module designed to collect data for the construction of an official MPI for the CBA based on the ‘consensual’ method (Gordon et al., 2001, p. 5), a relative approach to poverty measurement, which ‘measures poverty in terms of deprivation from goods, services, and activities which the majority of the population defines as being necessities of life’. The consensual approach has been applied mostly in high income countries (Eurostat, 2012; Guio et al., 2017), but also in some middle- and low-income countries, such as Benin (Nandy & Pomati, 2015).
In the application of this approach in the CBA, the selection of the goods, services and activities to be included in the AHS survey was based on the results of three focus groups in which residents of the CBA were asked to classify items in a predefined list as either necessary and desirable or luxuries.8 The survey then asked respondents to indicate, first, if they considered each item on the list to be necessary to live with dignity in the CBA and, second, whether or not their family had each item and, if not, whether lack of access was due to a lack of resources or other motives (DGEC, 2021). The intersection between impairment in access and lack of resources is what constitutes deprivation within this framework.
While considering the values and living standards in society when defining a poverty measure is consistent with both the capability approach (Sen, 1993) and the Alkire-Foster method, we argue that there are several drawbacks to using the consensual approach to analyse poverty in the CBA. First, in contexts of high inequality the consensual approach’s central assumptions ‘that there are few differences across different sections of the population over what they perceive as the necessities of life’ (Gordon et al., 2001, p. 16) may not hold. The consensual approach was developed for measuring relative poverty in high income European countries, where most of the population’s basic needs are satisfied. In highly unequal Latin American cities, characterized by residential segregation, the segmentation of public services, and the marginalization of poor households in isolated neighbourhoods (Katzman, 2001), a ‘consensus standard of living’ may not exist and, therefore, it may be just as relevant to consider other information such as evidence on the living conditions of the least advantaged and common practice in the literature when making normative decisions on poverty measurement. Sen (1985) warns that adaptive preferences can cause people who have experienced prolonged periods of deprivation to become satisfied with extremely low standards of well-being. It would be especially difficult to reach consensus in residentially segregated cities as people tend to form perceptions about living standards based on the conditions of people living within their geographic or social proximity (Cruces et al., 2013). Second, the report describing the methodology used to construct the MPI for the CBA indicates that several types of deprivation particularly relevant in informal settlements, such as ‘lack of adolescent school attendance’ were excluded due to low correlation with income poverty (DGEC, 2021). This justification, however, fails to recognize that factors associated with social exclusion (peer effects, stigma, insecurity) can limit young people’s capability to be educated even when they have access to public education or are not income poor. Also, adequate sanitation was not even included in the initial list of goods, services, and activities presented to the focus groups because most of the population of the CBA has access to this service (DGEC, 2021), although this is not the case in the informal settlements.
We take advantage of the broader array of data provided by the 2019 round of the survey but use it to construct an alternative MPI for the CBA, which is useful for analysing the spatial distribution of poverty within the city.
B. The Alkire-Foster measures
To construct an MPI using the Alkire-Foster method, first, one must select the dimensions of analysis, one or more indicators within each dimension and, for each indicator, a deprivation cut-off, which establishes the level of achievement considered to be sufficient for a person to be non-deprived. The next step is to select a set of indicator weights such that the sum of the weights equals one. The deprivation score, ch, is defined as the weighted share of deprivations experienced by person i. Then it is necessary to select the poverty threshold, h, which indicates the minimum weighted share of deprivations a person must experience to be identified as poor. Persons with ci >k . are classified as poor and persons with ci<k are nonpoor. The censored deprivation score ci(k) is equal to the deprivation score cifor the poor and zero for the nonpoor. We use this information to construct three indices. The multidimensional headcount ratio H represents the proportion of persons identified as multidimensionally poor:
 (1)
(1)
where q(k) is the number of multidimensionally poor people and n is the total number of people. The intensity of multidimensional poverty, A, is defined as the average (weighted) share of deprivations among the multidimensionally poor:
 (2)
(2)
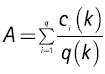
The adjusted headcount measure M0is calculated as the product of H and A:
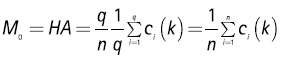 (3)
(3)
M0increases either when an additional person becomes multidimensionally poor or when any poor person becomes deprived in another indicator.
C. Multidimensional and income poverty measurement in the CBA
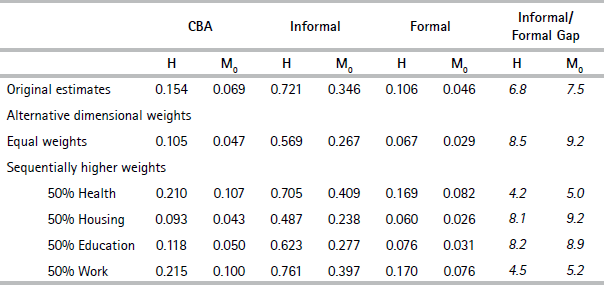
Table 1 presents the dimensions, indicators, deprivation cut-offs and weights selected for an alternative MPI for the CBA constructed using the capability approach as the conceptual framework and the Alkire-Foster method. Within the capability literature, the normative decisions on different aspects of poverty measurement can draw on a variety of sources, including theory, empirical evidence, participatory processes, consensus expressed in national and international agreements (such as the Universal Declaration of Human Rights), policy relevance, as well as practical concerns such as data constraints (Alkire et al., 2015; Robeyns, 2017). The following paragraphs justify the normative choices made in designing the MPI-CBA, based on the capability approach literature, multidimensional poverty measurement experiences in Latin America, and data availability in the 2019 AHS. The identification of who is poor uses data on all household members and is determined at the household level: all members are considered to be poor if their household is identified as poor. This decision was based, first, on the recognition that household members share a dwelling, food, and other resources and are concerned with and affected by the well-being of other members (for example, whether they are ill, unemployed, or out of school) and, second, on our interest in obtaining results relevant to the design of urban development policies toward informal settlements, which tend to use the household as the targeting unit. We present the results at the individual level to adequately account for the larger household size in informal settlements.
The selection of capabilities to analyse quality of life or poverty is a highly debated topic in the capability literature (Robeyns, 2005). Nussbaum (2003) proposed a list of ten central human capabilities considered to be universal. Sen (2004, p. 79), in contrast, asserts that ‘Some of the basic capabilities (…) will no doubt figure in every list of relevant capabilities in every society. But the exact list to be used will have to take note of the purpose of the exercise’. Nussbaum’s list can provide a source of inspiration, but the chosen list must be context specific and consider the epistemic goals of the evaluation.9
The MPI-CBA is comprised of four dimensions: health, habitat, education, and work. Being able to have good health and live in a habitat that provides protection and security are aspects of the first three capabilities (life, bodily health, and bodily integrity) in Martha Nussbaum’s (2003, p. 41) list of central human capabilities and education refers to the fourth capability ‘senses, imagination, and thought’. Health, habitat, and education also correspond to the dimensions comprising the Global MPI (Alkire & Santos, 2014).10 The work dimension was added to capture a central aspect of deprivation associated with social exclusion in the CBA (Katzman, 2001). Sen (2000) asserts that social exclusion is a constitutive component of poverty.11Nussbaum (2003, p. 42) includes in her list the ability to work within the capability to have ‘control over one’s environment’. Empirical research has shown that work improves well-being and satisfaction, mental health, and sociability (Hussam et al., 2022). All Latin American countries with official MPIs include dimensions related to health, housing, education, and work12 (Atkinson, 2019) and in several cases (Colombia, Chile and El Salvador), the decision-making processes for designing the MPIs employed the findings of participatory exercises used to identify the values and priorities of people living in poverty (Clausen et al., 2018).
The health dimension is comprised of indicators of food security and access to medical care, which are essential for attaining the capability to have good health. Food security is one of the Sustainable Development Goals indicators used to measure progress in ending hunger and ensuring access to safe, nutritious, and adequate food. The food security indicator is comparable to the questions on inadequacy of food availability in the FAO’s (2012) adaptation of its food insecurity scales to Latin America. The medical care indicator identifies as deprived households in which members cannot obtain medical care when sick or obtain medication or treatments when prescribed by a doctor. Nearly all Latin American countries with official MPIs include an indicator of lack of access to health insurance (Costa Rica, Mexico) or health care services (Chile, Colombia, El Salvador, and Panama) (Zavaleta et al., 2018). As Argentina’s public health system offers healthcare to all residents, the selected indicator is intended to measure deprivations caused by long waiting times in public facilities, time restrictions, and lack of money to pay for transport to a medical centre, medications, or diagnostic tests.
Table 1. Dimensions, indicators, indicator cut-offs and weights for the MPI-CBA
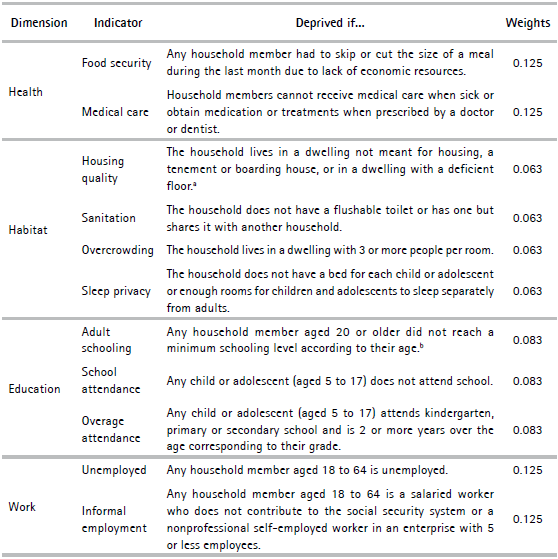
aAdequate materials for dwelling floors include wood, cement, tiles, and ceramic.
bAdult schooling level thresholds are complete secondary for ages 20-29, complete lower secondary for ages 30-59, and complete primary for ages 60 and over.
The habitat dimension, comprised of four indicators, identifies deprivations related to the quality and size of the built environment. The first two indicators —housing quality and sanitation— are among the most widely-used habitat indicators in official MPIs in Latin America (Zavaleta et al., 2018). Deficits in housing construction expose households to inclement weather and environmental risks, while inadequate sanitation increases the transmission of disease directly or via groundwater contamination (Katzman, 2011). We do not incorporate other indicators of housing quality due to lack of data. The third and fourth indicators refer to deprivations related to overcrowding, which research shows is negatively associated with physical and mental health, interpersonal relations, sleep, and children’s educational outcomes (Newman, 2008). For overcrowded housing, following Katzman (2011), we adopt a threshold of three or more persons per room. The sleep privacy indicator is designed to capture deprivations associated with lack of space and privacy during sleep. Although there is substantial debate in the literature on the cultural and psychological causes of adults sharing beds and rooms with children and its possible benefits and harms (Mileva-Seitz, 2017), the empirical evidence suggests that it is often a response to restrictions in dwelling size, room divisions, and availability of beds. The percentage of Argentine children that share a mattress or bed is twice as large in low socio-occupational strata than in high ones (Tuñon, 2018). An evaluation of an emergency housing programme in the informal settlements of Argentina showed that a quarter of the participants stopped sharing a bed with someone other than their partner after receiving the new house (Simonelli et al., 2013). Sleep privacy could also safe- guard against risks to bodily integrity.
Education teaches people to read, reason, imagine, communicate, and learn about their own rights and responsibilities. It promotes equity between social groups and within families and enhances agency by improving the ability of the most deprived to politically organize (Unterhalter, 2018). The three chosen education indicators are included in most official MPIs in Latin America (Zavaleta et al., 2018). A person is deprived in adult schooling if any member of her household aged 20 and over did not complete a minimum schooling level according to their age.13 The second and third indicators measure deficits in school enrolment and problems of delayed access and grade repetition. Households without school age children are classified as non-deprived in these two schooling indicators.
The two indicators in the work dimension are unemployment and informal employment. Unemployment, Sen (2000) notes, can erode self-esteem and motivation, negatively impact mental and physical health, and aggravate relationships within the home due to the disruption of organized working life. Katzman (2001) asserts that the destruction of ties with the formal labour market weakens opportunities for social interaction with people from different classes, skills, or social contexts. The informal employment indicator adopts a legalistic definition classifying households with a salaried worker aged 18 to 64 who does not contribute to the social security system as deprived. Due to data limitations, for independent workers, we adopt a productive definition, based on education qualification and size of the enterprise (Gasparini & Tornarolli, 2009). Nine Latin American countries include indicators of unemplo-yment and informal employment in their official MPIs (Santos, 2019).14
The final normative choices are the selection of indicator weights and the poverty threshold, h. A variety of criteria have been used in the literature to assign indicator weights, including rankings based on household survey data, participatory processes, and statistical approaches such as principal component analysis (Decancq & Lugo, 2013). As all dimensions and all indicators within each dimension are considered to be of similar importance, we apply equal weights to all dimensions and to all indicators within each dimension.15 We set the poverty threshold at one-third of all weighted indicators, meaning that households must be deprived in more than one full dimension to be considered multidimensionally poor. Households reach this threshold if they have any combination of four indicators in at least three different dimensions. The Appendix presents robustness tests on the selection of the poverty threshold and indicator weights.
In the case of income poverty, persons are identified as poor when the level of their total household income per adult equivalent, Yi , is below the official poverty line, Z (DGCE, 2019b). Yi is calculated as the sum of the labour income of all household members plus all sources of nonlabour income16 received during the previous month divided by the number of adult equivalent household members, calculated based on the official adult equivalence scale (DGEC, 2016). The official poverty line, Z, was set by first defining a basic food basket satisfying the caloric needs of an adult male with moderate activity and reflecting food consumption habits of the population and lowest cost food items. The extreme poverty line is equal to the monetary value of the basic food basket calculated using CPI price data. The poverty line is equal to the monetary value of the total consumption basket, comprised of the basic food basket plus twelve additional expenditure categories. In the fourth quarter of 2019, the survey’s income reference period, the value of the official line was $12,986 pesos (or US$206 dollars per month, equivalent to US$6.87 dollars per day).17
III. Results and discussion
This section reports and discusses the results of the analysis of the spatial distribution of poverty in the CBA. It first presents rates of deprivation in individual indicators and our estimates of multidimensional and income poverty. Then, it analyses the relationship between the two types of poverty. Finally, it analyses the dimensional composition and variation across population sub-groups of multidimensional poverty.
A. Deprivations by dimension
Table 2 presents a dashboard of deprivation rates for each of the indicators comprising the MPI-CBA for the CBA, formal and informal neighbourhoods, and each of the city’s districts grouped by zone. The grey scale gradients illustrate the marked spatial inequality in deprivations within the city, a pattern noted by other authors (Macció & Lépore, 2012). The districts in the southern zone have the highest deprivation rates across all indicators, the northern districts have the lowest and the eastern, western, and central zones show intermediate rates.
The location of informal settlements is an important factor explaining the observed spatial distribution of poverty. The districts with the highest shares of the population in informal settlements (districts 8, 7, 4 and 1) have the highest rates of deprivation in most of the individual indicators. However, other factors also seem to be at play. For example, even though it has a lower share of the population living in informal settlements, district 4 has even higher rates of deprivation in housing quality than district 8. This is probably due to the fact that this district contains traditional neighbourhoods in which tenement houses (or conventillos) classified as low-quality housing are common. This result may also be explained by the variation in housing quality across informal settlements, as well as the fact that the available survey data does not adequately measure the dwelling quality. Another relevant example is district 3, which does not contain any informal settlements, has low rates of deprivation in housing and education, but has comparatively high rates of food insecurity and informal employment—situations that tend to characterize new rather than structural poverty.
There also are substantial heterogeneities across dimensions. The introduction of diverse policies to promote school attendance have enabled the CBA to achieve low overall rates of nonattendance and overage attendance. In the informal settlements, however, 4.1% of the population lives in a household with at least one child who does not attend school and 5.3% with a child or adolescent two or more years above the age corresponding to their schooling level. These results suggest that policies to achieve universal school enrolment and timely educational advancement should focus primarily on households in informal settlements. The relative gap in deprivation rates between formal and informal neighbourhoods is particularly high in overcrowding and sleep privacy and less pronounced in the health and work dimensions. Informal employment is ubiquitous throughout the city: at least 1 in 6 people live in households deprived in this indicator in all districts, even the high-income northern zone.
B. Multidimensional and income poverty in the CBA
Table 3 shows the estimates of multidimensional and income poverty for the CBA and each type of neighbourhood. We find that 15.4% of the population of the CBA is multidimensionally poor. The incidence of multidimensional poverty is seven times higher in the informal settlements than in the rest of the city. The multidimensionally poor in informal settlements also experience a higher intensity of poverty (A): they are deprived, on average, in 48% of the weighted indicators, compared with 43% in the rest of the city.
Table 2. Dashboard of deprivations by neighbourhood type, zone, and district (%)
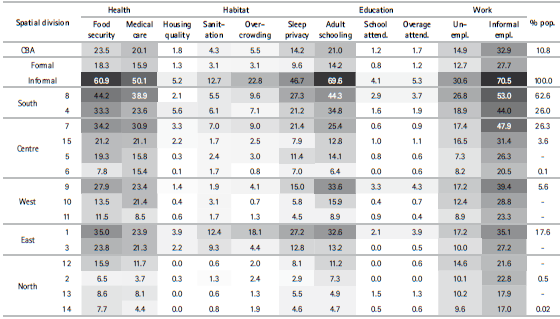
Sources: Authors’ calculations based on DGEC (2019a), except for % population in informal settlements based on SISU (2018).
Table 3. Multidimensional and income poverty indicators
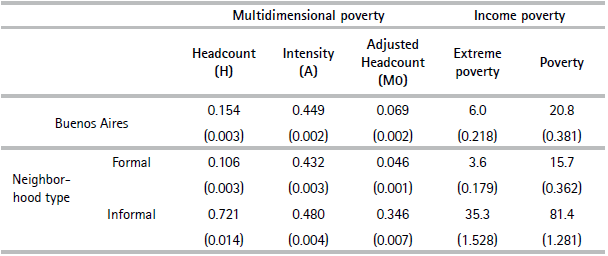
Source: Authors’ calculations based on DGEC (2019a). Standard errors in parenthesis.
As A only measures average poverty intensity, it is also relevant to consider how deprivations are distributed among the multidimensionally poor. In informal settlements, only 36% of the population has a deprivation score ci between 0.33 and 0.40 (values close to the poverty threshold) and 43% are deprived in at least half of the weighted indicators. In the rest of the city, more than half of multidimensionally poor people have deprivation scores between 0.33 and 0.40 and only a quarter are deprived in at least half of the weighted indicators. This means that there is more intense clustering of deprivations in informal settlements than in the rest of the city.
The combined effect of greater poverty incidence and intensity yields an adjusted headcount Mo equal to 0.346 in the informal settlements, nearly eight times higher than for the rest of the city (0.029). The relative gaps in M and Mo between informal and formal is twice as high as the gaps in the individual deprivation indicators, except in the case of overcrowding in which the relative gap is of the same order of magnitude.
Using the income-based poverty measure, individual poverty rates equal 81.4% in informal neighbourhoods, 15.7% in the rest of the city, and 20.8% overall. As expected, the relative gap in income-based poverty rates between informal and formal neighbourhoods is substantially lower (a difference of 5 times) than in the case of multidimensional poverty (nearly 8 times).
C. Relationship between multidimensional and income poverty
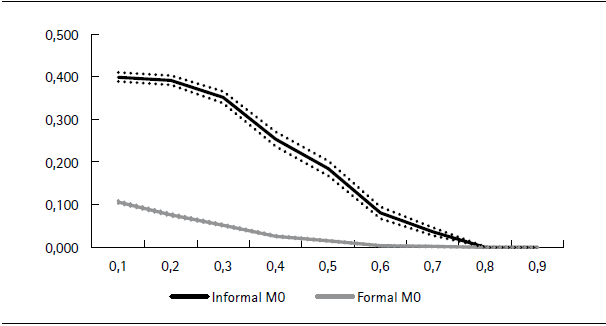
What is the relationship between multidimensional and income poverty in the CBA? Is the relationship different in informal settlements than in the rest of the city? To answer these questions Figure 2 shows, separately for formal and informal neighbourhoods, the value of each multidimensional poverty measure (H or Mo) for people classified as extremely poor, poor but not extremely poor, and nonpoor according to the income-based poverty measure. The staircase pattern observed for both measures and in both types of neighbourhoods illustrates the positive correlation between multidimensional and income poverty. There is, however, a closer association between the two types of poverty in formal than informal neighbourhoods. While outside of the settlements, the extreme income poor are 10 times more likely than the nonpoor to be classified as multidimensionally poor, within the settlements, being extremely income poor increases the likelihood of being multidimensionally poor only by a factor of 1.6. In informal settlements, over half of the nonpoor based on income are classified as multidimensionally poor.
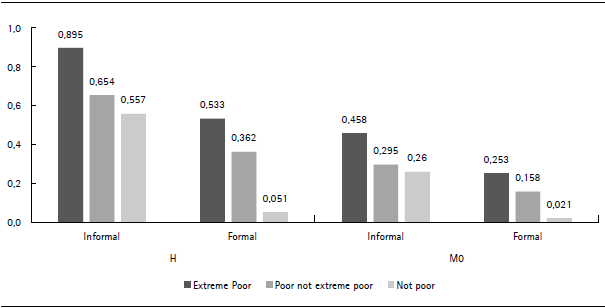
Source: Authors’ calculations based on DGEC (2019a).
Figure 2. Decomposition of H and M0 by income poverty group and neighbourhood type
Do the two poverty criteria identify different people as poor? Figure 3a shows that the extent of identification overlaps between the two poverty measures (either nonpoor or poor by both measures) is 86% in the rest of the city, but only 70% in informal settlements. If poverty measurement were to be based only on income, 1 in 10 people in informal settlements would be incorrectly classified as nonpoor, whereas in the rest of the city the percentage of ‘missing multidimensionally poor’ is only 4%. These results are consistent with previous research showing a lack of overlap in terms of who is identified as poor using alternative poverty measurement approaches (Ruggeri Laderchi et al., 2003) and recent research showing less identification overlap in the poorest countries (Evans et al., 2020).
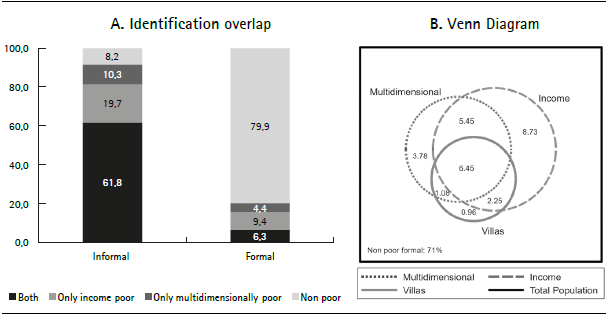
Source: Authors’ calculations based on DGEC (2019a).
Figure 3. Overlap between multidimensional and income poverty by neighbourhood type.
Figure 3b shows the relationship between the population identified as multidimensionally poor, income poor and living in informal settlements. To adjust for the underrepresentation of households in informal settlements in the household survey, the graph was drawn using our updated estimate of the city’s population in informal settlements (10.8%) (see Section 2). We assumed that poverty rates within formal and informal areas remain constant. The figure illustrates the weight of poverty in informal settlements in understanding overall poverty in the city. Informal settlement residents represent close to 10% of the city’s population but account for 38% of the city’s income poor and 45% of the multidimensionally poor.
D. Dimensional composition and profile of multidimensional poverty
We conclude the analysis by examining the dimensional composition of multidimensional poverty and variations in poverty across population subgroups. Following Robes Aguilar and Sumner (2019), Figure 4 depicts the number of people in households deprived in each dimension (vertical axis) that simultaneously accumulate deprivations in each interval of the deprivation score ci (horizonal axis). In formal neighbourhoods, the frequencies of deprivations are low and nearly uniform across a wide range of values of ciin the housing and education dimensions and in income poverty, and are highest in the work and health dimensions. In fact, deprivations in work are most common among the nonpoor .ci between 0.1 and 0.2). In informal neighbourhoods, all dimensions are nearly equally relevant in explaining the accumulation of deprivations, but deprivations in health and housing are the especially frequent among highly deprived people (those with ci >0.50). In both formal and informal areas, deprivations in health are those most frequently experienced by people in house- holds with an intense clustering of disadvantage, an interesting result given the evidence on the role of health in poverty traps (Marx et al., 2013).
To analyse the demographic disparities in poverty, we use the population subgroup decomposability property of H and M0which indicates that overall poverty is equal to the population weighted sum of subgroup poverty levels. Table 4 presents each subgroup’s population share, rates of multidimensional and income poverty, as well as a measure of the subgroup’s contribution to M0, written as Dl0=vl M0 (X l) /M0 (X). 18Dl0depends on subgroup l’s poverty level and share in the total population (v l). The table also presents the results of χ2 tests of the statistical significance of the difference in the poverty rates between subgroups.
In both formal and informal areas of the city, children contribute disproportionately to overall poverty, accounting for 44% of M0in informal settlements and 33% in the rest of the city. This is explained both by the higher rates of poverty among children and, in the case of informal settlements, by the fact that people aged 0-17 represent 40% of the total population. The decomposition by gender shows that women represent a slightly higher share of the total population in both formal and informal areas, but the difference in poverty rates is small and statistically significant only in the case of income poverty in formal areas.
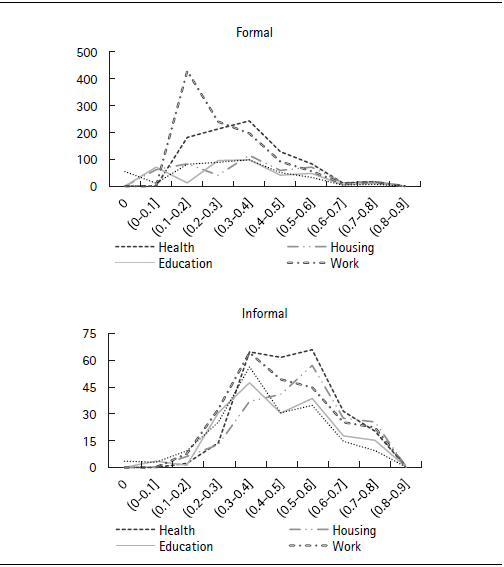
Source:Authors’ calculations based on DGEC (2019a). The y-axis depicts the absolute population (in thousands), and the scale has been adapted to each panel for clarity.
Figure 4. Number of people deprived in each dimension with ci weighted deprivations.
The migratory status of the household head is one of the demographic characteristics that most clearly distinguishes formal from informal neighbour- hoods. Whereas 66% of the population of informal settlements has a foreign head of household (mostly from the poorer neighbouring countries of Paraguay and Bolivia), this group represents only 15% of the population in the rest of the city. Moreover, while in the rest of the city the rate of multidimensional poverty among people with foreign heads of household more than doubles that of rest of the population, in informal settlements the difference is not statistically significant. In the case of income poverty, the difference is statistically significant in both formal and informal areas, but the size of the absolute gap is larger in formal areas. The proximity to other foreign headed households might explain why migratory status loses its relevance as a risk factor for multidimensional poverty in informal settlements.
Table 4. Decomposition of multidimensional and income poverty by population subgroupThe asterisks indicate the statistical significance of x2 tests of the difference in poverty rates between groups; ***p < 0.01; **p < 0.05; *p < 0.10.
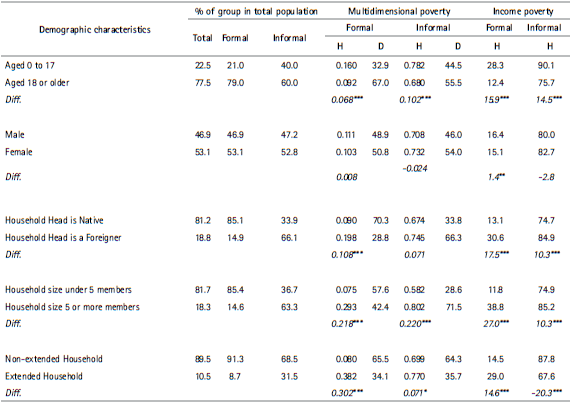
Source: Authors’ calculations based on DGEC (2019a). In all cases the unit of analysis is the population.
Decompositions based on household size and composition also indicate relevant differences by neighbourhood type. Two thirds of the population of informal settlements lives in a household with at least 5 members compared with just 15% in the rest of the city, and large household size is a risk factor for multidimensional and income poverty in all areas. The decomposition between extended19 and nonextended households shows that in the rest of the city only 9% of people live in extended households and poverty rates in this group are far higher than among the rest of population. In informal settlements, where nearly a third of households are extended, multidimensional poverty rates are only slightly higher in this group (and statistically significant only at the 10% level) and income poverty rates are 20 percentage points lower for people living in extended households. This result suggests that in informal settlements combining households in some cases works as a strategy for avoiding monetary poverty but is less effective at avoiding multidimensional deprivation.
Conclusions
The purpose of this paper was to contribute to the literature on poverty measurement in segregated cities by demonstrating the insights that can be gained by using the capability approach as a theoretical framework and the Alkire-Foster method of multidimensional poverty measurement. We described the process of designing an MPI for the City of Buenos Aires and justified our normative choices. We then used this measure to assess the city’s spatial distribution of poverty, analyse the relationship between multidimensional and income poverty, and examine the dimensional composition of poverty and disparities across population subgroups in formal and informal neighbourhoods.
The results indicate that informality creates a great divide in the extent and characteristics of poverty in the CBA. Informal neighbourhoods have both a higher incidence of multidimensional poverty and a wider breadth of deprivations among the multidimensionally poor. The gaps between formal and informal neighbourhoods in the MPI are more pronounced than when comparing individual deprivation indicators. This highlights the importance of going beyond a dashboard of indicators and analysing how the simultaneous occurrence of deprivations (or ‘clustering of disadvantage’) is distributed within the city. We show that these results are robust to changes in the poverty threshold and indicator weights.
The analysis of the relationship between multidimensional and income poverty shows that, although there is clearly a positive association between the measures, the correlation is weaker, and there is less overlap in terms of who is identified as poor in informal settlements than in the rest of the city. Basing poverty measurement only on income produces a greater underestimation of deprivation in informal settlements (10% of people are ‘missing multidimensionally poor’) than in formal neighbourhoods. After adjusting for underrepresentation of the urban slum population in the official household survey, we find that these territories account for only 10% of city’s population but nearly half of the multidimensionally poor. These results point to the need to target poverty reduction policies toward informal neighbourhoods, through community level interventions to improve local infrastructure and social services as well integrated programmes to provide multidimensional social assistance to the most critically deprived households (Barrientos, 2010).
The results also expose the heterogeneity in the conditions of urban poverty. Whereas work and health —problems more closely associated with income poverty— are the most common deprivations outside of informal settlements, housing and health have the highest frequency among the poorest households in informal settlements. The population subgroup decompositions showed the large contribution of child poverty to overall multidimensional poverty, especially in informal areas where children account for 40% of the population. The decompositions by migratory status of the head of household, indicate that while having a foreign household head is a poverty risk factor in the rest of the city, in informal settlements it loses its relevance likely due to the high prevalence of foreign heads within these neighbourhoods. Furthermore, while in all areas of the city, poverty rates are substantially higher for larger households, in informal settlements, the strategy of combining nuclear families enables some households to escape monetary poverty.
The paper also underscores that the choice of multidimensional poverty measurement methodology is important not only conceptually but also can have important policy implications. The decision to not include lack of access to public sanitation in the official MPI, because most of the population has access to this service, carries the risk of diverting public attention and policy away from a problem affecting one in eight households living in informal settlements. The inclusion in our MPI of certain types of deprivation with low citywide prevalence —like school dropout and overage schooling— helped to highlight the need to design policies to promote school access, permanence, and timely progression toward young people living in informal neighbourhoods.
A limitation of this paper is that in designing our MPI, we were constrained by data availability in the AHS survey. There is a critical need to collect better measures of housing and habitat, as well as data on a broader array of well- being dimensions, including aspects that are essential in explaining social exclusion, such as insecurity, social participation and affiliation, and agency. These types of indicators tend to be absent from official household surveys in Argentina, as in many other countries. The redesign of household surveys should include processes of public deliberation in which people —especially those living in situations of poverty— can identify and reflect critically on the functionings and capabilities they most value in their lives.
Overall, the research indicates that a multidimensional poverty framework can provide a sounder basis for diagnosis and policy orientation in future steps toward the urbanization of the city’s informal settlements.