


 English (pdf)
 Article in xml format
 Article references
 Send this article by e-mail
 Cited by SciELO
  Cited by Google
  Similars in
SciELO
Similars in
SciELO  Similars in Google
 Permalink
1. Introduction
Image-processing systems require computational procedures that allow enhancing the relevant information of the digital scene while attenuating the unwanted information[1]. These procedures also demand large repositories of information because the enhanced scene is obtained by means a transformation of the original image[2]. The processed image is at least the same size of the original[3]. Image enhancement techniques[4], mainly focus on enhancing the edges present in the images, while the information inside and outside the objects is homogenized[5].
Since its introduction in the clinical context as a medical imaging modality, the computed tomography (CT) has beneficially impacted on description of complex diseases[6]. Multislice computerized tomography constitutes the most important technological advance of the CT with electrocardiogram gating[7, 8]. This technology allows obtaining information about the dynamical morpho-physiopathology of organs including the heart[9].
In the clinical context, the clinicians explore the images following the traditional method, these images are previously processed using a technique of enhancement developed for improving the image appearance and its visual quality. Nevertheless, the diagnosis generated by each clinician after exploration may be different due to variability between individual interpretations. This is a critical clinical aspect affecting results since there is an increase in the subjectivity of the diagnosis. A decrease in variability can be achieved by applying robust image quality enhancement methods that do not give a wide freedom of visual interpretation.
1.1 Related work
A generalized unsharp masking algorithm is proposed to improve the contrast and sharpness of the images[10]. The algorithm simultaneously enhances contrast and sharpness, it considers an edge-preserving filter in order to reduce the halo effect, and it uses the log-ratio and tangent operations for optimizing the out-of-range problem. The experimental results show that the contrast and sharpness of the images improve significantly with respect to results previously reported.
The Type II fuzzy set theory has been used for enhancing the contrast of medical images[11]. The author proposes a new membership function based on Hamacher T Co norm in order to establish the fuzziness. The proposed uncertainty in the membership function of fuzzy set applied to original image corresponds to the enhanced image. This enhancement scheme exploits a lot of uncertainties of the medical images through the fuzziness in the membership function. The results show that the Type II fuzzy set may be a good tool for medical image analysis.
An improved version of the single-scale Retinex algorithm is developed in order to enhance the low contrast of CT medical images[12]. This version incorporated a scheme for tuning the standard single-scale Retinex in order to improve its enhancement ability. The synthetically and naturally degraded low-contrast CT images are used to test the algorithm. Two quality evaluation metrics (SSIM and UIQI) are considered for verifying the performance of the technique. A contrast improvement and an increasing in the visual quality of the processed images are obtained.
An optimum wavelet based masking algorithm is proposed to improve the contrast of medical images[13]. The scale value of the masking algorithm is dynamically selected using the enhanced cuckoo search procedure which considers the adaptive crossover and mutation genetic operators in order to adjust, automatically, the ratio of nest rebuilding. Brain Web and MIAS database images are used for validating quantitatively this contrast enhancement approach. The obtained results are improved results as compared with other reported literature.
The divide-and-conquer strategy is used in order to decompose the original image into four subspaces. The representation for each subspace is then enhanced individually using the technique of gradient distribution specification. The enhanced image is finally obtained by reconstruction of the four subspace by means the weighted fusion. The results revealed the favorability of the adopted enhancement scheme[14].
Genetic algorithms have been used to design a enhancement method for medical images[15]. The method is applied to gray level images whose frequency distribution is nearly bimodal. The two underlying sub-distributions are strengthened by means of the evolution of the fitness function. The robustness of the method is shown in terms of image quality.
1.2 Purpose
This work focuses on the study of a particular image enhancement technique based on a similarity criterion[16], which has been applied to the enhancement of information contained in images acquired using different cardiac imaging modalities[17-22].
The works that previously reported the use of the similarity-based enhancement technique[17-22] focus on showing the technique as a skillful tool for improving the information associated with medical images. Thus far, no research has been reported about an exhaustive analysis of the similarity criterion. A comprehensive study focuses on three main directions:
To analyze the filter behavior in minimizing the impact of noise and artifacts of cardiac computed tomography images using the computer generated phantom as a dataset.
To optimize the filter configuration in terms of the neighborhood shape required for its application.
To determine whether the complete filter formulation used so far corresponds to the best formulation against the new formulations defined by each component of the filter separately.
In this sense, the main contribution of this paper is a comprehensive analysis of the similarity-based enhancement technique that allows us to deepen in the knowledge about how this approach improving the medical images. This analysis will allow us to determine which component of the criterion has the greater impact on image enhancement and, additionally, will explain which the neighborhood space where such components will be optimally computed.
The paper is organized as follows. Section 2 provides the proposed methodology, the criterion components and the neighborhood space to be analyzed, and our proposed procedure for analyzing the similarity-based image enhancement technique. The results are presented in Section 3. After, in Section 4, we present the qualitative and quantitative discussion of the results. Finally, we conclude this paper in Section 5.
2. Methods
The process in which the fulfillment of the proposed purpose is structured considers three key stages of development, these being the definition of the similarity criterion components, the neighborhood space construction, and the image enhancement technique assessment.
2.1 Similarity-based image enhancement technique
The similarity enhancement is based on merging of two preprocessed versions of an original image according to a similarity criterion. In the number of studies referenced above[17-22], one of the preprocessed images provides an evenly illuminated image that highlights the darkest áreas of the original image, while the other preprocessed image corresponds with a smoothed version of the original. In all cases, one image is a high pass filtered image (I HPF) and the second is a low pass filtered image (I LPF).
The first application of this filter is focused on exploiting the functional relationship between the original bi-dimensional X-ray cardiac image and its smoothed versión[17]. After, the filter is applied to slices of the CT cardiac images in order to measure the difference between the gray-level values of the mathematical morphology filtered image and the Gaussian smoothed image aiming at performing the smoothing and enhancement of left ventricular cardiac cavity information[18, 19]. Finally,[20], [21] and [22] proposed an extended version of the similarity enhancement filter in which the smoothing and morphological filters are applied in (three-dimensional) 3-D space as well as the similarity criterion.
The similarity criterion, Equation (1), corresponds to an unweighted sum of squares of the differences of the intensities of certain image elements (pixels or voxels, for 2-D or 3-D images, respectively) in the I HPF and I LPF. This merging process is performed in a well-defined cross-shaped neighborhood. The result of merging the I HPF and I LPF images based on Equation (1) corresponds to an image (I SEF) with enhanced edges and smoothed uniform regions, which is considered a precise edge map.
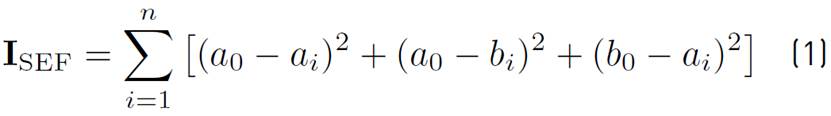
in which the variables a 0 and b 0 represent image elements (in this work they are voxels) a 0 corresponds with a voxel of the I HPF image meanwhile b 0 is a voxel of the I LPF image. These voxels are the central elements of the cross-shaped neighborhoods located in the images to be merged, both neighborhoods are in correspondence in both images, and their location also defines the current voxel in the I SEF to be generated by means the merging process. n is the number of neighbors voxels that in the cross shaped neighborhood varies from 1 to 6. The n-neighbors of a 0 and b 0 are denoted, respectively, a i and b i with i = 1, . . . , n.
In general, if the similarity criterion is considered the kernel of a medical imaging enhancement filter, which aims to establish how similar the input images are, considering a local analysis on a neighborhood that takes into account all direct neighbors to the current pixel/voxel, and whereas the similarity enhancement normally has been used as a preprocessing step for image segmentation based on clustering techniques, the underlying interest of this research is to analyze the impact of each component of the similarity criterion on the medical image enhancement.
In order to examine which component of the criterion has the greater impact on image enhancement, it is very important to define the criterion components to be analyzed and the neighborhood space where such components will be computed.
2.2 The similarity criterion components
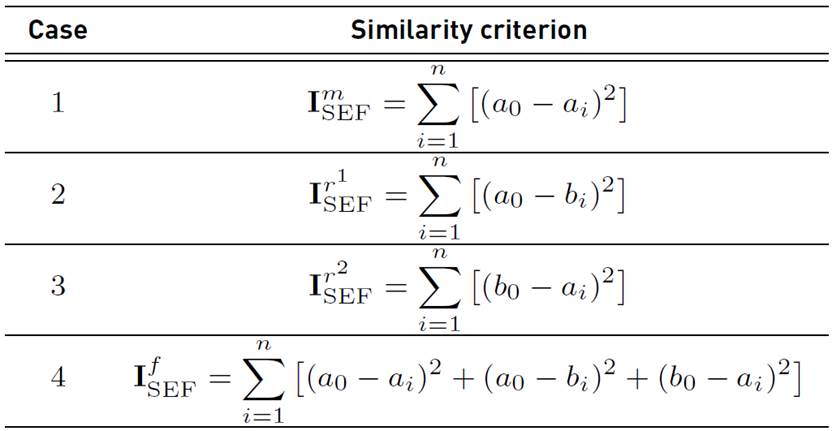
The similarity criterion has three components:
The first component is an unweighted sum of the squares of the finite difference between the central voxel of the high pass filtered image (a 0) and each of their neighbors (ai, ∀i = 1, . . . , n), therefore this component will generate images of high frequency.
The second component involves the finite difference between the central voxel of the high pass filtered image (a 0) and the neighbors (b i , ∀i = 1, . . . , n) of the central voxel of the low pass filtered image (b 0). It is computed as the unweighted sum of the squares of the differences. In this case, both low- and high-frequency image components are preserved.
The final component is obtained by calculating the finite differences between the central voxel of the low-pass filtered image (b 0) and the neighbors (a i , ∀i = 1, . . . , n) of the central voxel of the high-pass filtered image (a 0). It is also finally calculated as the unweighted sum of the squares of the difference.
Four study cases are established. As the similarity criterion is formulated, according to Equation 1, to give greater relevance to the high frequency image (I HPF), the first component (case 1) is now considered the main component of the criterion (hereinafter referred to as the main component and it is labeled with superscript m). Cases 2 and 3 are aimed at merging the information of the high and low frequency images; we consider that these components are associated to portion of information not explained by the complete formulation of the similarity criterion. These two components are examined as residual components (hereinafter referred to as residual 1 and residual 2, and they are labeled with superscripts r 1 and r 2, respectively). Case 4 corresponds with the complete formulation of the similarity criterion (hereinafter referred to as full and it is labeled with superscript f). Table 1 summarizes the case studies.
2.3 The filter neighborhood space
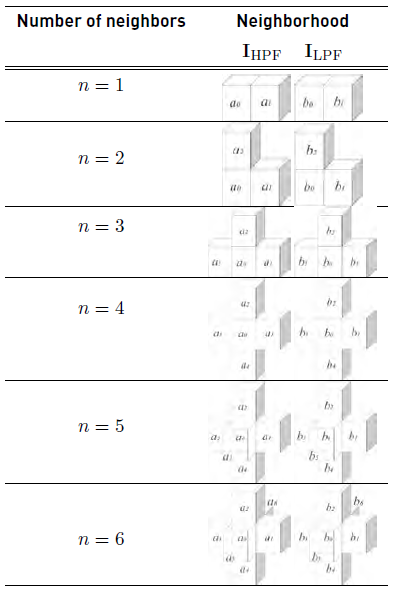
According to the definition of the similarity criterion (section 2.1), if a 0 and b 0 are the central voxels of the cross shaped neighborhoods in I HPF and I LPF, respectively, the number of neighbors to these central voxels vary from 1 to 6. These n-neighbors of voxels are denoted, respectively, a i and b i with i = 1, . . . , n.
Table 2 shows the six possible configurations that the cross-shaped neighborhood can take, if n varies between 1 and 6. For n = 6, in Table 2, the figures correspond with a full cross shaped neighborhood. For this configuration, in the I HPF image, a 0 represents the gray level information of the voxel at position (i, j, k) whereas a 1, a 2, a 3, a 4, a 5 and a 6 represent the gray level values of the voxels (i, j + 1, k), (i, j, k + 1), (i, j − 1, k), (i, j, k − 1), (i + 1, j, k), (i − 1, j, k), respectively. Likewise, voxels in the I LPF image are denoted with b and their respective sub-indexes represent the same position in the neighborhood. The neighborhood space required for analyzing our similarity enhancement filter is then constructed with the configurations shown in Table 2.
2.4 Score function for image assessment
In this work, a score function previously reported[23] is considered for obtaining a metric that allows rating the effectiveness of each study case. This score function was designed taking into account two kinds of image enhancement measures, namely full-reference and blind-reference. The score function is constructed considering the merging of the full--reference and blind--reference image enhancement measures. These measures are normalized between zero and one, and then, they are weighted and added in order to obtain to obtain an overall value that is then averaged to obtain the value of the score. The mean, standard deviation, entropy, mean squared error, mean absolute error, peak signal--to--noise ratio, measure of enhancement, measure of enhancement by entropy, Michelson law measure of enhancement, Michelson law measure of enhancement by entropy, second--derivative-like measure of enhancement, structural similarity, are considered by the score function; the detailed development of the metric can be found at[23].
3. Results
3.1 Experiment with synthetic images
Objective of the experiment
The objective is to qualify by means of visual inspection, the medical image improvement for the four case studies applied to each of six configurations of the cross shaped neighborhood.
Basis
This experiment builds upon a previous work reported in[24] which main objective was to develop an enhancement scheme useful as an image processing procedure for attenuating artifacts in MSCT sequences and improving heart cavities segmentation. A methodology useful for evaluating the intra-subject variability of the complete approach was considered. The segmented shapes obtained from enhanced images are compared with respect to manual segmentations performed by a cardiologist.
IHPF was generated using a scheme based on a morphological filter applied to a smoothed version of the original image obtained by means a combination of a Gaussian filter and a multi-scale Gaussian filter. Meanwhile, ILPF corresponded with a smoothed image achieved by using an average filter. A volume of the sequence analyzed (volume in diastole phase) was used in order to set the morphological filter parameters as follows. The segmentation process was applied by varying each parameter value. For each set of parameters, a comparison between the resulting volume and the ground truth volume traced by the cardiologist was obtained. This comparison was performed using the Dice score and both volume and surface errors. The optimal parameters obtained using this procedure, allow us to achieve a Dice score of 95.36%.
Dataset
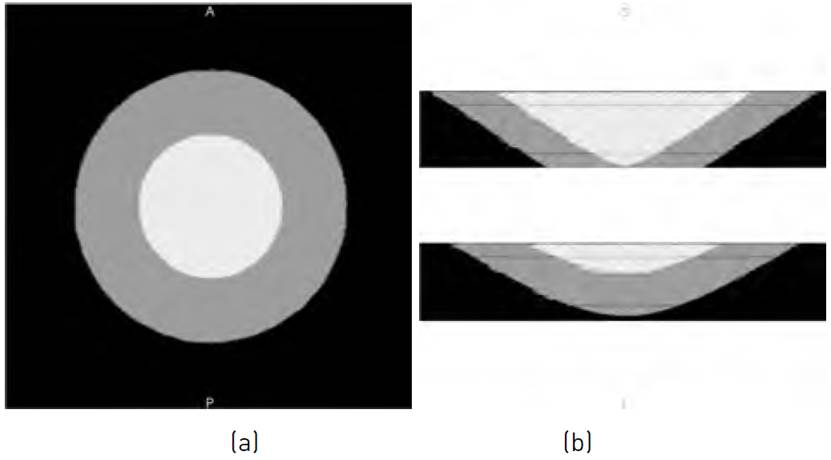
The dataset is constructed in order to simulate the endocardium and the left ventricle wall by means an internal cone and an external cone, respectively. In three-dimensional space, the computer generated cardiac phantom is shown as two truncated cones, inner and outer. The synthetic image size is 256 × 256 × 50, and it is quantized signed to 12-bit. The dimensión of the axial plane is set to 256 × 256 because in this two-dimensional region the left ventricle in a normal CT cardiac scan is located. Moreover, 50 CT slices are considered because that amount represents 20% of a cardiac scan, which is the region size normally scanned for the left ventricle. Figure 1 shows the synthetic image. The axial view at slice 25 is shown in Figure 1.a meanwhile Figure 1.b shows the coronals views at planes 141 and 182 respectively. The image is corrupted with noise using the algorithm proposed in[25].
Theoretically, the noise in CT is directly related to the number of detected X-ray photons. These photons could be modeled using a Poisson distribution[26]. Additionally, we incorporate the main artifacts in heart images such as stair-step and streaks. Stair-step is the artifact caused by wrong selection of the trigger phase or overlapping of reconstructed sections while the streaks are formed when hardened beams pass through heterogeneous regions containing bone structures or contrast media[27].
The dataset constructed with the characteristics indicated above is preprocessed separately with the filters described in the section 3.1 for obtaining the images I HPF and I LPF required by the similarity enhancement technique in this experiment.
Description of the experiment
The idea is to process the images I HPF and I LPF for each of the study cases described in Table 1, and each case is applied considering each of the configurations the cross shaped neighborhoods in I HPF and I LPF described in Table 2. The twenty-four images, thus obtained, are then visually inspected in order to assess the improvement obtained by each combination of cases-neighborhood space.
Results
Figure 2 shows the twenty-four images generated from the each combination of cases-neighborhood space. Figure 2 can be explored as a matrix with the following characteristics, each column represents each case main, residual 1, residual 2 or full, while each row represents a neighborhood space. The first row represents the neighborhood space for n = 1, the other rows for n = 2, 3, 4, 5, 6. Through the visual inspection of images in Figure 2, it has been demonstrated the effectiveness of the similarity enhancement filter in improving the quality of images corrupted with noise and artifacts.
The improvement is specifically obtained for cases 2-4 (residual 1, residual 2 and full) which correspond to the images shown in columns 2, 3 and 4 of the Figure 2. In column 1 of the Figure 2, the results associated with case 1 (main) can be observed, in this case, the filter behaves as an edge detector.
3.2 Experiment with real images
Objective of the experiment
The objective is to quantify the score function for each case of the similarity criterion [Table 1] and for each element of the neighborhood space [Table 2].
Basis
Two strategies of the similarity enhancement are implemented using clinical data. The first strategy considers that the MSCT sequences are processed using the filters, high-pass and low-pass, used in the previous experiment[24]. This strategy is referred to hereinafter as S1.
The second strategy (hereinafter referred to as S2) considers that I HPF is obtained using an edge detector based on gradient magnitude[28] and the original volumen is considered as I LPF.
Dataset
We consider two clinical dataset. A first dataset used in this study was obtained as sequences 4-D (3-D + time) of cardiac images acquired with a scanner (LightSpeed VCT General Electric Medical System). Each database consists of 20 volumes representing anatomical information for a complete cardiac cycle for a patient. The spatial resolution of each volume is (512 × 512 × 326) voxels. In all volumes, the slices have isotropic resolution voxels with a pixels size of 0.488 mm and the slice thickness is the 0.625 mm. Each volume voxel is quantized to 12 bits.
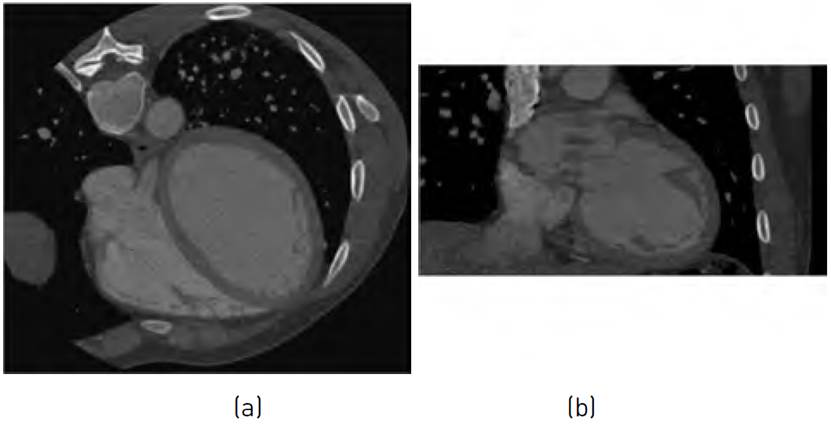
The second dataset corresponds with 4-D cardiac images sequences acquired using a MSCT scanner (Philips Brilliance 64 Host-10236). Each sequence consists of 10 volumes describing the heart anatomical information for a complete cardiac cycle. The resolution of each volumen is (512 × 512 × 324) voxels. The spacing between pixels in each slice is 0.429688 mm and the slice thickness is 0.400024 mm. The image volume is quantized to 12 bits per voxel. Therefore, a total of 1,270 3-D MSCT images from 126 patients is used in the experiment. Figure 3 shows a MSCT image.
Description of the experiment
For each strategy (S1 and S2), the images I HPF and I LPF are processed for each of the case studies and for each of the configurations of the cross-shaped neighborhoods. Forty eight images for each analyzed patient are thus obtained. The score function is quantified for each processed image.
Results
Tables 3-4 present the average values (mean
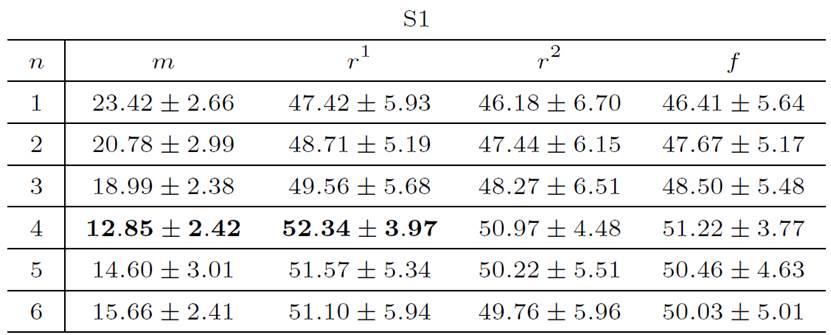
 standard deviation) for the score function for all cases and for all neighborhoods. The score function is calculated after enhancing of 126 clinical databases. The values in these tables are for both enhancement strategies. Overall, it can be observed that the improvement obtained by S1 strategy is of a better quality than those obtained by the S2 strategy. This assertion is supported by the fact that the average score [Table 3] is higher for the S1 strategy tan the score for the S2 strategy [Table 4] for all cases and for all neighborhoods.
For S1 strategy from Table 3, the minimum of the average of the score function of the three last cases is obtained using a neighborhood of n = 1 neighbor. These minimums are 47.42%, 46.18% and 46.41% for the components residual 1, residual 2 and full, respectively. The minimum for main component (case 1) is reached considering n = 4 neighbors and it is 12.85%. The maximum computed using n = 4 neighbors for the score function associated with components residual 1, residual 2 and full are 52.34%, 50.97% and 51.22%, respectively. The component main reached its máximum of 23.42% considering n = 1 neighbor.
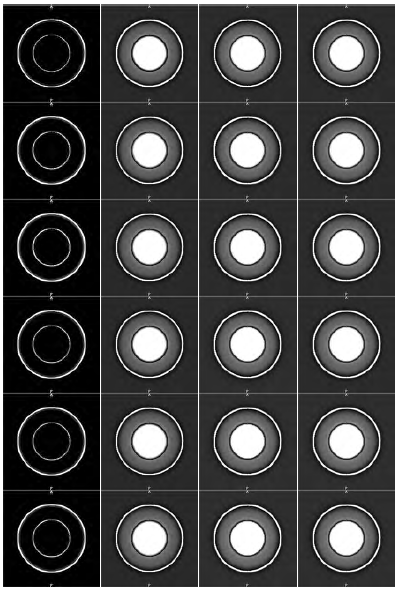
Figure 2 Results of the enhancement in the synthetic image. Each row corresponds to a neighborhood space. Each image in each row is associated with each case, namely, main, residual1, residual2 or full, respectively
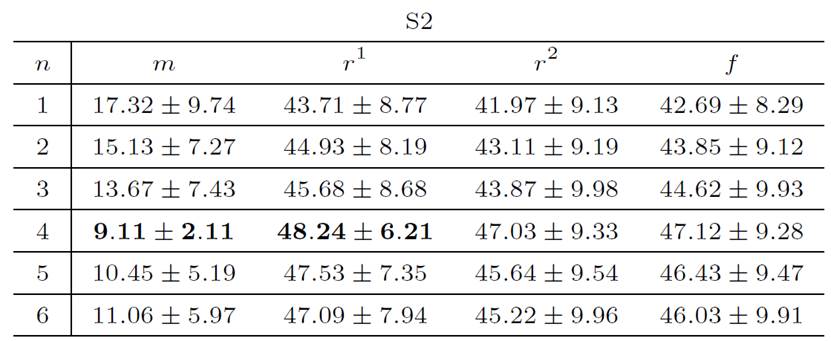
Respecting S2 strategy [Table 4], the maximum and minimum of the average of the score function are obtained for the components residual 1 (case 2) and main (case 1), respectively. Both values are attained using a cross shaped neighborhood of n = 4 neighbors, and they are 48.24% and 9.11%, respectively. For component residual 1 (case 2) the minimum is 43.71% and it is computed for n = 1 neighbor. Concurrently, the maximum value computed for case 1 is 17.32% and it is also attained with n = 1 neighbor. Moreover, the score function reached the maximum for components residual 2 (case 3) and full (case 4) is 47.12% and 47.03%, respectively. These value are computed considering a cross shaped neighborhood of n = 4 neighbors. Meanwhile, the minimum average for both cases (residual 2 and full) is 41.97% and 42.69%, respectively, and they are attained with n = 1 neighbor.
Figure 4 shows the results obtained after performing the experiment associated with the analysis of the similarity criterion components for S1 strategy. In this figure, we can observe a slice of a 3-D MSCT image in each case and for the configuration of the neighborhood space with n = 4. Each image is associated with each case (main, residual 1, residual 2 or full).
Figure 5 shows the results obtained after performing the experiment associated with S2 strategy. Each image is associated with each case (main, residual 1, residual 2 or full). The neighborhood space used is n = 4.
3.3 Technical implementation and run-time
A desktop with an Intel® Core™ i5-2400 CPU (@ 3.10 GHz 3.40 GHz), 16 GB memory and Linux operating system with kernel version 4.10.0-38-generic (x86_64), is used for performing the experiments. The method is codified using C++ and Visualization ToolKit (VTK) [29]. A total of 500 lines of C++ code was written.
For the study cases 1, 2 and 3 a minimum of 1.23 s for configuration n = 1 of the cross shaped neighborhood is required, while a maximum of 7.38 s for configuration n = 6. Meanwhile, the study case 4 requires for running at minimum 3.69 s when the configuration of the cross shaped neighborhood with n = 1 is considered, while a maximum of 22.16.86 s is required for configuration n = 6. For its part, the run-time of the procedure used for computing the score function values is 84.85 s. The run-time is 31.42 s for computing the MSSIM.
These run-times are quantified for the dataset whose volumes are larger, 512 × 512 × 326 voxels.
4. Discussion
The analysis of the results obtained from synthetic data by visual inspection is based on the hypothesis that an image with sharp or enhanced edges is usually more pleasing subjectively than the original image. When the images enhanced are displayed on a high-resolution monitor, some qualitative criteria such as a general quality, sharpness, contrast, and noisiness can be evaluated. Each component of the similarity criterion is analyzed according to these qualitative criteria. Two remarks are appropriate for experiment with synthetic images (section 3.1).
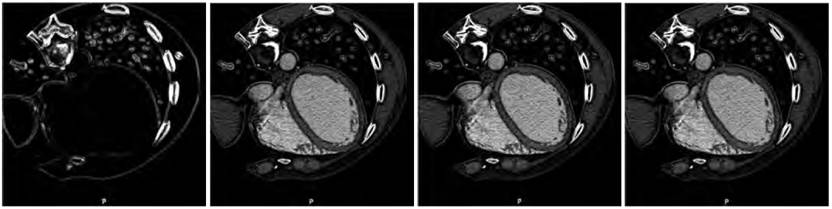
Figure 4 Results of enhancing the real images using S1 strategy. Each image is associated with each case (main, residual 1, residual 2 or full) computed using n = 4 as neighborhood space configuration
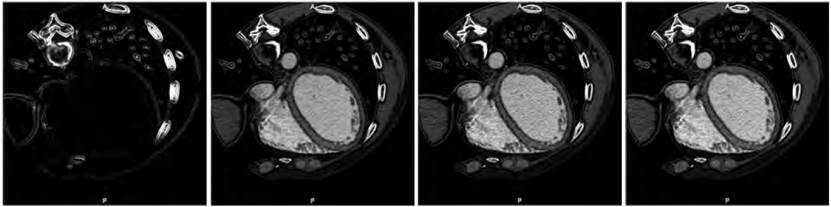
Figure 5 Results of enhancing the real images using S2 strategy. Each image is associated with each case (main, residual 1, residual 2 or full) computed using n = 4 as neighborhood space configuration
First, the component main behaves as an edge detector operator since this component does not improve the subtle details present in uniform regions of the image. Thus, the component main derives the spatial structure of the image when the high frequency details are emphasized. Second, the components residual 1, residual 2 and full allow enhancing all information in the original image. The image contrast is high, the objects edges are sharp and there is no noisy appearance. From the Figure 2, it is verified that the enhancement achieved using the component full generates the wider edges.
Meanwhile, when visually inspecting the results obtained from medical data, we observed that the components of our similarity-based image enhancement technique allow us to emphasize, to sharp, and to smooth medical image features, which facilitates the development of a solution to the problem of the medical image segmentation. The images of the first column of the Figure 5 show the utility of the component main to detect the edges of the anatomical structures located in a computed tomography slice of the thorax for both proposed strategies, S1 and S2. The remaining images of the Figure 5 show how the other components enhance the MSCT slice.
Comparing the values of the Tables 3-4, we observe that the score function, for both strategies S1 and S2, is higher if a neighborhood of n = 4 is considered when the component residual1 is used. In fact, the score function for S1 is better than score function for S2. Additionally, it can be seen that the minimal score in both S1 and S2 strategies is yielded for component main considering n = 4 as neighborhood size.
Reopening the issue of visual inspection, the local structures information (edges) of the original image is very well preserved in the processed image with minimal score function (images of first column of Figure 2, and first images on Figure 4-5). In fact, the component main of the criterion can be thought of as an edge detector operator. The score function associated to image processed with the component main in S2 strategy is significantly lower than the obtained with S1 strategy and the dispersión associated with this minimum average value is also low and it is 2.11%. This is because the main in S2 is linked to a I HPF generated using an edge detector.
Although the best result was achieved with a neighborhood configuration of n = 4 neighbors, and it corresponds to a cross-shaped neighborhood, which considers only two of the direct neighbors located in the axial plane, it is posible to think that the inclusion of all the direct neighbors of cross-shaped neighborhood in the current axial plane, plus the direct neighbors of the anterior and posterior axial planes, that is, a configuration of the neighborhood of n = 6 neighbors would generate the best solution. This is indicative, that enhancing the information associated with a voxel in the cardiac images of MSCT depends, to a greater extent, on the information of the neighboring voxel located in the MSCT slices before and after the slice to which the voxel belongs.
This means, the information of the cardiac structure in the slices after and before of the slice where the image element under study is located, contains more relevant information to define the voxel enhanced that the information associated with neighbor voxels in the current CT slice.
As shown, the component of the similarity enhancement technique that most positively impacts the image quality is residual 1„ however the enhancement also depends on the types of high-pass and low-pass filters chosen to merge by means of the similarity criterion, therefore it would be necessary to study which combination of I LPF and I HPF performs the enhancement with a high degree of reproducibility.
On the other hand, the results of the comprehensive analysis of the similarity-based enhancement technique can be useful in various scenarios such as:
Academic-didactic: Promoting, deepening and potentiating the study of medical image enhancement techniques. We found that the methodology proposed could be used to assess the ability of improvement of image enhancement filters and as an educational tool in image processing courses.
Research: Design and development of robust, automatic and efficient image preprocessing methods. The use of robust and efficient techniques for enhancing of associated information of the cavities and great vessels of the heart is an essential step for applying computational techniques that allow the three-dimensional volumetric visualizations of these anatomical structures, or for segmenting such structures as a necessary step for the quantification of parameters associated with the cardiovascular function.
Clinical: Supporting the planning of therapeutic and surgical processes associated, in general, with cardiac pathologies. World Health Organization states that heart diseases are the leading causes of human death worldwide[30]. And as the quantitative analysis of cardiovascular function plays an important role in the diagnosis of such a disease, the precise description of morphopathology of the cardiovascular structures has a specific impact on the disease assessment.
Further investigations should be undertaken to incorpórate the residual 1 component of the similarity-based image enhancement technique to computational approaches useful in the clinical routine. For example: (1) The application and validation of this technique as preprocessing step in the cardiac anatomical structures segmentation schemes from MSCT images. (2) The validation stage could also include a comparison of estimated cardiac function descriptors with respect to results obtained using other imaging modalities. (3) The application and validation of this enhancement technique can be implemented in other medical imaging modalities.
The present work is aimed at studying the capabilities of the filter based on a similarity criterion as a future work, this research can be extended to be performed an exhaustive comparison of the behavior of this filter, incorporating the conclusions obtained here, with respect to other filters that have reported good performance in cardiac CT imaging enhancement.
5. Conclusions
In this study, the impact of each component of a similarity criterion on the image enhancement has been analyzed. Through quantitative and qualitative evaluations of medical and synthetic dataset, it is demonstrated that robust and accurate automatic enhancement can be achieved. A score function for evaluating the performance of medical image enhancement is used. It is a hybrid of other quality measures proposed in literature, which appears to be the score the best suited to the general problem. A high value of this score function is associated with an effective enhancement.
The component residual1 has been observed to yield better results than the other two components of similarity criterion (main and residual 2) or its complete formulation (full) in terms of image enhancement technique performance. The preceding applies to both checking strategies (S1 and S2). The use of the component residual 1 reduces the execution time of the complete formulation and can effectively enhance the medical image.
A technique to detect edges from medical images is also derived and discussed in this research. Such method is based on the component main of the similarity criterion. Upon this component, we applied the two strategies proposed to detect the edge of the anatomical structures in MSCT images. Both strategies are perfectly useful to detect medical image edges, but S2 strategy shows the minimal value of score function.
For the medical image enhancement issue, the use of component residual 1 shows a noticeable better behavior than any of the two components or the complete formulation of the similarity criterion.

