


 English (pdf)
 Article in xml format
 Article references
 Send this article by e-mail
 Cited by SciELO
  Cited by Google
  Similars in
SciELO
Similars in
SciELO  Similars in Google
 Permalink
I. Introduction
The need to improve the efficiency of energy consumption has been evident in recent decades. Therefore, every discipline is working to improve the processes aimed at improving the energy production and consumption [1-2]. The new developments in technology have increased the electrical energy demand for nonlinear loads, which reduce the power quality of the distribution systems. At the residential level, the nonlinear loads correspond to computers, mobile phones, LED lamps, compact fluorescent lamps (CFLs), etc. Those loads request discontinuous current and therefore deform the voltage waveform of the distribution systems [3].
Academic authorities and researchers developed a workshop on power system harmonics, on January 2014. One of the discussions was about the main issues on harmonics at that time and in the close future. As a result of that workshop, a roadmap was written and published [4]. There is a specific topic in voltage distortion that says: “A reduction in efficiency of end-user equipment was reported in cases with high voltage distortion. This phenomenon should be urgently studied further. If it is shown that this reduction in efficiency is significant, it could form the basis for new voltage-distortion limits.”
Based on the last statement, it is inferred that all the nonlinear final user devices that are connected to the distribution systems, should be evaluated to identify the effect of voltage distortion on their efficiency. In this way, determining the effects of the voltage harmonic distortion into the efficiency of electrical loads will make it possible to revise the harmonic distortion limits defined in regulation documents.
In recent years, replacing incandescent bulbs by CFL has been a successful strategy to reduce electrical losses in lighting systems [5]. However, it has been demonstrated that CFL and LED lamps, when massively installed, can introduce a voltage harmonic distortion into the connected bus; for example, a 12 % system load due to CFLs produces a 9.64 % voltage harmonic distortion [6]. That is a good example of how nonlinear loads increase the voltage harmonic distortion which could affect the efficiency of the connected loads.
The objective of this paper is to show the effect of the supply voltage harmonic distortion into the efficiency of a nonlinear load, in this case a CFL. First, a single line diagram is used to analyze the power consumed by a CFL while it is fed with a voltage source with a harmonic distortion. The apparent power is calculated following the IEEE Standard Definitions for the Measurement of Electric Power Quantities Under Sinusoidal, Nonsinusoidal, Balanced, or Unbalanced Conditions [7]. Then, an experimental bench formed by a three-phase power source with constant voltage and constant frequency, is used to produce different levels of voltage harmonic distortion. The CFL is powered with the source while changing the voltage harmonic distortion and its efficiency is estimated from the active power demanded by the CFL and its produced lumens.
The rest of the paper is organized as follows: Section 2 presents the methodology used in this work; in particular, it presents the mathematical model used in the experiment design. Section 3 describes the experiment design, reporting the experimental results and the discussion. The conclusion closes the paper.
II. Methodology
Figure 1 presents the single line diagram of an electric system formed by a constant voltage source Vs, an impedance Zs, a bus, a nonlinear load requesting discontinuous current, and a target load in which the analysis will be performed. In figure Vload is the voltage in the bus where the loads are connected.
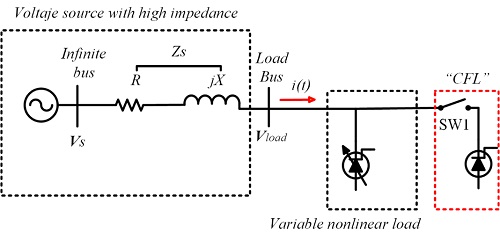
Before closing SW1, the nonsinusoidal current i(t) requested by the variable nonlinear load can be divided into the fundamental and harmonic components as it is shown in (1).
 (1)
(1)
Where the I1 is the magnitude of the fundamental current, Ꞷ1 is the fundamental frequency, and θ1 is the phase angle of the fundamental current. Since the load is connected through an impedance Zs, the demanded current produces a voltage drop. The bus voltage reflects the fundamental and harmonic components of current over the impedance and therefore the voltage at the load node is given by (2).
 (2)
(2)
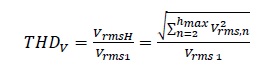
The two first terms of Vload represent the voltage drop caused by the fundamental component of the load current, while the third term represents the voltage drop caused by the harmonic components of the load current. Therefore, any device connected to the load bus will be supplied by a voltage with harmonic distortion. The difference or total deviation of a distorted waveform from the fundamental component is calculated with a harmonic distortion factor. Equation (3) reports the voltage THD. This factor will be used to indicate the harmonic content in the analyzed voltage.
 (3)
(3)
The apparent power demanded by the load is defined by (4), where both load current and voltage are expanded into their fundamental and harmonic components.
 (4)
(4)
The first term corresponds to the fundamental component, the second term is defined as the power of current distortion, the third term is defined as the power of voltage distortion, and the fourth one is defined as harmonic apparent power. A first hypothesis is that the last three terms exhibit an active power component entering into the load that will not have an effect on the load output, which will reduce the load efficiency.
The system presented in Figure 1 is adequate to show how a current with harmonic content, drawn by a nonlinear load, can produce a voltage in the load bus with harmonic content. The system is also adequate to show that the increment of the load reduces the RMS voltage of the load bus. If a constant RMS voltage is required during the increment of the load, it is necessary to introduce a voltage regulator.
The system presented in Figure 1 is implemented in a laboratory of rotating electrical machines. Figure 2 shows the electrical scheme of the experimental bench. The voltage source with high impedance is implemented with a pair of synchronous machines. A synchronous motor (SM) is used as a constant speed driver ensuring a constant frequency in the synchronous generator (SG), and consequently its RMS voltage. Because the RMS voltage of the generator is reduced with the increment of the electric load, the field current of the SG can be adjusted for every load value to keep constant the SG voltage. With this set of synchronous machines, it is possible to produce a bus with a constant RMS voltage facing a variable load.
On the other hand, to produce a variable harmonic content of voltage in the load bus, a variable nonlinear load is connected to the SG, see Figure 2. The nonlinear load is implemented with another set of electrical machines. The set is composed by a speed driver feeding an induction motor (IM), which drives a dc generator (DC G). The increment in the voltage distortion in the load bus occurs due to the increment in the nonlinear current of the speed driver, which flows throughout the synchronous impedance of the SG producing harmonic voltage drops as can be seen in the third term of Equation (2). The increment of the current of the IM occurs due to the increment in the load of the DC G. The load of the DC G are incandescent bulbs connected to its terminals. Therefore, connecting incandescent bulbs to the terminals of the DC G will produce an increment in the voltage harmonic content of the load bus.
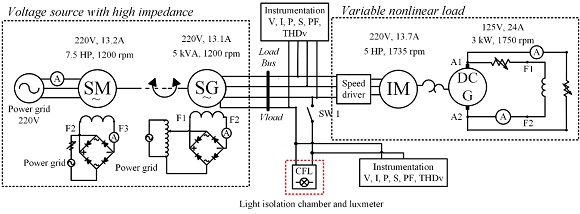
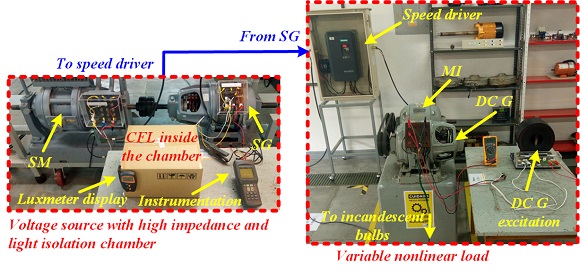
Figure 3 presents photographs of the test bench built to reproduce the electrical behavior of the system shown in Figure 1. The initial operation conditions of the experiment consist into drive the SM until nominal speed and adjust the excitation field of the generators to reach its nominal voltage. Then, a CFL is connected to a phase of the three-phase bus when the voltage distortion is the lower one achievable with this bus, and this is the condition to measure the first data set. Subsequently, the dc generator is charged increasing the THDV of the CFL source voltage, and the input and output variables of the lamp are registered. A single-phase harmonics analyzer is connected to the CFL terminals, in this case a Fluke 41B. Such analyzer measures and stores the voltage, current, active, reactive, and apparent power, power factor, and voltage total harmonic distortion. Because the CFL output is light, it is measured as luminous flux in Lumen (lm). During the experiment, the luminous flux of the CFL was measured using the luxmeter TPM LX1010BS. It was necessary to isolate the lamp and the luxmeter into a chamber (cardboard box) to avoid the effect of other light sources on the luxmeter measurement. The efficiency of the lamp is estimated as lumens per watts, i.e. measuring the input power of the lamp in watts (W) and the output luminous flux in lumen (lm). A classical procedure to calculate efficiency as the ratio of output power over input power it is not possible in this type of loads. This process was repeated increasing the dc generator load, and registering the input and output variables of the CFL.
III. Results and discussion
Figure 4 reports the rms value of the load voltage and its THDV, calculated with (3) in function of the number of incandescent bulbs connected to the dc generator. The THDV changed from 8.2 [%] to 15.3 [%] during the experiment. Those results confirm that the THDV changes while the rms value remains constant. For every load connected to the dc generator, the CFL variables are recorded: current, active power, reactive power, apparent power, power factor and lumens in function of the THDV.
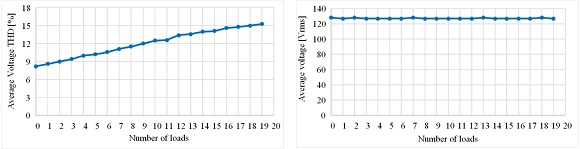
Figure 4 Variation of the total harmonic distortion of load voltage and its rms value during the experiment.
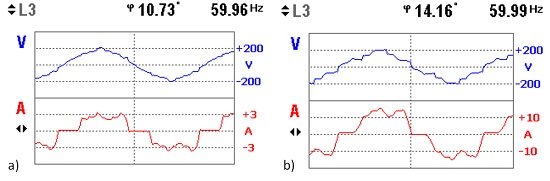
Fig. 5. Waveforms of voltage in the load bus and nonlinear load current. a. Minimun THDv b. Maximun THDv.
Figure 5 presents the waveforms of the bus voltage and the nonlinear load current registered for two operating conditions of the system. Those waveforms were registered during the characterization of the electrical machine sets as a voltage source with constant RMS value and a variable THDv. Figure 5a was registered when the nonlinear load was recently connected to the SG; while the voltage waveform presented in Figure 5b corresponds to the maximum possible current drawn by the nonlinear load. The voltage waveforms presented in Figure 5 have approximately the same magnitude, but the different harmonic content is evident.
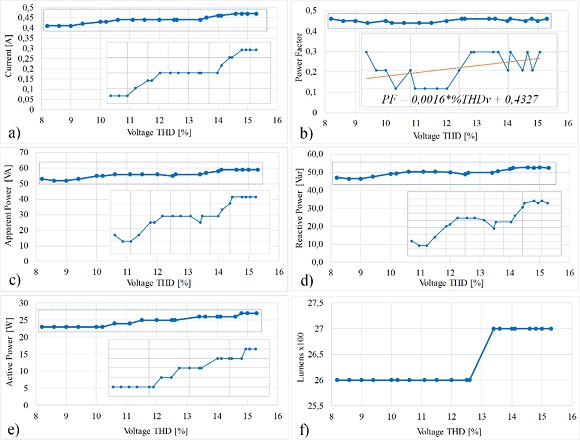
Fig. 6. Results of the experiment that verify the impact of varying the THDV on the efficiency of a residential load.
Figure 6 presents the behavior of the variables during the experiment. Figure 6a shows the rms current requested by the CFL. The figure reports an increment of the current, while the source voltage is constant, but with increments in the THDV. Those results show a dependency of the current requested by the CFL with respect to the voltage harmonic distortion, but the current increment is nonlinear with respect to the increment of the THDV. The figure shows two current increments: the first one is a current increment from 0.41 to 0.44 A when the THDV changes from 9 % to 10.6 %; the second one is a current increment from 0.44 to 0.47 A when the THDV changes from 13.4 % to 14.6 %. Figures 6c, 6d and 6e report the variation of the apparent, reactive and active powers, respectively, for a variation in THDV. The apparent and reactive powers exhibit a similar variation pattern. During the first six registers the active power does not change, while both apparent and reactive powers change with the same pattern. The reactive power changes from 47.1 to 52.4 Var, i.e. an increment of 5.4 Var, which corresponds to an increment of 11.25 % of the initial value. Similarly, the apparent power changes from 53 to 59 VA, i.e. an increment of 11.32 %; while the active power changes from 23 to 27 W, which corresponds to an increment of 17.39 %. The power factor, reported in Figure 6b, is almost constant around 0.45 inductive for all the experiment. Finally, Figure 6f reports the change of the lumens produced by the CFL. It is observed that a single change occurs due to the variation of the THDV, which occurs when the THDV changes from 12.6 % to 13.4 %. Instead, the other changes on the THDV do not produce changes on the CFL lumens. The change on those lumens is from 2600 to 2700 lm, i.e. 3.84 %.
Contrasting the active power demanded by the CFL with the change of the produced lumens and the variation of the THDV, it is concluded that increments on the THDV reduced the CFL efficiency. This is observed in the increment of the active power requested without significant increments on the lumens produced by the CFL.
Therefore, higher THDV forces the CFL to consume higher power for the same lumens production.
IV. Conclusion
The effect of the voltage harmonic distortion over the efficiency of a CFL has been experimentally evaluated in this paper. The analysis of results shows that increments in the voltage total harmonic distortion, on a CFL, between 8.2 % and 15.3 %, and keeping constant both rms voltage and frequency, produce increments in the current, active power, reactive power and apparent power, but the light production remains almost constant. The increment in the input current of the CFL implies an increment in the electrical losses of the final user devices, hence it confirms the efficiency reduction. The results put into evidence the requirement of defining standard tests to evaluate the efficiency of final user devices, and also the need to review the harmonic distortion limits in regulation documents.

