


 English (pdf)
 Article in xml format
 Article references
 Send this article by e-mail
 Cited by SciELO
  Cited by Google
  Similars in
SciELO
Similars in
SciELO  Similars in Google
 Permalink
I. INTRODUCTION
The Saber tests correspond to external standardized evaluations applied by the ICFES (Colombian Institute for the Evaluation of Education), whose objective is to evaluate students’ performance according to the basic competencies established by the Colombian Ministry of National Education. These tests evaluate the students’ performance at the end of the basic and secondary education levels: Saber 3º and 5º in primary education, Saber 9º at the end of lower secondary education, and Saber 11º at the end of secondary education [1]-[5]. These tests aim to adjust the educational policy and stimulate the quantitative and qualitative growth of the country’s educational system regarding coverage or number of beneficiaries and quality [6]-[8].
In the last decade, the exams applied by the Ministry of Education that assess the quality of education in Colombia has allowed the dissemination and access to datasets that can be used in studies aimed at characterizing and explaining the performance of students in different competencies associated with diverse areas of knowledge [9]. However, in Colombia, and the specific case of the open data strategy, few datasets are adequate for spatial analysis in the educational context. Most of the studies have focused on non-spatial exploratory analysis and data mining strategies [10]-[16]. The spatial analysis of data involves a set of techniques and models that specifically use the spatial or geospatial reference of each instance belonging to the dataset to determine spatial correlations [17]-[19].
This paper presents an exploratory study based on spatial analysis of the dataset that includes the results of the 2016 Saber 5 test for the areas of Mathematics, Language, and Natural Sciences. This dataset classified the number of students associated with the levels “Insufficient”, "Minimum", "Satisfactory", and "Advanced" according to the 33 departments of Colombia and the knowledge areas mentioned above. The study aimed to identify statistical and geospatial relationships in the selected dataset using the free software tool (GPL licensed) GeoDa [20] to obtain value-added conclusions useful for the decision-making processes by the Ministry of National Education and relevant authorities. Likewise, this study is intended to serve as a reference to be extrapolated to other educational contexts, such as the Saber tests implemented in secondary and higher education.
The rest of the article is organized as follows: Section 2 presents the methodological phases that guided the development of this research, section 3 describes the results obtained from the spatial analysis of the dataset corresponding to the 2016 Saber 5 test, section 4 presents the conclusions and future work derived from the study.
II. METHODOLOGY
For the development of this research, four methodological phases were established: selection of the spatial analysis dataset, correlation analysis, spatial analysis of the data, generation of conclusions from the study (Figure 1).
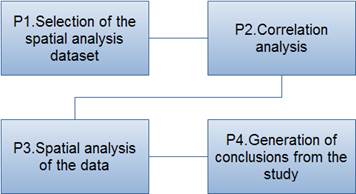
In phase 1 of the methodology, a set of datasets compatible with the spatial data analysis techniques and associated with the Saber test were explored. The datasets available on Colombia's ESRI open data portal were reviewed, and the 2016 Saber 5 test dataset was selected (https://datosabiertos.esri.co/datasets/esri-colombia::estudiantes-por-nivel-de-desempeno-pruebas-saber-grado-5/about), which was available in shapefile format (compatible with the GeoDa tool). The selected dataset has a total of 33 records or instances associated with the number of students per department in the "Insufficient", "Minimum", "Satisfactory", and "Advanced" levels in the areas of Language, Mathematics, and Natural Sciences. From the dataset selected in phase 1, a correlation analysis was implemented in phase 2 on the attributes associated with the student performance levels for the three areas considered. In phase 3, the spatial analysis of the data was carried out by obtaining spatial quantiles and applying clustering models for the "Advanced" and "Insufficient" levels in the areas of Language, Mathematics, and Natural Sciences for the different departments of the country. Finally, in phase 4, the results were consolidated, and the conclusions derived from the study were obtained.
III. RESULTS
The dataset selected for this study includes geospatial data related to the performance of primary school students of the different departments of Colombia in the areas of Mathematics, Language, and Natural Sciences. This dataset has a total of 33 records or rows, which include the number of students per department that are classified in different performance levels ("Insufficient", "Minimal", "Satisfactory", and "Advanced") for the areas mentioned. Thus, Table 1 describes the main attributes associated with the 33 records of the dataset considered in this study.
Table 1 Description of the main attributes of the dataset.
| Attributes | Description |
|---|---|
| DANE | Corresponds to the identifier assigned to each department by the National Administrative Department of Statistics. |
| Departament | Corresponds to the name of the department of Colombia. |
| Language_I, Language_M, Language_S, Language_A | Corresponds to the number of students per department whose Saber test score in the area of Language was classified in the following levels: "Insufficient", "Minimal", "Satisfactory", and "Advanced". |
| Math_I, Math_M, Math_S, Math_A | Corresponds to the number of students per department whose Saber test score in the area of Mathematics was classified in the following levels: "Insufficient", "Minimal", "Satisfactory", and "Advanced". |
| NScienc_I, NScienc_M, NScienc_S, NScienc_A | Corresponds to the number of students per department whose Saber test score in the area of Natural Sciences was classified in the following levels: "Insufficient", "Minimal", "Satisfactory", and "Advanced". |
A. Regression Analysis
This section presents the linear regression analysis of the attributes associated with the "Insufficient" and "Advanced" levels in the areas of Language, Mathematics, and Natural Sciences. Figure 2 shows the regression analysis of the "Insufficient" level, which allowed to determine a high linear correlation between the pairs of attributes: "Language_I" and "Math_I", "Language_I" and “Math_I”, “NScienc_I”. The highest correlations correspond to the pairs of attributes: "Language_I" and "NScienc_I", "Math_I" and "N_Scienc_I", with a determination coefficient of 0.974.
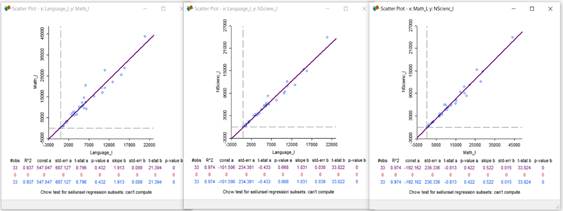
Similarly, Figure 3 shows the regression analysis of the "Advanced" level of the areas of Language, Mathematics, and Natural Sciences, which allowed to determine a high correlation between the pairs of attributes: "Language_A" and "Math_A", "Language_A" and "NScienc_A", "Math_A" and "NScienc_A". The highest correlation corresponds to the pair: "Language_A" and "NScienc_A", with a determination coefficient of 0. 998.

Through the above results, it is possible to conclude that although the linear correlations of the "Insufficient" and "Advanced" levels have a high coefficient of determination, the correlations of the "Advanced" level for the areas of Language, Mathematics, and Natural Sciences are higher than those of the "Insufficient" level.
B. Quantile Analysis
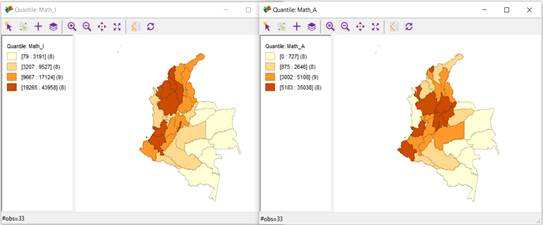
Once the regression analysis was completed, the analysis at the quantile level was implemented in the dataset's attributes. For each area (Language, Mathematics, and Natural Sciences), the geographic distribution of the Advanced and Insufficient levels was considered at 4 quantiles. Thus, Figure 4 shows the 4-quantile analysis for the "Insufficient" and "Advanced" levels in the area of Language (figures on the left and right, respectively). It also shows how the departments of Valle, Antioquia, and Atlántico were grouped for the area of Language in the quantile with the highest number of students for the "Insufficient" and "Advanced" levels (red quantile). Likewise, it is possible to observe how the departments that obtained a greater number of students at the "Advanced" level were: Bogotá D.C., Valle del Cauca, Antioquia, Santander, Cundinamarca, Nariño, Atlántico, and Boyacá. It is also important to mention that the departments of Bogotá D.C., Valle del Cauca, Antioquia, Cundinamarca, and Santander are within the top 5 departments with the best GDPs in the country for 2020 (https://www.dane.gov.co/files/investigaciones/pib/departamentales/B_2015/Bol_PIB_dptal_2020preliminar.pdf).
On the other hand, Figure 5 shows the 4-quantile analysis for the "Insufficient and Advanced" levels in the area of Mathematics (figures on the left and right, respectively). Addittionally, it shows that the departments with the highest number of students at the "Advanced" level of performance were: Nariño, Valle, Antioquia, Cundinamarca, Santander, Bogotá D.C., Boyacá, and Atlántico. As indicated in the analysis of the Language area, 5 of the 8 departments mentioned are in the top 5 (Bogota D.C., Valle del Cauca, Antioquia, Cundinamarca, and Santander) with the best GDPs in the country for 2020. Consistent with the above, the departments with a lower number of students at the "Advanced" level were the following: Amazonas, Guaviare, Vaupés, Guainía, Vichada, Arauca, Chocó, and San Andrés y Providencia, 6 of which had the worst GDPs for 2020 (Guaviare, Amazonas, Vichada, Guainía, Vaupés, and San Andrés y Providencia).
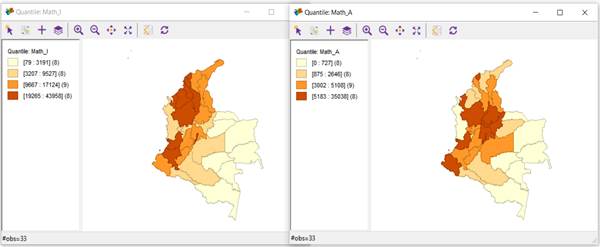
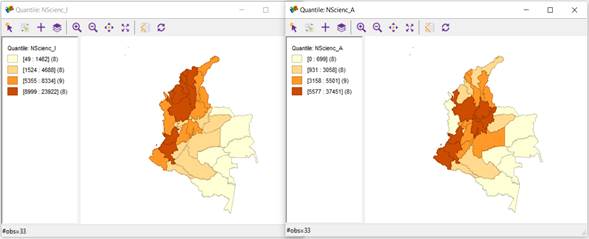
Figure 6 shows the 4-quantile analysis for the "Insufficient" and "Advanced" levels in the area of Natural Sciences (figures on the left and right, respectively). It is possible to see from Figure 6 how the departments of Cauca, Valle, and Antioquia were grouped for the area of Natural Sciences in the quantile with the highest number of students for the "Insufficient" and "Advanced" levels (red quantile). Likewise, the departments with the highest number of students at the "Advanced" level were: Nariño, Cauca, Valle, Antioquia, Cundinamarca, Santander, Bogotá D.C., and Boyacá. As indicated in the analysis of the Mathematics area, 5 of the 8 departments mentioned are in the top 5 departments (Bogotá D.C, Valle del Cauca, Antioquia, Cundinamarca, and Santander) with the best GDPs in the country for 2020. In addition, the departments with a lower number of students at the "Advanced" level were: Amazonas, Guaviare, Vaupés, Guainía, Vichada, Arauca, Chocó, and San Andrés y Providencia, 6 of which had the worst GDPs for 2020 (Guaviare, Amazonas, Vichada, Guanía, Vaupés, and San Andrés y Providencia).
C. Clustering Analysis
This section presents the clustering analysis performed for the "Insufficient" and "Advanced" levels in the areas of Language, Mathematics, and Natural Sciences. Thus, Figure 7 shows the clustering analysis after applying the KMeans algorithm with 5 clusters for the "Insufficient" level in the areas of Language, Mathematics, and Natural Sciences.
It is possible to observe from Figure 7 that the cluster including the highest number of students for the 3 considered areas of the test at the "Insufficient" level is cluster 5, whose centroid is C5={Language_I=20812, Math_I=43958, NScienc_I=23922}, which geographically corresponds to the department of Antioquia. Likewise, the cluster that groups the lowest number of students for the 3 areas of the test at the "Insufficient" level is cluster 2, whose centroid is C2={Language_I=821.667, Math_I=1626.78, NScienc_I=790}, which geographically includes the departments of Amazonas, Vaupés, Guaviare, Guanía, Vichada, Casanare, Arauca, San Andrés y Providencia, and Quindío.
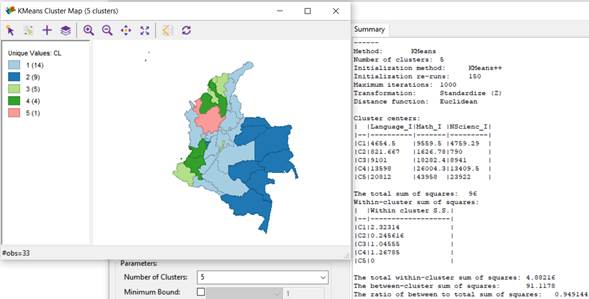
Figure 8 shows the clustering analysis using the KMeans algorithm with 5 clusters for the "Advanced" level in the areas of Language, Mathematics, and Natural Sciences.
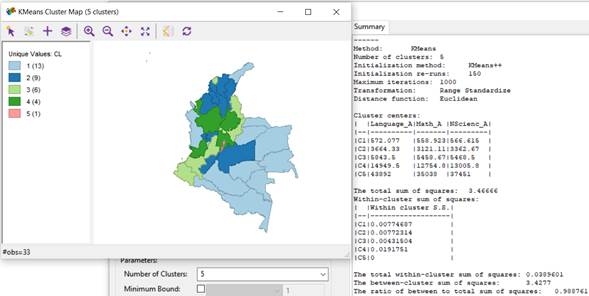
Figure 8 evidences that the cluster with the highest number of students for the 3 areas of the test at the "Advanced" level is cluster 5, whose centroid is C5={Language_A=43892, Math_A=35038, NScienc_A=37451}, which geographically includes Bogotá D.C. Likewise, the cluster that groups the lowest number of students for the 3 areas of the test at the "Advanced" level is cluster 1, whose centroid is C1={Language_A=572.077, Math_A=558.923, NScienc_A=566.615}, which geographically includes the departments of: Amazonas, Putumayo, Caquetá, Guaviare, Vaupés, Guainía, Vichada, Casanare, Arauca, Chocó, La Guajira, Quindío, and San Andrés y Providencia.
IV. CONCLUSIONS
This paper presented a study based on spatial data analysis of the dataset with the results of the 2016 Saber 5 test for the different departments of Colombia in the areas of Mathematics, Language, and Natural Sciences. The study included a correlation analysis, a quantile analysis and a clustering analysis using the advantages provided by the free software tool GeoDa. The study developed in this article is intended to be extrapolated to other educational contexts such as secondary and higher education for decision-making processes by the relevant authorities.
The correlation or regression analysis performed on the selected dataset showed a direct and linear relationship between the number of students from the different departments classified in the "Insufficient" and "Advanced" levels for the areas of Natural Sciences and Language. Similarly, through the analysis based on quantiles and clustering, it was possible to determine a direct relationship between the departments with the best GDPs and those with the best performance in the three areas of knowledge considered in the study.
This research allowed to verify the usefulness of the free software tool GeoDa for conducting studies based on exploratory and spatial analysis of data by using linear correlation methods, determination of quantiles, clustering analysis, spatial correlation based on the determination of the Moran index, among others. In this sense, the GeoDa tool is very useful to enrich the exploratory studies carried out in the educational context, thus, helping in the decision-making processes by the Ministry of National Education and the relevant authorities.
As future research possibilities, there is the application of machine learning techniques based on supervised learning models such as decision trees or association rules after adapting the attributes of the dataset in categorical values.

