


Services on Demand
Journal
Article
 English (pdf)
 Article in xml format
 Article references
 Send this article by e-mail
Indicators
-
 Cited by SciELO
 -
 Access statistics
Related links
-
 Cited by Google
 -
 Similars in
SciELO
Similars in
SciELO -
 Similars in Google
Share

 Permalink
Vitae
Print version ISSN 0121-4004
Vitae vol.19 no.2 Medellín May/Aug. 2012
PHARMACEUTICAL INDUSTRY
COMPARATIVE DIGITAL ANALYSIS OF DIFFERENT PHENYTOIN CRYSTAL HABITS
ANÁLISIS DIGITAL COMPARATIVO DE DIFERENTES HÁBITOS CRISTALINOS DE FENITOINA
Oscar A. FLÓREZ A. Ph.D.1*; Gloria E. TOBÓN Z. Ph.D.1; Jaime A. VALENCIA V. Ph.D.2
1 Departamento de Farmacia. Facultad de Química Farmacéutica. Universidad de Antioquia. Medellín, Colombia
2 Departamento de Ingeniería Eléctrica. Facultad de Ingeniería. Universidad de Antioquia. Medellín, Colombia.
* Corresponding author: oflorez@farmacia.udea.edu.co.
Received: 31 March 2011 Accepted: 28 August 2012
ABSTRACT
Background: Description of the external shape of the particles for pharmaceutical use has usually been subjective, cumbersome or slow, even when the techniques have used digital image processing. This study sought to evaluate the crystal habit of raw material of phenytoin by two digital techniques, one of them based on the edges definition of particles images, using conventional geometric descriptors, and the other one describing the surface texture. These estimates were optimized using multivariate statistical analysis. Objective: The purpose of this study was to evaluate an appropriate way to characterize the crystalline habit of raw materials used in the pharmaceutical industry, from information obtained when it used some digital measuring techniques. Methods: Classical and mathematical descriptors were used, in addition to a modified method of texture analysis technique based on the gray levels co-occurrence matrix (GLCM). Phenytoin was used as the raw material model, since this showed different crystal habits when some conditions were changed in the recrystallization process. The evaluation of measurements was made previously calibrating the meaning of the descriptors with different geometric shapes, and then solving it with the help of multivariate analysis techniques such as principal component analysis (PCA) and hierarchical cluster analysis (ACJ). Results: Calibration figures were grouped into two descriptors based on the degree of homogenization depicted in images of the particles. The crystal habits of phenytoin were defined by compaction and by elongation and irregularity, which was also found with the technique of Matrix Co-occurrence of gray levels of texture measurement. Conclusion: It decreased the subjectivity of the definition of crystalline habits of phenytoin when using a combination of less than four classical and mathematical descriptors, obtained through multivariate analysis. The use of these descriptors, attached to digital method of surface texture analysis of the particles, proved to be a good alternative for use in quality control of solid of multisource pharmaceutical use.
Keywords: Descriptors, texture, multivariate analysis, crystallization, phenytoin.
ABSTRACT
Antecedentes: La descripción de la forma externa de las partículas de uso farmacéutico usualmente ha sido subjetiva, engorrosa o lenta, aun cuando se empleó técnicas de procesamiento digital de imágenes. En este estudio se buscó evaluar el hábito cristalino de la materia prima fenitoína por dos técnicas digitales, una basada en la definición de los bordes de las imágenes de las partículas, utilizando descriptores geométricos clásicos, y la otra que describía la textura superficial. Estas estimaciones fueron optimizadas utilizando el análisis estadístico multivariado. Objetivo: El propósito de este estudio fue evaluar una forma adecuada de caracterizar el hábito cristalino de las materias primas utilizadas en la industria farmacéutica, a partir de la información obtenida cuando se empleó algunas técnicas digitales de medición. Métodos: Se utilizó descriptores clásicos y matemáticos, además de un método modificado de análisis de textura basado en la técnica de matriz de co-ocurrencia de niveles de grises; se utilizó como modelo la materia prima fenitoína, ya que ésta mostró diferentes hábitos cristalinos cuando se modificó algunas condiciones del proceso de recristalización. La evaluación de las mediciones se realizó previamente calibrando el significado de los descriptores con diferentes formas geométricas resolviéndolo posteriormente con la ayuda de las técnicas análisis multivariados como el análisis de componentes principales (ACP) y el análisis de conglomerados jerarquizados (ACJ). Resultados: Las figuras de calibración fueron agrupadas en dos descriptores basadas en el grado de homogenización que representaban las figuras. Los hábitos cristalinos de la fenitoína se definieron por su compactación y por el alargamiento e irregularidad, lo cual también se encontró con la técnica de matriz de co-ocurrencia de niveles de grises (MCNG) de medición de textura. Conclusión: Se disminuyó la subjetividad de la definición de los hábitos cristalinos de la fenitoína cuando se usó una combinación de menos de cuatro descriptores clásicos y matemáticos, obtenidos por medio del análisis multivariado. La utilización de estos descriptores con un método digital de análisis de textura superficial de las partículas, mostró ser una buena alternativa para utilizarse en el control de calidad de las sustancias sólidas multiorigen de uso farmacéutico.
Palabras clave: Descriptores, textura, análisis multivariado, cristalización, fenitoína.
INTRODUCTION
External form characterization of pharmaceutical solids is important because it affects not only the manufacturability properties, but it also can have an effect on the bioavailability properties. Thus, phenytoin, an active multisource ingredient that is used as anticonvulsant, presents significant changes in morphology, according to the crystallization conditions and, therefore, the crystal habit can vary according to the crystallization procedure (1-3).
Digital image analysis techniques provide a higher real-time reliably and faster particle morphology measurements than the manual method. However, management and routine processing are still difficult and less accessible (4, 5).
The regular crystal habit visual inspection consists in comparing the shape of the particle with reference shapes, because they are simple and easy to digitally measure as opposed to the actual particles, which are more complex if routine analytical techniques of high performance are used. On one hand, the descriptors that are based on the particle geometrical shape are called classical descriptors (CD) (6).
On the other hand, there are other techniques called mathematical descriptors (MD), which include an image contour description based on the measurement of the spectral transform, such as when the Fourier transform is applied. Other techniques are based on fractal analysis, Eigen shape analysis, coordinates analysis, or in methods based on measurements made on specific points of a figure. And finally, it is also possible to find hybrid methods of the abovementioned techniques (7 - 9). Most of the MD techniques have variants to describe either the contour or the surface of particles, because an image is presented not only as a silhouette, but it also contains regions with surfaces.
Particle surface evaluation poses the advantage of describing an entire region, doing more robust measurement procedures and providing richer information beyond contour measures; even though, its interpretation is more complex. Texture analysis is a method that merely describes the surface and it is a good alternative to the difficulties encountered in the process of using descriptions as reference geometric shapes (10-12).
Descriptions based on the particle contour
Classical descriptors (CD) use different formulas according to the software employed; therefore, these measures should be analyzed based on the applied equation instead of the descriptor name in order to avoid confusion (13, 14). The simplest CD evaluate size and shape rather than the particle length, and they make a statistical comparison regarding the diameter of a circle that has the same geometric properties (equivalent diameter). The most important measurement used is Féret's diameter (DFeret), although there are other important measurements, like Martin's diameter (DMartin) and the projected area (PArea) (13, 15).
The so-called form factors provide more information because they compare the particle contour diameter measured with the area or perimeter of a circle (2D) or a sphere (3D).
However, none of these CD can precisely specify if a particle is exactly circular, or if it has vertices, or if it is rough. Moreover, CD can confuse regular or irregular shapes when there is a similar length and width ratio. Nevertheless, there seems to be a consensus on using several CD simultaneously instead of only one to achieve an acceptable degree of external form definition (16).
The following are some of the most explored measurement parameters: circularity (or its opposite, elongation), presence of vertices and roughness (surface roughness), homogeneity, solidity or image compaction, in a topological sense (17).
Although CD are still widely used, MD such as the fractal dimension and calculations by Fourier Transforms are very likely to promote more comprehensive techniques, with which both edges as the particle surface can be measured. However, its interpretation remains to be complex, besides the fact that they have different calculation approaches, thus the process of making comparisons should be used with regard to previously constructed databases (18).
Descriptions based on image texture
Unlike the images without texture, which can be processed exclusively based on contour features, texture is an inherent property of surfaces (19). Digital image texture characterization provides information of the statistical distribution of pixel differences in the area of an image, which can be coded in binary arrays and read as changes in the patterns of intensity or of gray levels, which represent the changes in surface elevation (20).
The main difficulty in texture characterization lies in the differentiation of tonality, since both texture and tone are complementary in an image, but there is a method to empirically distinguish them: small variations in the gray tone indicates predominance of the tone; while signif icant variations in a small area is a sign of the texture influence (21).
MATERIALS AND METHODS
Benzoin, nitric acid, acetic acid, urea, sodium hydroxide pellets (Carlo Erba®), hydrochloric acid (HCL, Merck®), ethyl alcohol absolute anhydrous ( J. T. Baker®), acetonitrile (Merck®), n-hexan (Merck®) were used all at a reactive grade.
Infrared Fourier Transform Spectroscopy (FT-IR) was performed with PerkinElmer Spectrum BX® equipment. The solid samples were diluted in KBr. A X-ray diffractometer and a Rigaku Miniflex® were used with a source of Cu, Ka1 (1.542Ao) radiation, and with angles ranging between 3o and 50o. Thin layer chromatography (TLC) plates were made out of aluminum and silica gel, 60 F254, Merck®. The Netszch fox-200 differential scanning calorimeter (DSC) was used with Al crucibles and Ni atmosphere. An optical light microscope (BOECO BM-180 T/SP), a digital camera and a Microsoft Lifecam Vx6000 webcam were also used.
Phenytoin was synthesized by us, according to the method proposed by Hayward (22): benzoin was taken as starting point, which we then proceeded to oxidize with nitric acid in an acetic acid medium in order to obtain the benzyl diketone. The benzyl compound obtained was put under ref lux with an alcoholic solution of urea alkalinized with NaOH (30%), and then it was acidified with HCl (2M) to obtain 5,5-diphenyl-2,4-imidazolidinedione (Phenytoin).
Substance chemical structure identification and evaluation
The IR spectrum (500-3000 cm-1) and Powder X-ray diffraction (PXRD) patterns were obtained by comparing the experimental data with the following database references (3, 23);melting point by DSC (298oC) and purity by TLC (using a mixture of ethyl acetone-chloroform (1:9 v/v) as mobile phase), after a purification process by successive recrystallizations of the starting product.
This work only describes the crystallization procedures on which different samples were obtained. In all of them, phenytoin was dissolved in each solvent while they are at their boiling point. Then, after the solution was filtrated and in as far as it is still hot and supersaturated, it was dissolved in ethanol and its temperature was immediately taken to -5oC to obtain the M4 sample. Phenytoin was dissolved in acetonitrile and its temperature was taken to approximately 25oC. Then, it was left still to allow its temperature to cool down to 10-15oC until the crystals formed, which corresponds to the M7 sample. Phenytoin was dissolved in acetonitrile, and then deionized water at 10 oC was quickly added to it (equivalent to twice the volume of acetonitrile). The mix was constantly stirred and then vacuumfiltered to obtain the M8 sample. Phenytoin was dissolved in hexane and left at room temperature for 24 hrs to produce the M18 sample. The substance in acetonitrilo, with the rapid addition of hexane and cooled to 10-15oC, produced the M22 sample. The solvent completely evaporated during the collection of samples M4, M7, M18 and M22 and after the crystals formed. Two different stainless steel sieves (149-micron and 125-micron) were used for the texture test. Crystalline habits were micro-photographed with a digital camera and an optical light microscope.
Particle contour assessment
Shape Calibration
A preliminary assessment was carried out with the ImageJ software (Rasband, W. National Institute of Mental Health, Bethesda, Maryland, USA) by measuring several figures (a circle, a rough circle, a square, a rough square, a rectangle, a columnar shape, a symmetrical star and a elongated star) to define the benchmarks of the measurements (see Figure 1). This preliminary assessment was done in order to assess the relationship with common geometric shapes and the variation caused by angularity and roughness.
Particle contour measurement
Certain particles that represented the external form were selected from several microphotographs of each sample; then, they were isolated and converted into binary pixels with the ImageJ software. After that, we proceeded to measure the samples.
Classical descriptors
Four representative descriptors were selected based on the fact that the results of the measurements were invariant in comparison to the sizes of the measured particles, and because they provided an approximation of the measurements of circularity, roughness, angularity and compaction. The ImageJ software, which included plug-ins like particles8 and ShapeDescriptor1p, was used for this part of the study. The following were the selected descriptors and the equations used for the measurements: Aspect Ratio (AR): DFeret/amplitude; Roundness: 4Area/(Π* (Larger diameter)2; Solidity: Area/Convex area; Regularity: Area/(Perimeter)2.
Mathematical descriptors
The Fourier descriptors (RFD) and the fractal dimension (DFractal) were used only to describe the particle contours.
The RFD analysis consisted in establishing a point inside the area defined by the edge of the original image and measuring the radial distances to generate the following function:

and thus obtained the coefficients of Fourier trigonometric series
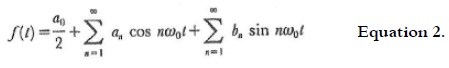
where,
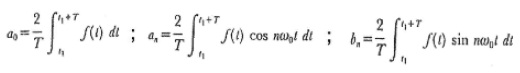
Taking coefficients an and bn, it can be calculated another, cn, which relates them as follows:
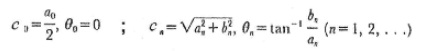
The an, bn, or cn coefficients can be used to identify and recognize images through the RFD analysis, according to the specific application. In this case, cn (c0, c1, [...], c14) was used by means of the Matlab calculation package tools (Image Processing Toolbox. The mathworks, Inc. 1984-2007) (24).
Contour measurement with fractal dimension (DFractal) employs the box counting method, through which the figure perimeter length is calculated by dividing the logarithm of self-similar pieces (N (m)) over the magnification factor .or size. (1/m), according to equation 3:

In practice, log (N (m)) vs. log (1 / m) can be plotted, where DFractal is the slope.
DFractal quantitatively estimate the figure edge complexity with values between 1 and 2 for surface measurements, such as the edges of the figures, and it is invariant regarding the measurement scale (25, 26).
The procedure used for measuring classical and mathematical descriptors is the following: microphotographs of recrystallized solids were taken as the starting point; then, independent particles were selected and binarized. Subsequently, ImageJ plug-ins (Particles8 and Shape descriptor1u) were used for the classical descriptors selected. Fractal Count, another ImageJ plug-in, was used for DFractal; and for the RFD measurement, Matlab software was used.
Surface texture assessment
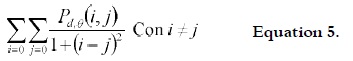
The technique called gray level co-occurrence matrix (GLCM) is used to calculate the texture of images by second-order ''texture histograms'' and it measures the relationships or the gray intensity co-presence probability among neighboring pixels i and j. These pixels are at a d distance and at a θ angle, which provides a bi-dimensional array Pd, θ(i, j) (27, 28). This co-occurrence matrix evaluates every neighboring pixel in an Mx x My image (where x and y are binary numbers) and it can be normalized by dividing each obtained value over the total number of even-number pixels in the image.
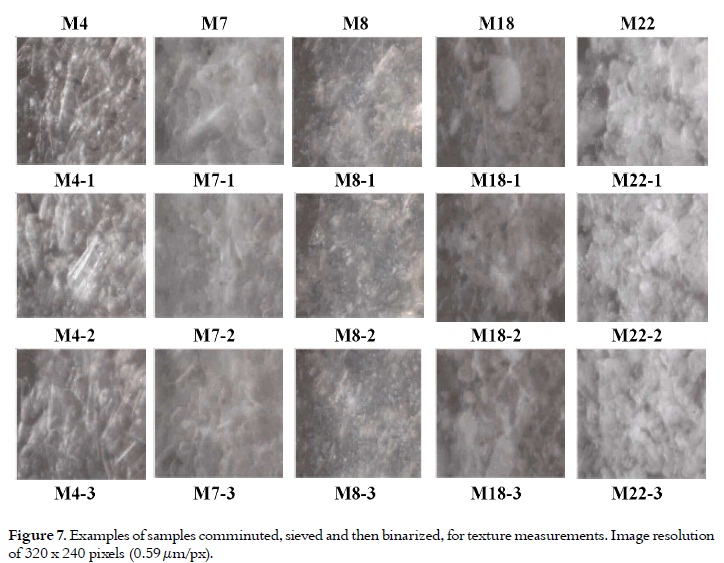
In this case, a modified procedure was used for the texture analysis as follows: the recrystallized solids were passed through a 149-micron mesh with the help of a porcelain pestle. Then, microphotographs of the agglutinated particles that did not have empty spaces were taken using an optical light microscope with a 10x lens. The images have a resolution of 640x480 pixels, and they had to be converted to grayscale (8 bit) to analyze them. Then, they were compared with the neighboring pixels that were at a 90o angle.
The entire image was used for this study and the following characteristics were selected from fourteen textural features originally proposed by Haralick et al., 1973 (21): Entropy (as measurement of the ordering of the pixel values within a window); and the Inverse difference moment (IDM), representative of the measurement of the contrast (20, 29).
Entropy
It is a measurement of the intensity distribution randomization. It provided information about the ''image regularity''. Entropy was high when the elements of Pd, θ (i, j) had similar values and it is low when they had not.

It provided a notion of homogeneity. Its highest values were presented as minor contrasts when the largest elements were on the main diagonal line in the GLCM.
Statistical methods
Assessments were made to the relationship between descriptors and silhouette calibrators, the descriptors themselves, and the different crystalline habits of phenytoin using the correlation technique by means of the Principal Component Analysis (PCA). This technique performs linear and independent combinations of all the initial variables that are orthogonal to each other to reduce the number that has to be considered and to establish new and smaller groups without significant information loss. Then, these results were taken as reference and the hierarchical cluster analysis (HCA) was used in all cases through the square Euclidean method for nearest neighbors in order to specify which variables form similar groups and could collect the greatest homogeneity among the samples analyzed.
In this case, PCA interpretation was based on variance percentage vs. components plots and the graphics of the weight relationships among the principal components. While for the HCA interpretation, the graphical representations of similarity were examined by means of dendrograms that used the cumulative percentage diagrams of the samples. Those techniques are the most popular multivariate analysis methods (30).
RESULTS
Meaning of the responses obtained using the descriptors
Initially, it is necessary to understand the information obtained by using the contour descriptors that are applied in geometric calibration; those are shown in Table 1.
According to the measurements provided by the software, the solidity descriptor tended to evaluate the figure edges softness, therefore, the values decreased in the presence of roughness, mainly when the vertices were sharpened. In the case of roundness measurement, values increased with homogeneity or compactness, apparently without a direct influence from the irregularities. As it was expected for the AR measurement, values increased with elongation and continued to increase with roughness. Now, in the case of the regularity measurement, the effect of the vertices and ridges was detected; and, additionally, the figure elongation made the values decrease. It should be noted that in the case of the circle used as trial, the image was formed by pixels, therefore, the edges were not actually round, thus the value was not exactly what it was expected.
In the case of the mathematical descriptors, Dfractal showed a propensity to differentiate parallelepiped and spherical shapes from other geometrical shapes and it showed a decrease in the values according to the irregularity.
Given the complexity of RFD interpretation, a more logical approach to explain them was according to their similarity with other descriptors by means of multivariate techniques such as PCA and HCA.
Three new components were obtained from this analysis (see Figures 2a and 2b), and these components can explain to a large extent the relationships of all descriptors (reaching 87.85% of the total variance).
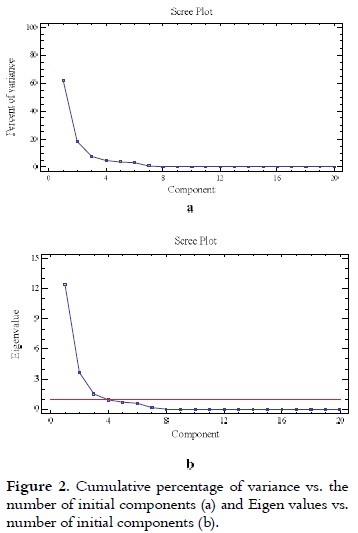
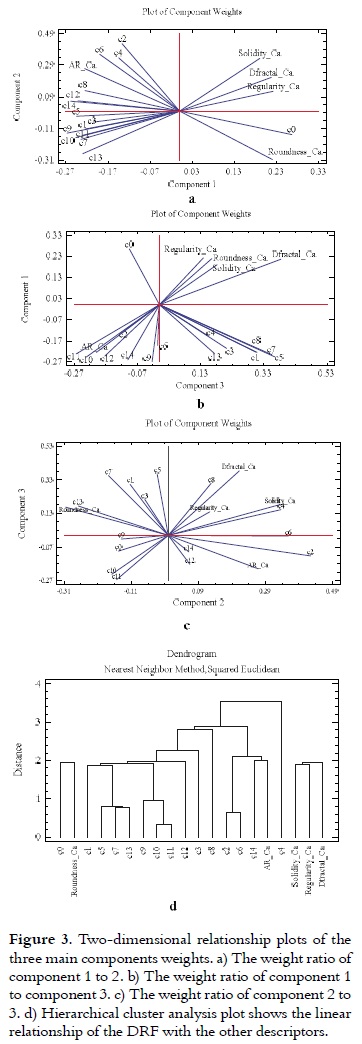
The first component represented homogeneity and compactness in a topological sense, and it was only positively related to the c0 RFD. The second component could be grouped according to irregularity, mainly elongation, and due to the positive participation of the RFD c2, c4, c6, c8, c12, c14. In the third component, which was proportionally lighter than the first two, the roughness measurement effects were grouped, evidencing a positive effect from the RFD c1, c3, c4, c5, c7, c8 and c13 (see Figures 3a, 3b and 3c). These new components were linearly classified in the HCA dendrogram.
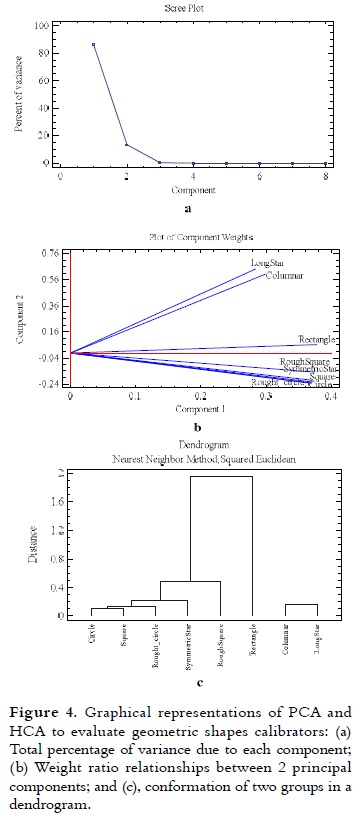
Group meaning of the used descriptors After combining various descriptors and applying ACP and ACJ techniques to evaluate calibrator geometric shapes, it was inferred that these geometric forms can be gathered in two groups (which account for 99.32% of the variance), and they appeared to be based on the figures homogenization degree according to the PCA and HCA graphical results, see Figure 4.
Phenytoin samples results
After analyzing the samples crystalline appearance in Figure 5, the following direct observations were made: the M4 solid looked like columns and needles; the M7 solid had the shape of amorphous or irregular polyhedrons; the M8 habits were well defined medium size flat and rectangular plates; samples in M18 were also plates with irregular edges that presented agglomeration; and the M22 sample was a rectangular block smaller than the M4 and its smaller particles were attached to the largest.
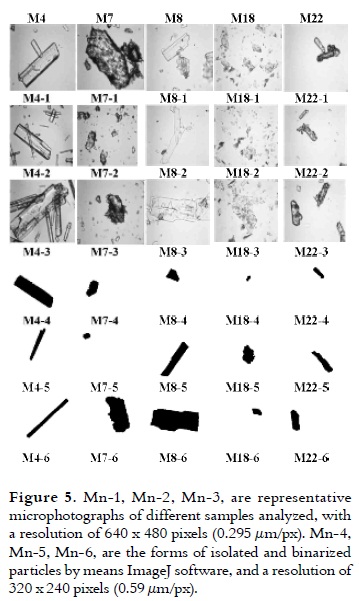
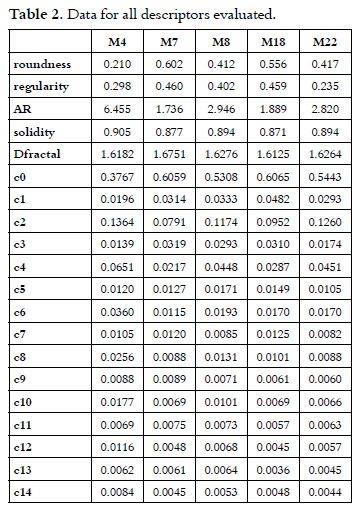
Table 2 summarizes the results of the measurements made to these micrographs with the descriptors and the definitions obtained in the calibration. According to the AR descriptor, it could be inferred that M4 habits were essentially elongated and irregular. M22 and M8 were very similar and had average values in comparison to other habits. The lack of circularity of all samples and the irregularity of the sides and edges were observed through DFractal measurement. In the case of the solidity descriptor, M7 and M18 showed rougher silhouettes. M4 and M8 were the least compact in length-width terms according to the roundness descriptor results. When regularly measured, samples M7 and M18 appeared to be more rectangular and angular than M8 and M22, and even more than M4, which were individually more elongated.
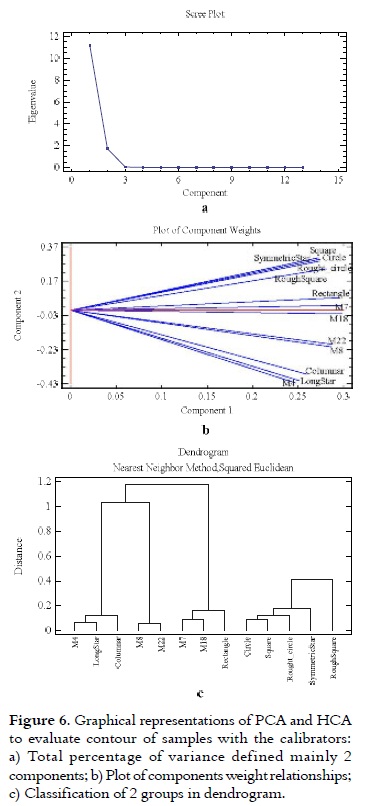
As it can be observed in Figure 6a, the components vs. percentage of variance graphic, created with the results obtained through the PCA technique and gathering calibration and the geometric shapes of the different habits of phenytoin, it was found that all data could be explained by only two new groups (which explain 99.5% of the variance). In Figure 6b, the component weight plot showed that all samples could be collected on the compaction component (positive value); in the case of the second component, irregularity by elongation, the results were negatively influenced by roughness as follows: M4 > M8 > M22 > M18 > M7.
In the cluster analysis, HCA, two group dendrogram confirmed the shape composition, see Figure 6c.
Microtexture results
Table 3 summarizes the results of GLCM technique texture analysis regarding entropy and IDM for the five previously ground and sieved samples.
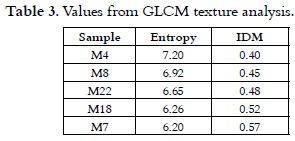
Microphotographs of these samples can be seen in Figure 7. It could be observed that these two textural characterization results were equally related among the samples, but in the opposite way, and they also correspond to the definition of regularity for entropy and the definition of the opposite of homogeneity for IDM.
DISCUSSION
The results showed that all the information obtained by the descriptors could be summed up in two groups. The first one could be of compaction of the figures, where values increasing as the particles were angular and rough, and they showed no negative contributions; the second one, had acicular forms where elongation factor predominated, showing positive effects on the elongated star and columnar forms. The rectangle appeared to have little contribution in either of the two components.
With respect to the phenytoin habits, could be inferred from the results of Table 2, according to the AR descriptor, that M4 habits were essentially elongated and irregular; M22 and M8 were very similar and had average values with respect to other habits; the lack of circularity of all samples, and the irregularity of the sides and edges was evidenced by DFractal measurement; with solidity descriptor, M7 and M18 showed more rough silhouettes; based on roundness descriptor results, M4 and M8 were the least compact in its relation length-width; measuring regularly, the samples M7 and M18 appeared to be more rectangular and angular than M8 and M22, and even more than M4, which were individually more elongated.
The results obtained through the classification of entropy and IDM using principal component analysis (PCA) and HCA, presented a great similarity to the results of sorting the samples by ''visual appearance'' or by expert eye inspection to sort from lowest to highest according to the superficial regularity: M4 seemed to have the smoothest surface, followed by M8, M22, M18 and M7, which was the most irregular.
CONCLUSIONS
Although it is commonly stated that in order to characterize the particles by classical descriptors it is necessary to measure circularity (or elongation), angularity and roughness it was confirmed in this study that using a fourth descriptor is more effective. According to other articles, this fourth descriptor can be called compaction (31-33).
If only classical descriptors are used to characterize particle crystal habit, the obtained representations are considerably subjective and inaccurate. While through mathematical descriptors or the texture GLCM method, numerical values do not have physical meaning and their interpretation would still be unclear, and they should be used as parameters for comparison among samples or between samples and a reference.
Results reveal that phenytoin habits are irregular in both elongation and rough edges.
This work is a contribution to the improvement of digital techniques to characterize the crystal habits of solids that are used in the pharmaceutical industry. It can also be very useful for the routine processes of quality control analysis because it presents a new application of the GLCM texture analysis method, which uses the complete image of the particles. And it is combined with conventional techniques for measuring the contour to characterize the shape of the particles by means of multivariate statistical analysis.
REFERENCES
1. Zippi G, Rodriguez-Hornedo N. Growth mechanism and morphology of phenytoin and their relationship with crystallographic structure. J Phys D Appl Phys. 1993; 26 (8B): B48-B55. [ Links ]
2. Nokhodchi A, Bolourtchian N, Dinarvand R. Crystal modification of phenytoin using different solvents and crystallization conditions. Int J Pharm. 2003 Jan 2; 250 (1): 85-97. [ Links ]
3. Chakrabarti S, van Severen R, Braeckman P. Studies on the Crystalline Form of Phenytoin. Pharmazie. 1978 Jun; 33 (6): 338-339. [ Links ]
4. Pons M, Vivier H, Belaroui K, Bernard-Michel B, Cordier F, Oulhana D, et al. Particle morphology: from visualisation to measurement. Powder Technol. 1999 Jun; 103 (1): 44-57. [ Links ]
5. MacLeod N. Geometric morphometrics and geological shapeclassification systems. Earth-Sci Rev. 2002 Nov; 59 (1-4): 27-47. [ Links ]
6. Wojnar L, Friel J, Grande J, Hetzner D, Kurzydøowski K, Laferty D, et al. Practical Guide to Image Analysis. Ohio, USA: ASM International; c2000. Chapter 7, Analysis and interpretation; p. 145-182. [ Links ]
7. Rohlf F. Relationships among eigenshape analysis, Fourier analysis, and analysis of coordinates. Math Geol. 1986; 18 (8): 845-854. [ Links ]
8. Kim W, Kim Y. A region-basedshape descriptor using Zernike moments. Signal Process-Image. 2000 Sept; 16 (1-2): 95-102. [ Links ]
9. Mundy J, Zisserman A (editors). Geometric Invariance in Computer Vision Taubin. Cambridge, MA. USA: MIT Press; 1992. Chapter 19, Cooper G. Object recognition based on moment (or Algebraic) Invariants; p. 375-397. [ Links ]
10. Peura M, Iivarinen J. Efficiency of simple shape descriptors. In: Arcelli C, Cordella, Sanniti di Baja G, editors. Advances in Visual Form Analysis. 3rd. International Workshop on Visual Form; 1997 May 28-30; Capri, Italy. Singapore: World Scientific; 1998. p. 443-451. [ Links ]
11. Zhang D, Lu G. Review of shape representation and description techniques. Pattern Recogn. 2004 Jan; 37 (1): 1-19. [ Links ]
12. Laitinen N, Antikainen O, Yliruusi J. Characterization of Particle Sizes in Bulk Pharmaceutical Solids Using Digital Image Information. AAPS Pharm Sci Tech. 2003 Oct; 4 (4): 383-391. [ Links ]
13. Pourghahramani P, Forssberg, E. Review of Applied Particle Shape Descriptors and Produced Particle Shapes in Grinding Environments. Part I: Particle Shape Descriptors. Miner Proc Extractive Metall Rev. 2005 Mar; 26 (2): 145-166. [ Links ]
14. Almeida-Prieto S, Blanco-Méndez J, Otero-Espinar F. Microscopic image analysis techniques for the morphological characterization of pharmaceutical particles: Influence of the software, and the factor algorithms used in the shape factor estimation. Eur J Pharm Biopharm. 2007 Nov; 67 (3): 766-776. [ Links ]
15. United States Pharmacopeial Convention. Pharmacopeia USP32 [Internet]. USP32-NF27 ed. Rockville, (MD): Pharmacopoeial Convention. Inc.; 2010. General chapters: <776> Optical Microscopy; (cited 2010 oct 10);. Available from: http://www.uspbpep.com/usp32/pub/data/v32270/usp32nf27s0_c776.html. [ Links ]
16. Bouwman A, Bosmaa J, Vonkb P, Wesselinghc J, Frijlink H. Which shape factor(s) best describe granules?. Powder Technol. 2004 Aug 30; 146 (1-2): 66-72. [ Links ]
17. Barrett P. The shape of rock particles, a critical review. Sedimentology. 1980 Jun; 27 (3): 291-303. [ Links ]
18. Flook A. Fourier analysis of particle shape. In: Stanly-Wood NG, Allen T, editors. Proceedings of the 4th Particle Size Analysis conference; 1981 Sept 21-24; London, UK: Wiley Heyden Ltd; 1982. p. 255-262. [ Links ]
19. Malik J, Belongie S, Leung T, Shi J. Contour and Texture Analysis for Image Segmentation. Int J Comput Vision. 2001 Jun; 43 (1): 7-27. [ Links ]
20. Amadasun M, King R. Texural Features Corresponding to Textural Properties. IEEE T Syst Man Cyb. 1989 Sep-Oct; 19 (5): 1264-1274. [ Links ]
21. Haralick R, Shanmugam K, Dinstein I. Textural features for image classification. IEEE T Syst Man Cyb. 1973 Nov; 3 (6): 610-621. [ Links ]
22. Hayward, RCJ. Synthesis of the anticonvulsant drug 5,5-diphenylhydantoin: an undergraduate organic chemistry experiment. J Chem Ed. 1983 Jun; 60 (6): 512-513. [ Links ]
23. Latrofa A, Trapani G, Franco M, Serra M, Muggironi M, Fanizzi FP, et al. Complexation of phenytoin with some hydrophilic cyclodextrins: effect on aqueous solubility, dissolution rate, and anticonvulsant activity in mice. Eur J Pharm Biopharm. 2001 Jul: 52 (1); 65-73. [ Links ]
24. Tsialtas J, Maslaris N. Leaf shape and its relationship with Leaf Area Index in a sugar beet (Beta vulgaris L.) cultivar. Photosynthetica. 2007: 45 (4); 527-532. [ Links ]
25. Sandau K. A note on fractal sets and the measurement of fractal dimension. Physica A. 1996 Nov; 233 (1-2): 1-18. [ Links ]
26. Martínez-López F, Cabrerizo-Vílchez M, Hidalgo-Álvarez R. A study of the different methods usually employed to compute the fractal dimension. Physica A. 2002 Aug; 311 (3-4): 411-428. [ Links ]
27. Julesz B. Texture and visual perception. Sci Am. 1965: 212 (2); 38-49. [ Links ]
28. Julesz B, Gilbert E, Shepp L, Frisch H. Inability of humans to discriminate between visual textures that agree in second-order statistics-revisited. Perception. 1973; 2 (4): 391-405. [ Links ]
29. Di Ruberto C, Morgera A. A Comparison of 2-D Moment- Based Description Techniques. In: Roli F, Vitulano S, editors. Lectures Notes in computer science: Image analysis and processing. ICIAP 2005, 13th International Conference; 2005 September 6-8; Caligari, Italy. Berlin: Springer Science & Business; 2005. p. 212-219. [ Links ]
30. Fadigas J, dos Santos A, de Jesus R, LimaD, FragosoW, David J, et al.Use of multivariate analysis techniques for the characterization of analytical results for the determination of the mineral composition of kale. Microchem J. 2010 Nov; 51 (2): 352-356. [ Links ]
31. Bowman E, Saga K, Drummond T. Particle Shape Characterisation using Fourier Analysis. Geotechnique. 2001 Aug; 51 (6): 545-554. [ Links ]
32. Flórez-Acosta O, Tobón-Zapata G, Valencia-Velasquez J. Categorization of the main descriptors of different ampicillin crystal habits. Braz J Pharm Sci. 2010 May; 46 (4): 679-685. [ Links ]
33. Pourghahramani P, Forssberg E. Review of Applied Particle Shape Descriptors and Produced Particle Shapes in Grinding Environments. Part II: The Influence of Comminution on the Particle Shape. Miner Proc Extractive Metall Rev. 2005 Mar; 26 (2): 167-186. [ Links ]

