


Services on Demand
Journal
Article
 English (pdf)
 Article in xml format
 Article references
 Send this article by e-mail
Indicators
-
 Cited by SciELO
 -
 Access statistics
Related links
-
 Cited by Google
 -
 Similars in
SciELO
Similars in
SciELO -
 Similars in Google
Share

 Permalink
Revista MVZ Córdoba
Print version ISSN 0122-0268On-line version ISSN 1909-0544
Rev.MVZ Cordoba vol.15 no.2 Córdoba May/Aug. 2010
ORIGINAL
An age structured model for obesity prevalence dynamics in populations
Un modelo estructurado por edades para la dinámica de prevalencia de obesidad en poblaciones
1 Universidad de Los Andes, Facultad de Ingeniería, Departamento de Cálculo, Mérida, Venezuela.
* Correspondencia: gcarlos@ula.ve
2 Universidad Politécnica de Valencia, Instituto de Matemática Multidisciplinar, Valencia, España.
3 Universidad de Córdoba, Departamento de Matemáticas y Estadística, Montería, Colombia.
Recibido: Septiembre 28 de 2009; Aceptado: Marzo 18 de 2010
ABSTRACT
Objective. Modeling the correlation of the development of obesity in a population with age and time and predict the dynamics of the correlation of the development of obesity in a population with age and time under different scenarios in Valencia (Spain). Materials and methods. An age structured mathematical model is used to describe the future dynamics of obesity prevalence for different ages in human population with excess weight. Simulation of the model with parameters estimated using the Health Survey of the Region of Valencia 2000 (4.319 interviews) and Health Survey of the Region of Valencia 2005 (4.012 interviews). The model considers only overweight and obese populations since these subpopulations are the most relevant on obesity health concern. Results. The model allows predicting and studying the prevalence of obesity for each age. Results showed an increasing trend of obesity in the following years in well accordance with the trend observed in several countries. Conclusions. Based on the numerical simulations it is possible to conclude that the age structured mathematical model is suitable to forecast the obesity epidemic in each age group in different countries. Additionally, this type of models may be applied to study other characteristics of other populations such animal populations.
Key words: Age, human obesity, population, mathematical model.
RESUMEN
Objetivo. Modelar la correlación del desarrollo de la obesidad en una población con la edad y el tiempo y predecir la dinámica de la correlación del desarrollo de la obesidad en una población con la edad y el tiempo bajo diferentes escenarios en Valencia (España). Materiales y métodos. Un modelo matemático estructurado por edades fue usado para describir la dinámica de la prevalencia de la obesidad en la población humana con exceso de peso para diferentes edades. La simulación del modelo se realizo con los parámetros estimados usando la Encuesta de Salud de la Comunidad de Valencia del año 2000 (4.319 entrevistas) y la del año 2005 (4.012 entrevistas). El modelo solo considera las subpoblaciones de sobrepesados y obesos ya que estas son las relevantes para la salud. Resultados. El modelo permite predecir y estudiar la prevalencia de la obesidad para cada edad. Los resultados muestran un incremento de la obesidad en los próximos años y concuerdan con las tendencias de otros países. Conclusiones. Basado en las simulaciones numéricas se puede concluir que el modelo estructurado por edades es conveniente para predecir la epidemia de la obesidad en cada grupo de edad para distintos países. Adicionalmente, este tipo de modelos puede ser aplicado para estudiar otras características en otras poblaciones tales como poblaciones de animales.
Palabras clave: Edad, humanos, obesidad, población, modelo matemático.
INTRODUCTION
Obesity is growing at an important rate in developed and developing countries and it is becoming a serious disease not only from the individual health point of view but also from the public socioeconomic one, motivated by the high cost of the Health Public Care System due to the assistance expenditure of people suffering related fatal diseases such as diabetes, heart attacks, blindness, renal failures and nonfatal related diseases such as respiratory difficulties, arthritis, infertility and psychological disorders (1,2). Research suggests that the best way to tackle the obesity epidemic may be via environmental change. Although genetics may predispose some individuals to obesity, the epidemic proportions of obesity indicate that environment plays a significant role (3). Several policies have been proposed and investigated to stop obesity epidemic with different point of views. Moreover, it is considered in several works that the obesity problem lies in the social and cultural forces (3-7). Jodar et al (6) propose a model where obesity is developed through unhealthy eating habits and these habits are communicable by means of peer social group pressure.
Models that allow simulating policies are necessary to evaluate their effectiveness and predict future scenarios. Some authors affirm that the key issue in the world of political decisions is the distribution of costs and benefits (8). Modelling require programs as the one proposed by Levine et al (9) in order to provide information of the current trend regarding overweight, obesity and lifestyles patterns.
Systems of ordinary differential equations (ODE) are well known tools that have been used to model different type of diseases. In these models commonly the variables represent subpopulations of susceptible, infected, recovered, transmitted diseases vectors, and so forth. Thus, the ODE system describes the dynamics of the different classes of subpopulations in the model (10,11). Some authors have proposed models to study obesity dynamics in the population considering the whole population (6,12). These models have advantages and disadvantages; one important disadvantage is that detailed information regarding body mass index (BMI) and lifestyle is needed for the whole population. On the other hand these models deal with normal weight, overweight, obese and on diet populations. In this paper we only deal with overweight and obese population, but using an age structure model. This model has the advantage of giving the obesity prevalence for each age group, which can be useful to evaluate health policies. However, dealing with age structure models is more complex and more parameters need to be estimated. Age structured models have been constructed in other works in order to study several diseases and issues. For instance, an interesting age structured mathematical model to study diabetes complications has been developed (13). In addition, Noymer (14) introduced an age structured model to investigate transmission of ‘urban legends’. Others interesting works with age dependent ODE systems have been presented in (14-18).
In several works it has been shown that obesity prevalence increases with age (19,20). Additionally, in a previous age structure mathematical model where two age groups have been considered it has been shown that obesity need to be tackle at early years (21). The model presented in (21) does not consider age dependence continually, which may be inconvenient in some cases to model dynamics of animals for instance. In this paper a mathematical model is proposed to monitor the correlation of age with overweight and obesity development. In order to estimate the parameter values of the model it is necessary to have sectional data for different years regarding overweight and obesity of the target population. In this way each region has own parameter values, but the same underlying age structured model. In addition, it is clear that the overweight and obesity prevalence is influenced by health policies, economics, culture, and technology. Thus, the parameter values of the model must vary with time and age.
Numerical simulations are performed under different possible scenarios in order to investigate the dynamics of overweight and obese populations at different ages and times. Some numerical simulations of different scenarios in the Spanish region of Valencia are performed in order to predict some future dynamics regarding the correlation of age and time with the obesity development. However, in order to perform numerical simulations it is necessary to estimate previously the parameters assumed to be age dependent and varying with time. This task is not straightforward and requires different sources of real data to express the parameters as functions of time and age. As data contains inherent errors the functions need to be fitted to the data to obtain an explicit function for each parameter.
The modelling and simulation of the proposed model is a useful tool for investigating the obesity epidemic development and its control. The model permits to build and test theories and consequently can help health policy makers to reduce obesity prevalence and improve the people's quality of life.
The modelling approach applied here can be used to other diseases and populations where age is relevant. For instance, age structure models can be useful to include egg, larva, pupa and adult stages and some physical characteristics that are of interest. For instance, we can be interested in studying the dynamics of weight, size, immunity or other characteristics.
In mathematical models for the processes which govern the age structure of Fasciola hepatica populations in sheep were investigated (22). Prey-dependent consumption predator&prey (natural enemy-pest) model with age structure for the predators and infectious disease in the prey is considered by Wei and Chem (23). Several models of malaria-mosquito-human interactions using the Lumped Age-Class technique of Gurney and Nisbet were developed by Hancock and Godfray (24). These models explicitly include sub-adult mosquito dynamics and assume that population regulation occurs at the larval stage. Additionally, a study of age-associated diseases such as ovariectomy and denervation has been presented by Halade et al (25). Authors observe that corn oil fed mice increases body weight, total body fat mass, abdominal fat mass and reduced bone mineral density. Also they notice that bone mineral density decreased with age and was accompanied by increased bone marrow adiposity.
The objective of the present work was to model and study the correlation of age and time with the obesity development in human population.
MATERIALS AND METHODS
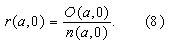
Age structured model. At first the age structured model including obesity prevalence in the excess weight in human population is constructed. Suppose that S(a,t) and O(a,t) represent the numbers of overweight and obese of age a at time t respectively, and let n(a,t)=S(a,t)+O(a,t) denote the size of the population of overweight and obese of age a at time t. A schematic representation of the age structured mathematical model is shown in figure 1. The diagram shows that at age a and time t, I(a,t) people coming from normal weight transit or enter the overweight class. The number of overweight individuals also increased by φ(a,t) O(a,t) (obese individuals that become overweight), decreased by γ (a,t) S(a,t) (overweight individuals that become obese) and from natural mortality µ(a,t) S(a,t). On the other hand, the number of obese individuals increased by φS(a,t) (overweight individuals that become obese) and decreased by φ(a,t) O(a,t) (obese individuals that become overweight) and from natural mortality µ(a,t) O(a,t). In addition, I(a,t)= σ(a,t) n(a,t) where σ(a,t) is the rate of incidence of overweight individuals and r(a,t)= O(a,t)/n(a,t) is the prevalence of obesity in the excess weight population at age a and time t.
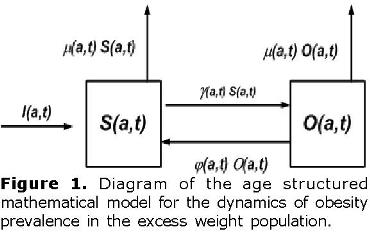
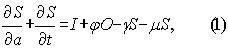
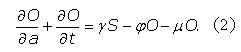
Assuming that the number of males is equal to the number of females and, that overweight and obesity affects the individuals of the two sexes equally, the continuous age structured partial differential equation model is constructed from the following partial differential equations where for the sake of clarity we obviate the explicit dependence on age and time,
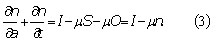
Adding Eqs. (1) and (2) we obtain a similar equation for n(a,t)
Recalling the expression for r(a,t),
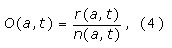
and differentiating with respect to a and t one gets,
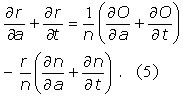
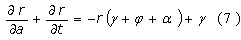
Then using Eqs. (4) and (5) yields,
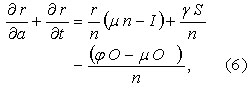
Finally replacing I(a,t) by its expression and combining Eq. (7) with the substitution of n(a,t) one gets the simplified equation,
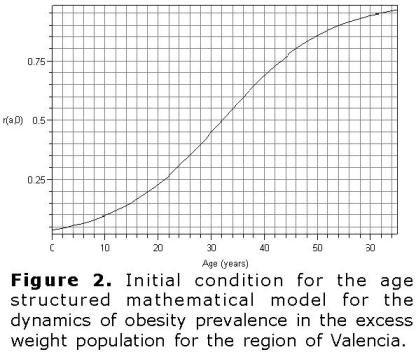
Initial and boundary conditions are necessary for solving the partial differential equation (7). The initial condition is given by,
It is assumed that newborns are neither overweight nor obese and it is considered that development of overweight and obesity occurs later on. Consequently, boundary condition r(0,t) for all t is assumed null in the numerical computations.
Estimating parameter values of the age structure model. This subsection is devoted to estimate the parameter values of the proposed partial differential equation model using real data from the Spanish region of Valencia. This data is selected in order to follow our research line and since some previous works in regard to overweight and obesity have been performed (6).
First of all, it is important to mention that in the age structured model parameters σ, γ and φ need to be estimated. However, real data regarding overweight and obese populations are not fully detailed. Therefore, these parameters are difficult to estimate accurately. Some procedure used to estimate the parameters is implemented through least-squares fitting.
The age structured mathematical model handles a set of parameters assumed to be time and age dependent. For different stages of time and age, the implementation needs explicit values of the parameters. To this end, different sources from Spain are combined and used to express the parameters as functions of time or age. The fitting procedure is not straightforward, since health reports regarding overweight and obesity do not include explicitly the parameter values of σ, γ and φ for different years or ages. Therefore, some linear estimation using real data reports are performed to obtain these parameters in function of age and time.
In order to simulate future dynamics it is necessary to consider different functions that models change on lifestyles. For instance, it may be assumed that some health policies to tackle overweight and obesity should decrease the prevalence of obesity over the time.
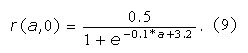
Computing the particular parameter values of the age structure model. Based on health reports from 1992 to 2006 we obtain that the prevalence of obesity in the excess weight population increases with age and time. Since all the data are not fully detailed and based on that the percentage of obese individuals who return to the overweight class is low, we assume a null value for the parameter φ. Based on the current age profile of the data regarding overweight and obesity prevalence in the excess weight population we use different functions to fit this data. At first, we divide the excess weight population in age groups each one of five years amplitude. Then, we use the obesity prevalence in each age group to obtain several points that are fitted by the r(a,0) function. The best fitting result is given by the logistic function shown in figure 2. Thus, the obtained initial condition is given by the following equation:
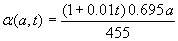
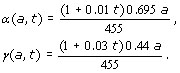
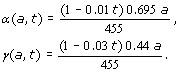
After the estimation of the initial condition we proceed to compute γ(a,t) and σ(a,t). The value of the obesity incidence γ(a,t) is estimated using Eq. (2) for the population mean age (32.5 yrs.) and with data of obesity population between years 1992 and 2006. Then, the estimated value of γ(a,t) is extrapolated linearly to any age a and taking into account the period of 14 years between 1992 and 2006 to extrapolate to the future. In this way, one gets
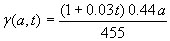
which increases with age and time. The value of the excess weight incidence σ(a,t) is estimated using Eq. (1) for the population mean age (32.5 yrs.) and with data of excess weight population between years 1992 and 2006. As in the previous parameter γ(a,t) the estimated value of σ(a,t) is extrapolated linearly to any age a and taking into account the period of 14 years between 1992 and 2006 to extrapolate to the future. Thus, one gets,
which also increases with age and time as the real data indicates.
RESULTADOS
The age structure model is simulated in order to observe the evolution of overweight and obese populations from the Spanish region of Valencia for different ages. The mathematical model is solved over a space of T years time and A years of age. Numerical simulation is performed with mathematical software package Maple in order to predict different future scenarios in regard to overweight and obesity populations for different ages in the excess weight population.
The program was run several times with different values of the parameters. It is important to remark that, as was mentioned, different functions were fitted to represent initial conditions and some of them were also used in the numerical simulations, but they showed no significant changes in the final results. These results suggest global stability of the model, i.e., steady state depends only the parameters σ, γ and φ and not in the initial condition profile. In addition, based on the definition of the r(a,t), the steady state of obesity prevalence in excess weight population should be upper bounded by 1. Furthermore, we consider age varying from 0 to 65 years, since data reports over 65 years show that obesity does not increase with age.
As have been mentioned in the introduction, numerical simulations are performed under three different possible scenarios.
However, in order to investigate the dynamics it is necessary to estimate previously the parameters assumed to be age dependent and varying with time. This task is not easy due to the age and time dependence. Additionally, in social systems the quantitative effect of health policies is very unpredictable. However, in ecological systems some quantitative effects are more tractable. Thus, the current trend scenario is more reliable than the other hypothetical scenarios. Although it is convenient the simulation of other scenarios in order to obtain quantitative and qualitative overviews of the population dynamics that needs to be taken cautiously. It is important to remark that these scenarios require different sources of real data to express the parameters as functions of time and age, and they are usually not available. It is important to remark that these scenarios requires different sources of real data to express the parameters as functions of time and age and they are not easy available at all.
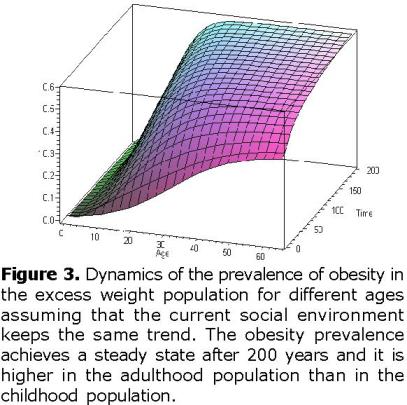
Current trend. A numerical simulation is performed in order to illustrate future dynamics for overweight and obese subpopulations of different ages in the region of Valencia, Spain, when it is assumed that the current social environment keeps the same trend. In this particular scenario,
In figure 3 it can be observed that the obesity prevalence achieves a steady state after 200 years with a value r(65,200) ≈ 0.6. This means that approximately 60% of the excess weight population will be obese. In addition, at the steady state, it can be observed that obesity prevalence is higher in the adult population than in the children population as occurs actually in the real world.
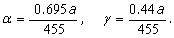
Time invariant parameters. In this scenario it is assumed that the parameters keep invariant on time, this can be translated into the fact that the social environment is not changing anymore. In this particular scenario,
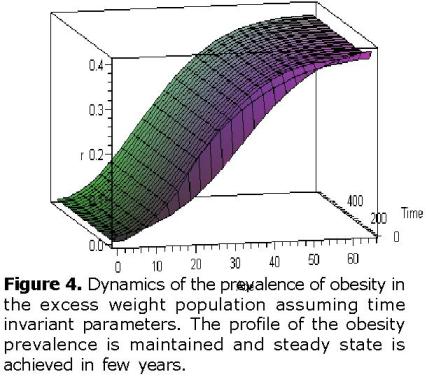
In figure 4 it can be seen that the dynamics of the obesity prevalence achieves a steady state in few years. This result is expected since the parameters are not varying in time and initial conditions are consistent with the current real data. It is important to notice that the age profile of the obesity prevalence is maintained, i.e., obesity prevalence is higher in the adult population than in the children population.
Health prevention policies. In this scenario it is assumed that health prevention policies are implemented to reduce the overweight and obesity prevalence, and these policies are effective reducing in this way the parameters over the time. Notice that reducing the parameters σ and γ means a prevention strategy and reducing the value of φ means a treatment strategy (diet and physical activity). Here we assume that the prevention policies reduce in the same proportion both parameters σ and γ
In figure 5 it can be seen that the obesity prevalence is reduced in all ages, but most remarkably in the childhood population.
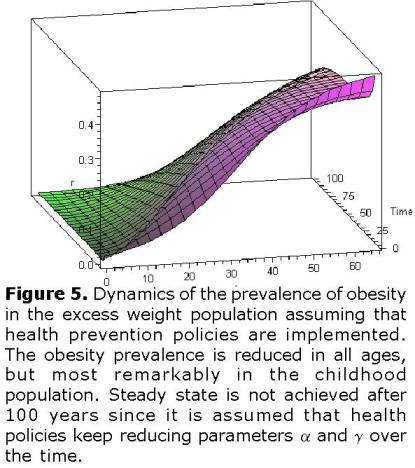
Steady state is not achieved after 100 years since the parameter values keep reducing over the time. However, this scenario includes parameter values unknown for us and the decrease of prevalence may be faster or slower depending on the effectiveness of the prevention health policies. In this way, the model predicts the expected result after the implementation of these health policies.
DISCUSSION
In the context of epidemic diseases, several mathematical models have been used to study different demographic and epidemiological mechanisms that characterize disease dynamics. In this paper an age structured mathematical model based on a partial differential equation system was proposed in order to describe the prevalence of obesity dynamics for different ages in the excess weight population. Using different parameter values corresponding to each region the proposed model can be applied to any population. Here, we show the methodology using data of the Spanish region of Valencia to predict some future dynamics regarding the correlation of age and time with the obesity development and evaluate health policies.
The model introduces a partial differential equation system in order to consider the correlation of age and time with obesity development in the excess weight population. In this model we consider only overweight and obese populations in order to study the most relevant classes on obesity health concern. It is important to remark that obesity is better indicator of related health problems than the overweight prevalence (26). Therefore, it is important to monitor or predict this issue.
Based on the numerical simulations it is possible to conclude that the partial differential equation model is suitable to model obesity population growth in the excess weight population. In addition, the results show an increasing trend of obesity in the following years in well accordance with the trend observed in several countries.
The modeling and simulation of the proposed model is a useful tool for investigating the obesity epidemic development and its control. The model permits to build and test theories and consequently can help health policy makers to reduce obesity prevalence and improve the people’s quality of life. In addition, this modeling approach can be used to other diseases where there are different stages. For instance fat mass or bone mineral densities are physical characteristics that can be studied using the age structured approach implemented here.
We would like to cite a paragraph (2): "As the epidemic of childhood obesity emerges throughout the globe, we can confidently predict that the health impact of excess weight gain will be amplified in the years to come".
Finally, we conclude that worldwide obesity epidemic should be faced up and different strategies can be simulated using the proposed mathematical model.
REFERENCIAS
1. Haslam D, James P. Obesity. The Lancet 2005; 366:1197-209. [ Links ]
2. James PT, Leach R, Kalamara E, Shayeghi M. The worldwide obesity epidemic. Obesity 2001; 9: 228-33. [ Links ]
3. Ebbeling CB, Pawlak DB, Ludwig DS. Childhood obesity: public-health crisis, common sense cure. The Lancet 2002; 360: 473-82. [ Links ]
4. Christakis NA, Fowler J H. The Spread of Obesity in a Large Social Network over 32 Years. N Engl J Med 2007; 357: 370-79. [ Links ]
5. MacPhee M. Global childhood obesity: How to curb an epidemic. J Pediatr Nurs 2008; 23: 1-4. [ Links ]
6. Jódar L, Santonja F, González-Parra G. Modeling dynamics of infant obesity in the region of Valencia, Spain. Comp Math Appl 2008; 56: 679-89. [ Links ]
7. Santonja FJ, Villanueva RJ, Jódar L, González-Parra G. Mathematical modelling of social obesity epidemic in the region of Valencia, Spain. Mathematical and Computer Modelling of Dynamical Systems 2010; 16: 23-34. [ Links ]
8. Sturm R. Stemming the global obesity epidemic: What can we learn from data about social and economic trends? Public Health 2008; 122:739-46. [ Links ]
9. Levine RS, Feltbower RG, Connor AM, Robinson M, Rudolf MCJ. Monitoring trends in childhood obesity: A simple school-based model. Public Health 2008; 122:255-60. [ Links ]
10. Brauer F, Castillo-Chavez C. Mathematical Models in Population Biology and Epidemiology. Berlin: Springer-Verlag; 2001. [ Links ]
11. Murray JD. Mathematical Biology: I. An Introduction. Berlin: Springer; 2002. [ Links ]
12. A.M. Evangelista, A.R. Ortiz, K.R. Rios-Soto, A. Urdapilleta, USA the fast food nation: Obesity as an epidemic [on line]. T-7, MS B284, Theoretical Division, Los Alamos National Laboratory, Los Alamos, NM 87545; 2004. [accessed December 2007]. URL Available from: http://math.lanl.gov/SummerPrograms/Reports2004/ev_or_ri_ur.pdf. [ Links ]
13. Boutayeb A, Twizell EH. An age structured model for complications of diabetes mellitus in morocco. Simulat Pract Theory 2004; 12:77-87. [ Links ]
14. Noymer A. The transmission and persistence of 'urban legends': Sociological application of age-structured epidemic models. J Math Sociol 2001; 25: 299-323. [ Links ]
15. Boutayeb A, Derouich M. Age structured models for diabetes in east morocco. Math Comput Simul 2002; 58: 215-29. [ Links ]
16. Norman RA, Chan MS, Srivida A, Pani SP, Ramaiah KD, Vanamail P, Michael E, Das PK, Bundy DAP. Epifil: The development of an age-structured model for describing the transmission dynamics and control of lymphatic filariasis. Epidemiol Infect 2000; 124:529-41. [ Links ]
17. Hethcote HW, The Mathematics of Infectious Diseases. SIAM REVIEW 2000; 42: 599-653. [ Links ]
18. Dmitriev V, Kurkina E. Mathematical modeling of demographic processes. Comput Math Model 2009; 20: 51-64. [ Links ]
19. Chen Y, Rennie DC, Dosman JA. Changing prevalence of obesity in a rural community between 1977 and 2003: a multiple cross-sectional study. Public Health 2009; 123:15-19. [ Links ]
20. Hedley AA, Ogden CL, Johnson CL, Carroll MD, Curtin LR, Flegal KM. Prevalence of over-weight and obesity among us children, adolescents, and adults, 1999-2002. JAMA 2004; 291:2847-2850. [ Links ]
21. González-Parra G, Jódar L, Santonja F, Villanueva RJ. An Age-Structured Model for Childhood Obesity. Mathe Popul Stud 2010; 17:1-11. [ Links ]
22. Smith G. An analysis of variations in the age structure of Fasciola hepatica populations in sheep. Parasitology 1982; 84:49-61. [ Links ]
23. Wei C, Chen L. Eco-epidemiology model with age structure and prey-dependent consumption for pest management. Appl Math Model 2009; 33:4354-4363. [ Links ]
24. Hancock P, Godfray HC, Application of the lumped age-class technique to studying the dynamics of malaria-mosquito-human interactions. Malaria J 2007; 6:98. [ Links ]
25. Halade GV, Rahman M, Williams PJ, Fernandes G, High fat diet-induced animal model of age-associated obesity and osteoporosis. J Nutr Biochem 2010. [ Links ]
26. Goodman J, Blake J. Nutrition education: A computer-based education program. J Health Care Poor Underserved 2005; 16:118-27. [ Links ]

