


 English (pdf)
 Article in xml format
 Article references
 Send this article by e-mail
 Cited by SciELO
  Cited by Google
  Similars in
SciELO
Similars in
SciELO  Similars in Google
 Permalink
INTRODUCTION
Amongst all the breeds of cattle, Lidia bulls are the only ones bred, raised and used with a productive purpose different from meat or milk: behavior.
Over the last decades, traditional extensive production systems of Lidia cattle have gradually been replaced by semi-intensive systems. Thus, the traditional extensive feeding system is followed by a fattening finishing period that usually begins in the summer-autumn of the year before the bullfight. During this finishing period the animals are kept in small fenced areas, where they are fed highly energetic and digestible rations 1,2. This excess of concentrates can cause ruminal acidosis, which has been related to falls during the bullfight, thus severely reducing animal performance 1,3.
Bartolomé 1 reported that 59% of fighting bulls had rumen pH values compatible with acidosis, 27% had liver damage, and 71% showed rumen paraqueratosis. This author linked liver damage to the animals falling during the bullfight and said that the number of falls was proportional to the severity of liver damage. He also considered that paraqueratosis and low rumen pH values could negatively influence the animal's behavior while in the bullring.
Rumen temperature is a key factor in conditioning microbial growth, especially when rumen temperature sharply decreases, usually associated to cold water or forage intake 4. The range of physiological rumen temperature (38-42ºC) varies depending on the authors 5,6.
It is, therefore, necessary to deepen the study of this disease and the influence of current feeding systems on bullfight performance with the goal of achieving the required animal volume and fine appearance without compromising rumen function. Thus, the aim of the present work was to study rumen characteristics of finishing bulls fed a total mixed ration.
MATERIALS AND METHODS
Animals and diets. Five 4-year-old Lidia bulls were used. Animals were handled according to the usual management in their farm, (Tejeda y Segoyuela (Salamanca, Spain; 40° 37′ 56″ N 6° 01′ 21″ O; 927 m above sea level, Köppen-Geiger's climate classification: Csb), and were fed on a total mixed ration (TMR) whose ingredients and chemical composition are shown in Table 1. On average, animals received 10 kg per day of the TMR, which was supplied early in the morning once a day by means of a feed mixer wagon.
Table 1 Ingredients and chemical composition of the total mixed ration (TMR).
| Ingredients (g/kg as fed) | ||
|---|---|---|
| Barley straw | 333.3 | |
| Corn grain | 213.0 | |
| Barley grain | 167.2 | |
| Rapeseed meal | 61.9 | |
| Beet pulp | 61.9 | |
| Cane molasses | 47.6 | |
| Maize DDGS | 43.3 | |
| Soybean meal | 31.2 | |
| By-pass fat1 | 12.1 | |
| Calcium carbonate | 8.7 | |
| Soybean oil | 6.2 | |
| Buffer2 | 6.2 | |
| Vitamin-mineral premix3 | 3.1 | |
| Calcium phosphate | 2.2 | |
| Salt | 2.1 | |
| Chemical composition (g/kg dry matter) | ||
| Moisture | 96 | |
| Crude protein | 108 | |
| Crude fibre | 147 | |
| Starch | 231 | |
| Crude fat | 41 | |
| Ashes | 65 | |
Animal handling and management was conducted according to Directive 2010/63/EU for the protection of animals used for scientific purposes 7 and, albeit the experimental conditions did not entail animal suffering, the approval certification from the Instituto Tecnológico Agrario de Castilla y León Ethical Committee for Animal Research was gathered. Animals were able to freely and normally move, graze and behave in a fenced space of 17 hectares.
Monitoring of rumen pH and temperature. Internal wireless smaXtec(r) boluses (smaXtec animal care sales GMBH, Graz, Austria) were used for collecting rumen pH and temperature data every 10 min. Each bolus ended up in the reticulum (where it remained until the animal was slaughtered) after being calibrated (pH 4 and 7) and introduced using an oral balling gun, following the manufacturer instructions. Data were recorded for a period of 37 (±8.2) days.
Analytical procedures. Procedures described by AOAC 8 were used to determine dry matter (DM, AOAC official method 934.01), ash (AOAC official method 942.05), and Kjeldahl N (AOAC official method 976.06). Neutral-detergent fibre (NDF, expressed including the residual ash) was determined by the method of Van Soest et al 9, adding sodium sulphite to the solution.
The chemical composition and concentrate and mixed ration was analyzed by Master Lab España Analytical Services (Tres Cantos, Madrid, Spain).
Statistical analysis. Data on rumen pH and temperature were first averaged for each day: maximum, minimum and mean, area under the curve, and time spent below pH thresholds of 7.0, 6.6, 6.2, 5.8, 5.4 and 5.0. The area under the curve was calculated by multiplying the absolute value of the deviation in pH by the time (min) the pH was below the threshold, and expressed as pH units×min. The value of the average pH for each hour within each day was also calculated for each animal.
Temperature data were summarized as maximum, minimum, and mean and time above 39.0, 39.2, 39.4, 39.6 and 39.8°C. The area under the curve was calculated as indicated for pH. Temperature data for times of water intake of each animal were identified: the temperature shows a deep decrease followed by a slow increase to near temperature pre-water intake 10. The start of a drinking event was identified when rumen temperature suffered a decline greater than 0.28°C since the previous measurement. A drinking event ended when temperature was above 38.4°C or when temperature stopped increasing during a period of 10 min 10. The correlation analysis between rumen pH and temperature was performed using SPSS 16.0 for Windows (IBM Corp., New York, USA).
RESULTS
Descriptive statistics of rumen pH values are given in Table 2. Average rumen pH was around 6.20, which can be considered as physiologically normal.
Table 2 Mean values of daily rumen pH in finishing Lidia bulls.
| Average | Std. dev | Mode | Min. | Q25 | Median | Q75 | Max. | |
|---|---|---|---|---|---|---|---|---|
| Mean pH | 6.22 | 0.28 | -- | 5.50 | 6.02 | 6.22 | 6.42 | 6.87 |
| Minimum pH | 5.53 | 0.38 | 5.47 | 4.67 | 5.25 | 5.49 | 5.80 | 6.58 |
| Temperature at minimum pH | 38.46 | w1.97 | 39.56 | 27.72 | 38.25 | 39.03 | 39.71 | 40.77 |
| Hour at minimum pH | 16:07 | 7:31 | 22:25 | 0:00 | 14:07 | 18:43 | 21:29 | 23:57 |
| Maximum pH | 6.80 | 0.21 | 6.97 | 6.11 | 6.64 | 6.82 | 6.97 | 7.30 |
| Temperature at maximum pH | 38.87 | 0.58 | 38.73 | 33.34 | 38.64 | 38.83 | 39.06 | 40.51 |
| Hour at maximum pH | 9:05 | 2:53 | 9:11 | 0:39 | 7:48 | 8:52 | 9:53 | 22:26 |
| Time (min/day) at pH < | ||||||||
| 7.0 | 1413 | 129 | 1440 | 150 | 1440 | 1440 | 1440 | 1440 |
| 6.6 | 1090 | 333 | 1440 | 20 | 870 | 1145 | 1400 | 1440 |
| 6.2 | 615 | 382 | 0 | 0 | 310 | 670 | 890 | 1440 |
| 5.8 | 280 | 287 | 0 | 0 | 0 | 210 | 470 | 1110 |
| 5.4 | 77 | 153 | 0 | 0 | 0 | 0 | 80 | 680 |
| 5.0 | 7 | 31 | 0 | 0 | 0 | 0 | 0 | 280 |
| Time (min/day) ´ pH < | ||||||||
| 7.0 | 1115 | 418 | 1489 | 93 | 823 | 1107 | 1403 | 2164 |
| 6.6 | 599 | 362 | -- | 0 | 316 | 578 | 861 | 1588 |
| 6.2 | 258 | 237 | 0 | 0 | 45 | 202 | 402 | 1012 |
| 5.8 | 82 | 117 | 0 | 0 | 0 | 34 | 109 | 566 |
| 5.4 | 15 | 35 | 0 | 0 | 0 | 0 | 6 | 222 |
| 5.0 | 1 | 4 | 0 | 0 | 0 | 0 | 0 | 42 |
Std. Dev. = standard deviation; Q25 = lower quartile; Q75= upper quartile
Maximum and minimum values of hours at maximum and minimum pH seemed to indicate that these pH values were reached sometimes at specific moments during the night. Nevertheless, quartiles, mode and mean values indicate that minimum pH was often reached in the afternoon (between 15:00 and 17:00), that is to say, 5 to 8 hours after feed supply. Likewise, maximum pH value was reached early in the morning (between 8:00 and 10:00). The area under the curve (Time (min/day) x pH) for pH below 5.4 was, on average, 14 min, with a maximum of 30 min for some animals.
Table 3 shows average temperature values of the 5 animals monitored in the experiment. Neither average nor maximum values observed in this experiment were high enough to be related to the development of pathologies or infections that could affect the animals' health. The relative low values of minimum ruminal tempetature (around 32°C) observed could be linked to the moments when the animals drank water.
Table 3 Average daily values of rumen temperature (T, ºC) in finishing Lidia bulls.
| Average | Std. dev. | Mode | Min. | Q25 | Median | Q75 | Max. | |
|---|---|---|---|---|---|---|---|---|
| Mean T | 38.89 | 0.40 | -- | 37.81 | 38.57 | 38.87 | 39.19 | 39.88 |
| Maximum T | 40.07 | 0.48 | 39.66 | 39.14 | 39.69 | 40.08 | 40.35 | 42.46 |
| pH at maximum T | 5.97 | 0.46 | 5.57 | 4.88 | 5.59 | 6.01 | 6.33 | 6.97 |
| Hour at maximum T | 15:56 | 6:35 | 18:30 | 0:03 | 15:10 | 18:28 | 20:02 | 23:57 |
| Minimum T | 32.15 | 2.02 | 33.12 | 27.53 | 30.80 | 32.18 | 33.10 | 39.50 |
| pH at minimum T | 6.07 | 0.33 | 6.14 | 5.02 | 5.90 | 6.08 | 6.26 | 6.92 |
| Hour at minimum T | 14:03 | 4:29 | 12:34 | 1:05 | 12:00 | 13:28 | 16:18 | 23:52 |
| Time (min/day) at T > | ||||||||
| 39.0 | 730 | 391 | 200 | 50 | 380 | 730 | 1110 | 1370 |
| 39.2 | 563 | 400 | 290 | 0 | 200 | 485 | 920 | 1320 |
| 39.4 | 402 | 364 | 0 | 0 | 80 | 255 | 700 | 1300 |
| 39.6 | 286 | 311 | 0 | 0 | 20 | 150 | 500 | 1230 |
| 39.8 | 183 | 240 | 0 | 0 | 0 | 65 | 300 | 1170 |
| Time (min/day) at T < 38.4 | 180 | 85 | 160 | 0 | 130 | 160 | 220 | 540 |
| Time (min/day) ´ T > | ||||||||
| 39.0 | 399 | 343 | 105 | 6 | 101 | 294 | 654 | 1460 |
| 39.2 | 269 | 272 | 0 | 0 | 41 | 163 | 462 | 1248 |
| 39.4 | 171 | 203 | 0 | 0 | 15 | 71 | 287 | 1040 |
| 39.6 | 102 | 141 | 0 | 0 | 1 | 31 | 170 | 835 |
| 39.8 | 56 | 91 | 0 | 0 | 0 | 12 | 77 | 634 |
| Time (min/day) ´ T < 38.4 | 339 | 175 | 0 | 0 | 231 | 326 | 424 | 1390 |
| Average number of water intakes per day | 2.45 | 1.15 | 2.00 | 0.00 | 2.00 | 2.00 | 3.00 | 8.00 |
Std. Dev. = standard deviation; Q25 = lower quartile; Q75= upper quartile
DISCUSSION
The pH values observed in this experiment were close to those reported by Bodas et al 11) and above those indicated by other authors 1,11,12 for animals of similar characteristics.
Maximum value of pH is reached just before feed supply, which agrees with the findings reported by Calsamiglia et al 13 and González et al 14. Feed intake takes place around maximum pH values, whilst minimum pH values were the result of the maximum fermentative activity within the rumen after a considerable amount of feed intake. According to Crater et al 15, pH value gradually drops immediately after feed supply and returns to previous values in 24 h, as it can be seen in Figure 1 and Figure 2.
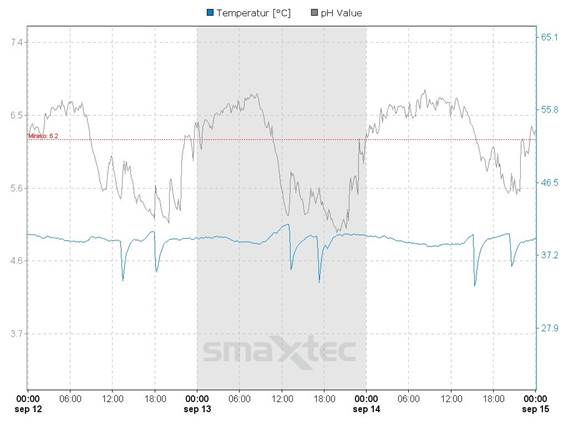
Figure 1. Actual measurements of rumen pH and temperature for three consecutive days in one Lidia bull fed on a total mixed ration.
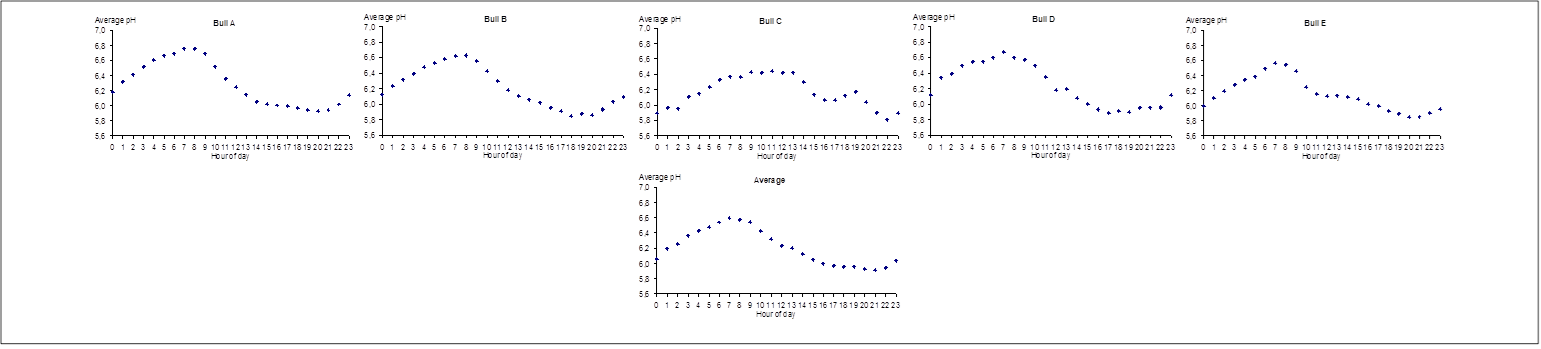
Figure 2 Evolution of rumen pH throughout the day (average of all the days) for each bull and average of the 5 bulls.
The average pH value observed in this experiment was 6.22, slightly higher than the 6.08 reported by Bartolomé 1, which can be considered as indicative of chronic acidosis 14. It is well known that when pH drops beyond this value, fibre digestibility decreases 6. Bartolomé 1 also found evident symptoms of acute ruminal acidosis in all Lidia bulls studied at the end of their productive cycle. This discrepancy between our results and those of former studies could be essentially due to two factors. The first one is related to the way the samples were taken: whereas in our study rumen conditions were continuously monitored, in Bartolomé's 1 study rumen pH was only measured once the animal had been slaughtered, that is to say, after the animal had suffered acute stress and dehydration. On the other hand, feeding management instead of feed composition 13 is the decisive factor determining rumen pH and the consequent risk of rumen acidosis. Thus, albeit feed was distributed to ensure a minimum TMR intake of 10 kg per animal, the management system in a fenced area of 17 hectares allowed the animals to graze freely.
Notwithstanding, while the animals graze on a large area, they are likely to spend most of their time away from the spots where TMR is supplied. This circumstance together with the fact that TMR was supplied to the animals in the early morning and remained available in the feeder all day long may contribute to differences in daily feed intake pattern among animals. Hence, when feeds are distributed in punctual moments, even though the space in the feeder is large enough for all the animals, competitive social conditions can lead to competition between individuals, thus reducing the number of meals per day and increasing the amount of feed ingested at each meal, therefore deregulating the mechanisms to maintain optimal rumen conditions 16,17. Each of the monitored animals showed a different daily rumen pH pattern (Figure 2), and there was no indication either through pH values or clinical signs that the animals were experiencing acidosis.
The pH value to ensure an optimum growth of ruminal microorganisms depends on the species of rumen microbiota considered; on average, this value is within the range of 5.5 and 6.9. When pH values are outside this range, the growth of lactobacilli is favored and acidosis ensues 5,18. The rumen pH values of the bulls could be considered physiological between 90 and 99% of the time depending on the animal, thus contributing to a normal ruminal function.
Daily variations in rumen pH could cause deep modifications in rumen microbiota, so that strong daily variations can be considered worse than a relatively low average rumen pH 12,13. Our results show that when the average time at pH under 5.4 are below 15 minutes, changes in ruminal microbiota are not likely to affect rumen physiology. Maintaining a relative low pH will foster the growth of clostridia and coliform bacteria that will provoke inflammation in the mucosa and the development of hyperkeratosis, thus acting as a barrier for volatile fatty acids absorption 5,6,19.
According to several authors 20-22, temperature is one of the key factors conditioning bacterial growth in the rumen. Rumen temperature is usually 1 or 2ºC above body temperature (i.e., between 38 and 42ºC) due to the number of biochemical processes occurring in the rumen and the homoeothermic regulation of the animal. This temperature can be lowered by the intake of cold water or forage.
It was estimated that there were between 2 and 3 water intakes per day, the main of which took place around 14:00 h., presumably some time after the heaviest TMR intake (that probably took place around 10:00, Figure 2). According to the findings of Wright 23, grazing animals prefer to drink water several times during the day, alternating with feed intake, although water intake frequency highly depends on the relative distance between feed and water areas. Nevertheless, water intake also depends on other factors such as physiological condition, dry matter intake and feed composition, body size, production level, physical activity and environmental factors (e.g. temperature).
In the present study water intake was not related to a drop in ruminal pH because when temperature reached a value below the physiological level (30.9-33.2°C), pH values were within the physiological range 7,14. The amount of time the animals' rumen presented high temperatures was relatively short: the higher the ruminal temperature, the lower the time spent at that values. Water temperature and water intake, together with the already mentioned factors, may increase the risk of suffering ruminal acidosis 13. Thus, when animals receive a ration that is likely to increase the risk of developing acidosis, drinking water immediately after feed intake will increase acid formation in the rumen 13.
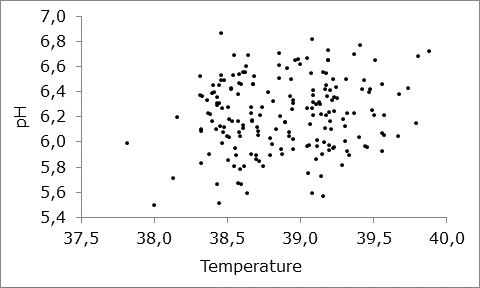
Previous studies show that there is a negative relationship between ruminal pH and temperature during an acidosis episode, therefore, monitoring ruminal temperature could help to detect such episodes 24. Conversely to this suggestion, in the present study a significant positive relationship between daily average temperature and pH was observed, although it should be interpreted with caution, given the low value of the correlation coefficient (r=0.135; p=0.03; Figure 3).
The results recorded in this work show that average the ruminal pH in finishing Lidia bulls fed on a TMR was within the range regarded as physiological. As for rumen temperature, neither average nor maximum values were too high to affect the animals. Consequentially, when feeding system is conveniently managed, supplementing finishing Lidia bulls with concentrate rations does not adversely affect the ruminal environment.

