


 English (pdf)
 Article in xml format
 Article references
 Send this article by e-mail
 Cited by SciELO
  Cited by Google
  Similars in
SciELO
Similars in
SciELO  Similars in Google
 Permalink
INTRODUCTION
The Senepol breed is a Bos Taurus that owes its name to the origins of the breeds which make it up (N’Dama from Senegal, and the Red Poll) in an unknown proportion 1,2. This population has maintained itself as a stable breed, able to adapt itself to tropical climates, such as the one in Colombia.
The characteristics associated to the Senepol breed are 3: heat tolerance, sexual precocity and fertility, maternal skill and milk production, easy calving, absence of horns, solid red color, resistance to diseases and insects, docility, hybrid vigor, longevity, meat production and quality. It is relatively short and firm, with an important muscular development in the higher section of its trunk and hind quarters, with a reduced head and strong jaw, short hair and thin skin, and it has an unparalleled meat quality.
Subjective assessment or visual selection of specimens in a herd can be replaced by bovinometry, which is the quantitative assessment of an animal’s structure in order to identify those with the best productive features, and which will be used for breeding 4. Morphological measurements, body indexes and morpho-structural characteristics have been used in cattle for many reasons, with maybe weight and group or genetic line identification being the most outstanding 5.
Knowledge and weight control of cattle is an excellent tool for the breeder, who can use it to identify flaws in handling and feeding young animals as well as planning productive and reproductive strategies to future optimize his resources 6. So, the objective of this paper was to determine the relationship of the bovinemetric measurements and their proportion to the registered Senepol animals’ living weight in Colombia.
MATERIALS AND METHODS
The study was conducted with weights and bovinemetric measurements data of animals registered at the Colombian Association of Senepol Cattle and Crossbreed Breeders - ASOSENEPOL, between 2008 and 2014. In order to analyze the database, those registers with more than two variables absent were eliminated, so only 1.402 purebred Senepol animals (542 males and 860 females) were analyzed. The animals’ ages ranged between 12 days and 13 years old. All the animals were grazing at 63 farms in the Caribbean Area, InterAndean and Orinoquía - Amazonia Valleys 7.
The bovinemetric measurements 8 collected during the technical visit from Asosenepol Colombia 9 were taken in centimeters:
Rump height (Asacr, as known in Spanish): distance from the base of the rump bone to the ground.
Thoracic Perimeter (Ptora, as known in Spanish): contour surrounding the thorax.
Body Length (Lcorp, as known in Spanish): measurement taken from the point of encounter (head of the humerus) up to the ischium (ischial tuberosity).
Hip Width (Acade, as known in Spanish): distance between the two coxal tuberosities.
Pin-Bones Width (Aisqu, as known in Spanish): distance between the two ischial tuberosities.
Rump Length (Lanca, as known in Spanish): distance between the cranial portion of the coxal tuberosity and the caudal section of the ischial tuberosity.
Testicular Circumference (Cirtes, as known in Spanish): it is the measurement of the contour of the testicles.
A descriptive analysis of the collected variables was performed using the SAS 9.2 statistic program 10. Once the analysis of variance was performed, there were unplanned comparisons of averages made using the Tukey test (P< 0.05). Groups were formed by sex, region, and age, and confidence intervals of 95% were created. The alleged weight normality was proven using the Shaphiro Wilk test. A multiple-regression analysis 11 was performed using the Stepwise procedure (SAS) in order to select those most-relevant bovinemetric measurements in the model regarding the determination coefficient (R²).
The first-order multiple-regression model is:

Yi = Dependent Variable (Weight)
β0,β1,β2…βk = Regression Coefficients
Xi1,Xi2…Xik = Regressor Variables
εi= Independent errors with distribution N (0, σ 2), i=1,2,…, n.
The proportionalities were estimated using all the bovinemetric measurements herein by sex and age group. The proportionalities were calculated as X1/X2, X1/X3…, X6/X7, following procedures established by Pareja and Pinilla 12. A multiple-regression analysis was conducted using the SAS Program 10, in order to select those most-relevant bovinemetric measurements in the model based on the regression coefficient.
RESULTS
Table 1 shows the descriptive analysis of the variables collected throughout the technical visits: grading year (ACALIF, as known in Spanish), animal’s age in months (EDCALIFM, as known in Spanish) and days (EDCALIFD), birth weight (PNAC, as known in Spanish), weight at grading (weight), body condition (CC, as known in Spanish), and bovinemetric measurements.
Table 1 Statistic Description of the variables collected throughout the ASOSENEPOL technical visits.
| Variable | Label | N | Median | Dev tip | Minimum | Maximum |
|---|---|---|---|---|---|---|
| ACALIF | ACALIF | 1402 | 2011.57 | 1.31 | 2008 | 2014 |
| EDCALIFM | EDCALIFM | 1402 | 37.22 | 29.45 | 0.39 | 166.99 |
| EDCALIFD | EDCALIFD | 1402 | 1132.19 | 895.89 | 12.00 | 5080.00 |
| PNAC | PNAC | 1401 | 32.43 | 4.64 | 20.00 | 59.00 |
| Peso | Peso | 1401 | 394.92 | 171.07 | 50.00 | 1163.00 |
| CC | CC | 1233 | 3.68 | 0.33 | 3.00 | 4.50 |
| Asacr | Asacr | 1399 | 124.14 | 13.50 | 60.00 | 168.00 |
| Ptora | Ptora | 1374 | 164.55 | 26.35 | 76.00 | 240.00 |
| Lcorp | Lcorp | 1370 | 134.95 | 30.25 | 45.00 | 210.00 |
| Acade | Acade | 1377 | 43.51 | 9.70 | 10.00 | 67.00 |
| Aisqu | Aisqu | 1377 | 20.37 | 6.55 | 10.00 | 52.00 |
| Lanca | Lanca | 1374 | 45.23 | 9.43 | 10.00 | 67.00 |
| Cescr | Cescr | 490 | 31.90 | 7.50 | 10.00 | 56.00 |
Once the ANAVA was conducted, the Tukey test (α=0.05) enabled performing all the comparisons in pairs with an uneven number of repetitions (Tables 2 and 3). Sex (p<0.0001) and geographical area (p<0.0001) influenced weight and bovinemetric measurements. There was non-normality in data (p<0.0001) when conducting the normality test by region.
Table 2 Statistic Significance Tests for the weight-variation sources (α=0.05).
| Source | Pr > F |
|---|---|
| SEX | <0.0001 |
| ERA | 0.0921 |
| REGION | <0.0001 |
| ACALIF | <0.0001 |
Table 3 Summary of the Tukey Test for weight and bovinemetric measurements.
| Variable | SEX | REGIÓN* | ERA | ACALIF |
|---|---|---|---|---|
| PCALIF | X | X | - | X |
| CC | X | X | - | - |
| Asacr | X | X | - | - |
| Ptora | X | X | - | - |
| Lcorp | X | X | X | X |
| Acade | X | X | - | - |
| Aisqu | X | X | X | X |
| Lanca | X | X | - | X |
| Cescr | X | X | X | X |
| *The region behaving differently (p<0.0001) is the Caribbean. |
To correct non-normal weight distribution, groups were formed by age, young (0 to 2 years) and adults (2 to 4 years), still presenting non-normality of data. In order to eliminate extreme data, confidence intervals of 95% (α=0.05) were created. Once the assumed weight normality was confirmed through the Shaphiro Wilk test, the most-relevant bovinemetric measurements in the model based on the determination coefficient (R2) were chosen when conducting a multiple-regression analysis.
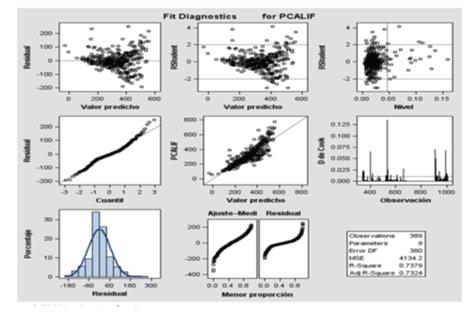
Figure 1 shows a chart of residuals against adjusted values, allowing the assessment of the regression function, variance uniformities, error terms as well as the presence of extreme values 11.
Effect of bovinemetric measurements on weight. The variation coefficient within each group (sex, region and age group) was less than 35%, which confirms that the experimental material was homogeneous, except for the young male group of the areas of Interandean and Orinoquía - Amazonía Valleys.
Table 4 shows the multiple-regression model for each group. Bovinemetric measurements for thoracic perimeter, hip width, and rump length were significant for both sexes (p<0.05). In turn, the rump height, body length and pin-bone width were equally significant in males.
Table 4 Analysis of Multiple Regression for females and males / area / age group.
| CARIBBEAN YOUNG FEMALES | ||||||
|---|---|---|---|---|---|---|
| Step | Introduced Variable | Parameter Estimator | R 2 of the Model | Pr > F | Durbin-Watson-D | Number of Observations |
| 1 | Intercept | -63.98 | 0.1133 | 1.465 | 104 | |
| 2 | Ptora | 2.31 | 0.4178 | <0.0001 | ||
| INTERANDEAN AND ORINOQUÍA-AMAZONÍA VALLEYS YOUNG FEMALES | ||||||
| 1 | Intercept | -162.35 | <0.0001 | 1.378 | 195 | |
| 2 | Ptora | 2.34 | 0.6053 | <0.0001 | ||
| 3 | Acade | 1.98 | 0.6161 | 0.0212 | ||
| CARIBBEAN ADULT FEMALES | ||||||
| 1 | Intercept | -255.33 | 0.0006 | 1.294 | 107 | |
| 2 | Ptora | 3.79 | 0.4394 | <0.0001 | ||
| INTERANDEAN AND ORINOQUÍA-AMAZONÍA VALLEYS ADULT FEMALES | ||||||
| 1 | Intercept | -368.31 | <0.0001 | 1.466 | 85 | |
| 2 | Lanca | 5.31 | 0.4482 | 0.0031 | ||
| 3 | Ptora | 2.31 | 0.5291 | 0.0005 | ||
| 4 | Acade | 2.11 | 0.5528 | 0.0415 | ||
| Leveled Selection Summary | ||||||
| CARIBBEAN YOUNG MALES | ||||||
| 1 | Intercept | -248.22 | <0.0001 | 1.659 | 164 | |
| 2 | Acade | 4.13 | 0.5623 | <0.0001 | ||
| 3 | Asacr | 1.64 | 0.6246 | <0.0001 | ||
| 4 | Ptora | 0.93 | 0.6536 | 0.0003 | ||
| 5 | Lcorp | 0.36 | 0.6708 | 0.0045 | ||
| INTERANDEAN AND ORINOQUÍA-AMAZONÍA VALLEYS YOUNG MALES | ||||||
| 1 | Intercept | -426.44 | 0.7223 | <0.0001 | 1.743 | 159 |
| 2 | Asacr | 3.14 | 0.7223 | <0.0001 | ||
| 3 | Ptora | 2.03 | 0.7556 | <0.0001 | ||
| 4 | Aisqu | 2.48 | 0.7649 | 0.0143 | ||
| CARIBBEAN ADULT MALES | ||||||
| 1 | Intercept | -1082.79 | <0.0001 | 1.743 | 159 | |
| 2 | Ptora | 2.37 | 0.2978 | <0.0001 | ||
| 3 | Asacr | 9.16 | 0.497 | <0.0001 | ||
| 4 | Aisqu | -5.47 | 0.5381 | 0.0142 | ||
| INTERANDEAN AND ORINOQUÍA-AMAZONÍA VALLEYS ADULT MALES | ||||||
| 1 | Intercept | -368.04 | 0.4426 | 0.1091 | 1.449 | 24 |
| 2 | Lanca | 17.08 | 0.4426 | 0.0004 | ||
Effect of bovinemetric proportions on weight. The proportions for females were estimated with all the bovinemetric measurements of this paper, regardless of their classification due to area or age group, but when performing a normality-on-experimental-error test, a non-normal distribution (p=0.0022) was confirmed. The same happened with males (p<0.0001). Thus, an analysis by sex and age group was performed.
The model of multiple-regression analysis for each group is shown in table 5. Weight variability for females is defined by the proportionalities that link bovinemetric measurements related to meat production with easy calving. For males, proportionalities linked to meat production with hip width, pin-bone width, rump length and testicular circumference.
Table 5 Multiple Regression Analysis for bovinemetric proportionalities of females and males / area / age group.
| YOUNG FEMALES | ||||||
|---|---|---|---|---|---|---|
| Step | Introduced Variable | Parameter Estimator | R 2 of the Model | Pr > F | Durbin-Watson-D | Number of observations |
| 1 | Intercept | 168.68 | 0.1572 | 0.968 | 338 | |
| 2 | ASACR/PTORA | 350.93 | 0.2709 | 0.0341 | ||
| 3 | ASACR/AISQU | -103.97 | 0.193 | <0.0001 | ||
| 4 | PTORA/AISQU | 49.39 | 0.2327 | 0.0052 | ||
| 5 | ACADE/AISQU | 65.92 | 0.2496 | <0.0001 | ||
| 6 | AISQU/LANCA | -85.22 | 0.261 | 0.0021 | ||
| ADULT FEMALES | ||||||
| 1 | Intrcept | -266.78 | 0.5454 | 1.435 | 222 | |
| 2 | ASACR/PTORA | 1179.41 | 0.1913 | 0.0401 | ||
| 3 | ASACR/ACADE | -569.96 | 0.3085 | 0.0007 | ||
| 4 | PTORA/ACADE | 399.31 | 0.3384 | 0.002 | ||
| 5 | LCORP/AISQU | -15.03 | 0.2769 | <0.0001 | ||
| Leveled Selection Summary | ||||||
| YOUNG MALES | ||||||
| 1 | Intercept | 694.98 | <0.0001 | 1.469 | 312 | |
| 2 | ASACR/ACADE | -44.35 | 0.4014 | <0.0001 | ||
| 3 | ASACR/CESCR | -51.06 | 0.3602 | <0.0001 | ||
| 4 | LCORP/AISQU | -5.77 | 0.42 | 0.0018 | ||
| ADULT MALES | ||||||
| 1 | Intercept | 771.89 | <0.0001 | 1.019 | 95 | |
| 2 | ASACR/ACADE | -137.91 | 0.1037 | <0.0001 | ||
| 3 | PTORA/LANCA | 22.45 | 0.1792 | 0.0045 | ||
There were very few observations of the outlier extreme value regarding data resulting from the equations used to calculate weight, using bovinemetric measurements and their proportionality in Senepol cattle in Colombia, as proven with residual vs. adjusted values charts, according to the D Cook distances.
DISCUSSION
In Colombia not all the livestock production systems conduct a productive control of their animals, so the need arises to give breeders tools for quantitative selection using their animals’ body measurements. In this particular situation, multiple independent variables had to be involved in a regression model to get an adequate description of the process being studied so as to produce very precise inferences 11.
When doing the variance analysis for the variables being analyzed, sex and region were discovered to influence weight and bovinemetric measurements; the animals’ genotype acted differently due to environmental factors 13. The Caribbean area behaved significantly different (P<0.0001) among the regions, since most adult samples are within this group, those who have reached the end of their growth phase.
The first-order multiple-regression model, with which the influence bovinemetric measurements have on the animal’s living weight was described, enabled drawing valid conclusions for the groups established in this paper (sex, area and age group). So, it is not valid to try to compare the specific results with previous studies, if they are not the same groups.
Each group involved one or more bovinemetric measurement in the weight-predicting model, being thoracic perimeter the mandatory measurement in each model, except the one for Adult Males of the Interandean - Orinoquía Amazonía Valleys (Table 6). As shown in the table, the determination coefficient (R2) measures the goodness-of-fit of the regression model; this is, it is the proportion of weight variance (dependent variable) explained by regression, in this case bovinemetric measurements. It will increase when the amount of independent variables in the model increases, even though these variables are unrelated to the dependent variable 11.
Table 6 Summary of the weight equations based on bovinemetric measurements by contemporary male and female groups.
| Contemporary Group | Asacr | Ptora | Lcorp | Acade | Aisqu | Lanca | Cirtes |
|---|---|---|---|---|---|---|---|
| Caribbean Young Females | X | ||||||
| Interandean and Orinoquía-Amazonía Valleys Young Females | X | X | |||||
| Caribbean Adult Females | X | ||||||
| Interandean and Orinoquía-Amazonía Valleys Adult Females | X | X | X | ||||
| Caribbean Young Males | X | X | X | X | |||
| Interandean and Orinoquía-Amazonía Valleys Young Males | X | X | X | ||||
| Caribbean Adult Males | X | X | X | ||||
| Interandean and Orinoquía-Amazonía Valleys Adult Males | X |
The Adult Males of the Interandean - Orinoquía Amazonía Valleys group has a determination coefficient (R2=0.4426) lower than the other male groups, and a very small amount of observations compared to the other groups.
The thoracic perimeter as the mandatory measurement in each model confirms what Mahecha et al 14 reported, who found that the prioritized order of bovinemetric measurements in females is: thoracic perimeter>body length>body height. In males the order is thoracic perimeter>body height>body length. According to Sociedad Española de Zooetnólogos 15, body index is the ratio between body length and thoracic perimeter; this affirmation can be compared once the body index is carried out on this study’s animals. Fry 16 states that the thoracic perimeter measurement has to be broad to enclose vital organs (heart, lungs); thus, animals will be more efficient, adaptable and strong.
In the weight-prediction models for females, the hip width and rump length were also included. Rump and flank width and depth are the most important maternal characteristics, since they represent femininity and reproductive efficiency 16. These are highly-hereditary features. Anatomically, this area should be wider to ease calving, since the role of the females within the herd is that of producing strong calves, resulting from non-dystocic births.
As for males, their weight can be calculated beginning at rump height as well as thoracic perimeter, which confirms what Fry 16 reported, when he made reference to the fact that rump height is highly related to weight gain. Very tall animals tend to be imbalanced, have less meat in their carcass, with poise problems due to narrow shoulders and chest. Very high males with low thoracic perimeters do not perform well at grazing and will have big reproductive problems.
The other body measurements which can also be used to calculate body weight in males are body length, hip width, pin-bone width, and rump length. The Senepol is a Bos taurus animal, whose structure is relatively low and strong, with an important muscular development in its upper section of the trunk and hind quarters; that is why these body measurements should be considered.
The hind part of the male must be wide enough to enclose the most amount of meat possible. A good rump width is an indicator of precocity and low nutritious requirements. Bulls generally have broad shoulders, deep chest and a good testicular circumference 16.
Proportionalities were estimated for this study with all the bovinemetric measurements with sex group and age group (Table 7). Weight variability in females is explained by the proportions: Rump Height/Thoracic Perimeter, Rump Height/Pin-bone Width, Thoracic Perimeter/Pin-bone Width, Hip Width/Pin-bone Width, Pin-bone Width/Rump Length, Rump Height/Hip Width, and Thoracic Perimeter/Hip Width.
Table 7 Summary of the weight equations base don bovinemetric proportionalities by female and male contemporary groups.
| Proportionality | Young Females | Adult Females | Young Males | Adult Males |
|---|---|---|---|---|
| Rump Height / Thoracic Perimeter | X | X | ||
| Rump Height / Pin-Bone Width | X | |||
| Thoracic Perimeter / Pin-Bone Width | X | |||
| Hip Width / Pin-Bone Width | X | |||
| Pin-Bone Width / Rump Length | X | |||
| Rump Height / Hip Width | X | X | X | |
| Thoracic Perimeter / Hip Width | ||||
| Rump Height / Testicular Circumference | X | |||
| Body Length / Pin-Bone Width | X | |||
| Thoracic Perimeter / Rump Length | X |
Altogether, we can see that these proportionalities relate the bovinemetric measurements associated with meat production (thoracic perimeter and rump height) with bovinemetric measurements linked to easy calving (hip width, pin-bone width, rump length), which are important features to the Senepol breed: females with easy calving that convey meat production to their offspring.
Variation in males’ weight is explained by the following proportionalities: Rump Height/Hip Width, Rump Height/Testicular Circumference, Body Length/Pin-Bone Width, and Thoracic Perimeter/Rump Length. These proportionalities relate the bovinemetric measurements associated with meat production (rump height, thoracic perimeter and body length) with bovinemetric measurements that are very important to males, such as: hip width, pin-bone width, rump length and testicular circumference. These proportionalitiess match what Pareja and Pinilla reported 12, when they discovered that the twelve morphological indexes which presented significant differences (p<0.05) in the averages of the Daily Average Gain, were: (Asacr/Ptora), (Asacr/Acade), (Asacr/Aisqu), (Asacr/Lcorp), (Ptora/Lcorp), (Ptora/Acade), (Lcorp/Acade), (Lorp/Aisqu), (Lcorp/Lanca), (Acade/Cirtes), (Aisqu/Cirtes), and Lanca/Cirtes).
In conclusion, the bovinometry enables the selection of balanced specimens and works as a tool for predicting the animals’ living weight in farms that do not have a scale for their productive control. Some of the bovinemetric measurements with which weight can be calculated, are: rump height, thoracic perimeter, body length, hip width, pin-bone width, rump length and testicular circumference (males).
Grazing Senepol females, ranging in age between 0 and 4 years old, located at the regions of the Caribbean and the Interandean and Orinoquía - Amazonía Valleys will have weight prediction equations parting from their thoracic perimeter, hip width, and rump length, which are the features that reflect meat production, femininity and reproductive efficiency.
For the proportionalities of grazing Senepol females, with ages ranging between 0 and 4 years old, regardless of the area where they are located, the weight prediction equation parted from the relations of bovinemetric measurements associated with meat production (thoracic perimeter and rump height) with those linked to easy calving (hip width, pin-bone width, and rump length).
Grazing Senepol males, with ages ranging between 0 and 4 years old, located at the Caribbean Region, will have weight-prediction equations parting from thoracic perimeter, rump height, body length, hip width, pin-bone width, and rump length.
As for males between 2 and 4 years old from the Interandean and Orinoquía - Amazonía Valleys, they will have weight-prediction equations parting from rump length. The amount of independent variables should be increased in this model, even though said variables are not related to the independent variable, and the amount of animals in this area should be increased for bovinemetric measuring and weighing, since at the time of this study there were only 25 animals measured.
The group of males ranging between 0 and 2 years of age from the Interandean and Orinoquía - Amazonía Valleys is not homogeneous, so the variance coefficient is greater than 35% (42.79%), increasing the prediction error. Despite the group not being homogeneous, its analysis continued, sine the youngest animals of the entire study were within this group (minimum of 12 days of age).
For the proportions of bovinemetric measurements in grazing Senepol males, ranging in age between 0 and 4 years old, regardless of the area in which they are located, the weight-prediction equations were obtained parting from the relations of all the bovinemetric measurements analyzed in the groups (except testicular circumference).
The first-order multiple-regression model with which the influence of bovinemetric measurements is explained, chosen by the Stepwise procedure regarding the animal’s living weight, enables drawing valid conclusions for the groups established herein: Caribbean Young Females, Interandean and Orinoquía - Amazonía Valleys Young Females, Caribbean Adult Females, Interandean and Orinoquía - Amazonía Valleys Adult Females, Caribbean Young Males, Interandean and Orinoquía - Amazonía Valleys Young Males, Caribbean Adult Males, Interandean and Orinoquía - Amazonía Valleys Adult Males.
It is advisable to form groups by micro-regions in future investigations, since Colombia has very different micro-ecosystems regarding agrophysic description, grounds, bovine production systems, etc., which results in a classification of micro-regions with similar characteristics.
The animal’s age influences weight 17 or bovinemetric measurement. Young animals have a rising growth curve, with said growth becoming faster as they get older, until it slows down when it reaches its adult weight. Body tissue also has different growth curves regarding age.
Sexual dimorphism, understood as the physiological and morphological variance between males and females of the same species, is an issue that influences weight and bovinemetric measurements, basically since the rate of bone development differs between males and females. Androgens have a great effect on bone and muscle growth, being that the reason for which males have a greater growth speed rate before puberty.
Bovinemetric measurements and weight differ among the groups as a result of the environmental factors mentioned herein, such as animal’s age and sex. It is not convenient to conduct studies to draw national conclusions; it is necessary to group animals by environmental factors (similar handling conditions, sex, region, etc.).
One way of choosing an animal within a farm could be based on proportionalities of bovinemetric measurements, with which animal weight can be predicted within an acceptable level of reliability. These proportionalities enable the selection of balanced, efficient, and strong animals. Structural flaws must not be tolerated, since they cause front poise problems, they are animals prone to stress and with high nutritional requirements for their maintenance. These animals do not perform well during grazing and they have serious reproduction problems.
With the results obtained in this paper, the Colombian Association of Senepol Cattle and its Crossbreeds Breeders can target the genetic-improvement process for registered purebred animals, since bovinemetric measurements taken from live animals increase precision in the selection analyses by identifying animals closest to the breed’s ideal, forming a research tool for the direction and intensity in biological variation of its individuals. Conducting Selection Indexes (IS, as known in Spanish) to identify the best breeders 16 by micro-regions is recommended.

