


 English (pdf)
 Article in xml format
 Article references
 Send this article by e-mail
 Cited by SciELO
  Cited by Google
  Similars in
SciELO
Similars in
SciELO  Similars in Google
 Permalink
1. INTRODUCTION
The geothermal power energy market is a strong growth sector worldwide, with a 27% increase in total installed capacity in the past five years [1]. This increase is driven by the growing popularity of heat pumps using groundwater anywhere in the world [2]. In addition, the energy that can be obtained from geothermal sources is constant, not depending on weather conditions (natural recharge comes from the rainfall), and low CO2 emissions, compared to other renewable energy generation alternatives [3], [4]. The heat extracted during the geothermal power generation process is small compared with the Earth’s heat (great portion associated with the radioactive process of elements during their radioactive decay), and the amount of energy is continuously replaced[5], although reservoir pressure is one of the most important parameters involved in geothermal exploitation [6], [7]. Nonetheless, the development of geothermal projects requires studies of the basin thermal regime and its geothermal potential, which allow predicting its potential with some degree of confidence [8], [9]. During the decade of the 70’s, methodologies were published to evaluate the heat - power energy potential in deep aquifers and volcanic systems, based mainly on the calculation of the rock and fluid volume [10], [11]. In subsequent decades, evaluations have gradually been conducted using this method, especially in areas of active volcanism and in some sedimentary basins. During the last decade, there has been an increase in publications (experiments, models, exploratory wells and field development), which prove the generation of electricity from deep Oil and Gas (O&G) reservoirs reporting geothermal gradients between 30º to 40ºC/Km, porosities above 10%, and water cuts above 90% [8], [12], [13]. In Colombia, wells’s data from wells show geothermal gradient ranges and productions similar to those tested for power generation in other parts of the world, in sedimentary basins such as Llanos, Catatumbo and Putumayo [14]-[18]
The present geothermal regime of the Llanos Basin is characterized by a generalized decrease of the heat flux to the west and north, from values between 29 and 63 mW/m2 [17], concordant with the depth of the 120ºC isotherm in the same direction, from less than 3 km below sea level (BSL) to 5 km BSL [19]. The geothermal gradient maps of this basin show an anomaly to the east with values above 40ºC/km, which is not compatible with radiogenic input from the Precambrian basement [16], [18], [20]. An additional element to temperature is water production, as production above 200,000 barrels per day (BWPD) is necessary to generate more than 1 MW/h [12]. Energy co-production can reduce O&G production costs in mature fields or stressed assets with high water cut values (>80%), as the energy generated replaces that purchased from the national power network. Considering that in Colombia the Water - Oil Ratio varies between 11.6% [21] and 12.5% [22], a production of 8'120,000 BWPD to 8'715,000 BWPD can be estimated, in which more than 50% comes from the exploitation of O&G fields in the Llanos Basin [22]. Thus, the geothermal gradients measured in the Llanos Basin and its high-water productivity, (around 4'000,000 BWPD), increase the possibility that deep reservoirs may have potential for power generation projects, during O&G co-production, or from aquifers with high temperatures up to 180ºC. This has encouraged the regional analysis of the geothermal potential in the Llanos Basin, considering methodologies for analysis of exploratory hydrocarbon corridors to select the areas with the best geothermal potential.
O&G exploration and exploitation activities in the Llanos Basin have made it possible to collect information to: a) estimate the depth of the crystalline basement; b) calculate the thickness of sedimentary sequences of Paleozoic and Mesozoic age; c) measure the extractable water volumes during O&G production, which are useful to estimate a recovery factor for the basin; d) characterize the geochemical composition of produced waters; e) measure the temperature on bottom and along the wells. Thus, the analysis of part of this large amount of information allows us to provide: a) concepts related to the variation of the thermal structure in the Llanos Basin at different depths and stratigraphic intervals (top of the Crystalline Basement, top of the Paleozoic sediments, and top of the Une Formation); b) propose Common Risk Segment Maps (CRSM) of the key elements that define a geothermal play; c) identify regional geothermal exploratory plays with lower risk according to the results of the CRSM; d) define the exploratory maturity of the play according to the information available and its uncertainty. It is expected that the results obtained in this work will guide the exploratory activity and furtherance of geothermal projects in the Llanos Basin, as well as to extend this type of studies to other sedimentary basins in Colombia.
MORPHOLOGY OF THE LLANOS BASIN
The Llanos Basin area extends over approximately 225,000 km2 (Figure 1), and is delimited to the north by the border with Venezuela, to the south by the Macarena - Vaupés mountain ranges and the metamorphic rocks that outcrop south of the Guaviare River, to the east by the outcrops of Precambrian plutonic rocks of the Guyana Shield, and to the west by the Eastern Cordillera foothills [23]. Morphologically, the Llanos Basin is characterized by a relatively flat topography, with an average elevation of 300 meters above sea level (MASL), drained by rivers that originate in the foothills of the Eastern Cordillera, such as Cravo Sur, Arauca, Casanare, Humea, Guatiquia, which flow into the Meta River and, finally, into the Orinoco River (Figure 1). Throughout the Llanos Basin it is common to find landscapes formed by fluvial overflow plains, eolian plains and high plateaus, the latter mainly to the east of the Meta River [24]. The Meta River and other minor rivers such as Arauca and Guatiquia, seem to be structurally controlled by normal fault systems that involve the basement [25], creating terrace systems that extend regionally.
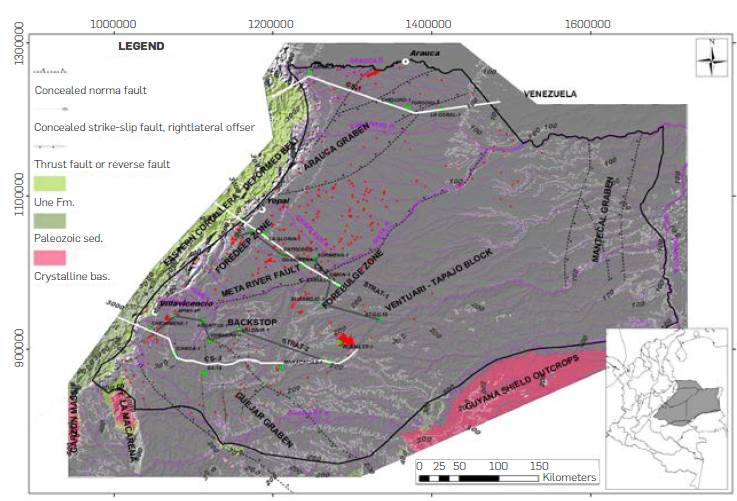
Figure 1 Study area location (right corner) and semi regional map that detail the distribution of major morpho - structures in the Llanos Basin [29], [31], [33], [108]. Thick gray lines show the location of the stratigraphic correlation sections shown in Figure 2 (STRAT-1 and 2) and thick white lines refer to the regional structural slices shown in Figure 3 (CS-1 to 3). The red dots indicate the position of the wells employed in previous works to estimate the average geothermal gradient [16]. The map includes the distribution of the outcrops of reservoirs analyzed in this work, extracted from the Geological Map of Colombia [108]. Polylines in meters above the sea level in thin white lines are obtained from the Digital Elevation Model [70], [71].
REGIONAL STRATIGRAPHY
The basement of the Llanos Basin is part of the Guyana Shield that, according to outcrops to the east and south, is composed of high-grade metamorphic and igneous rocks (Figures 1 and 2), formed during the Meso and Neo Proterozoic [26]. Oil exploration wells that have drilled the south of the Llanos Basin report granites, diorites and phyllites, confirming the continuity of outcropping rocks in the shield to the south and east beneath the basin [27], exceeding depths of 7 km along the foredeep [28]. Sedimentation in the Llanos Basin begins in the Neoproterozoic - Cambrian along regional graben systems [23], which have magnetic and gravimetric expression [23], [29], resulting from a regional cortical stretching process, related to the opening of the Iapetus ocean [30]. During the Lower Paleozoic, part of these structures was re inverted and thrusted above the Paleoproterozoic basement, associated with the development of the Grenvillian orogeny [31]. Along structures such as the Güejar - Apaporis graben to the south, and Arauca to the north (Figure 1), sedimentary sequences accumulated in siliciclastic shelf environments, while in the central part, sedimentation developed in shallow marine siliciclastic environments (Figure 2), especially muddy to the west and sandy to the east, conditions that were maintained until the end of the Devonian [32], [33]. Wells drilled in the southern Llanos Basin suggest that the Lower Paleozoic sedimentary rocks are affected by regional metamorphism, similar to that recorded in outcrops of the Quetame Metamorphic Massif in the southern Eastern Cordillera, while to the east and north, wells drilled suggest that these sediments were not affected by metamorphism [28], [31], [33]. Seismic interpretations controlled with oil exploration wells suggest that the thickness of the Paleozoic sedimentary sequences increases from east to west to more than 3 km [28].
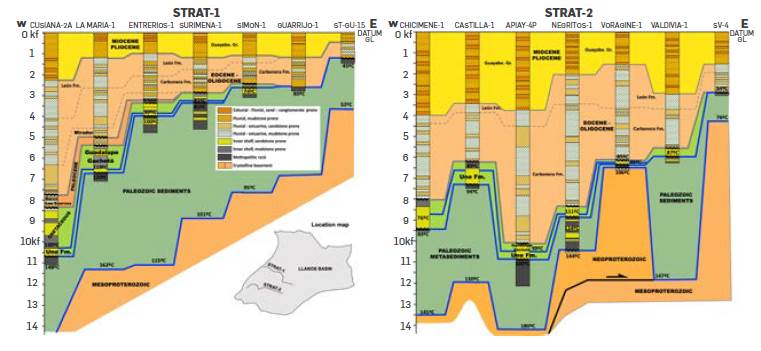
Figure 2 Stratigraphic correlation sections from wells across the Llanos Basin (see location of STRAT-1 and STRAT-2 in the map and Figure 1). The age and stratigraphic boundaries are obtained from published works [34], [42], [54], [109], [110]. Thick blue lines show the boundary at the top of the Crystalline Basement, Paleozoic sediments and Une Formation, while gray lines suggest the boundaries between lithostratigraphic units broadly extended in the basin. Values of temperatures along the wells where obtained from published data [15], [17], [58] and deepest levels from temperatures calculated in this work. Note the lateral variations of temperature at the same depth along the section STRAT-2, especially above basement highs.
The Meso-Neoproterozoic igneous-metamorphic complexes and the Paleozoic sedimentary sequences -in some sectors affected by low-grade regional metamorphism- are directly overlain by siliciclastic sediments accumulated during the Upper Cretaceous, and by some small remains of the Lower Cretaceous [34]. This regional unconformity reflects the collision that occurred during the Permo-Triassic between North and South America, a period during which the supercontinent Pangea was formed [35], [36], exposed great part of the sedimentary sequences accumulated in northern South America to erosion and locally to regional metamorphism. After this collision, the supercontinent Pangea was fragmented, developing several sedimentary basins related to the process of crustal thinning, especially concentrated in the central part of the current Eastern Cordillera (Cooper et al., 1995; Sarmiento, 2002; Vásquez, 2007). The progressive sedimentation of these basins during the Upper Cretaceous covered a large part of the Llanos Basin, especially because of global eustatic sea level changes [34], [37], [38]. The sediments accumulated during this time in the basin are mainly siliciclastic, deposited in shallow water, on the inner shelf, in markedly transgressive depositional environments, from the Albian to the Coniacian and regressive to the Maastrichtian - Lower Paleocene [32], [39], [40]. Wells drilled in the basin suggest an increase in the thickness of sediments accumulated during the Late Cretaceous to the west, reaching more than 0.5 km along the eastern foothills [34], [41] and are considered chronostratigraphic equivalents in the subsurface of the Une - Gachetá and Guadalupe units (Figure 2).
During the Paleocene - Eocene, the sediments of the Barco - Los Cuervos formations (Figure 2), accumulated diachronically over the Upper Cretaceous and Paleozoic sedimentary sequences of the Llanos Basin, along the foothills of the Eastern Cordillera, in fluvial depositional environments [32], [34], [42]. From the Eocene to early Miocene, siliciclastic sediments of the Mirador and Carbonera formations cover widely of the Llanos Basin, accumulated in fluvio-estuarine depositional environments. The accumulation of these sediments was diachronic along the Llanos Basin, as a result of the gradual uplift of the Eastern Cordillera [42]. This uplift flexed the basin basement and accumulated along the foredeep zone more than 2 km of sediments, decreasing to less than 0.5 km in the easternmost part of the basin [42]-[44]. Finally, from the early to the late Miocene, the definitive uplift of the Llanos foothills contributed with sediments that covered the Llanos Basin entirely, accumulated on fluvial depositional areas of meandering and braided rivers [45]- [49]. This sedimentation, represented in the León and Guayabo formations, reached more than 2 km thick along the foredeep zone.
STRUCTURAL GEOLOGY
The basement of the Llanos Basin is affected by regional structures, such as Arauca and Güejar - Apaporis graben’s formed during extensional processes occurred during the Neoproterozoic and filled by sediments from late Neoproterozoic to Ordovician [30], [33]. Regional processing of gravimetric and magnetic signals shows areas with low density and high magnetism along these graben structures, confirming their geometry and distribution into the Llanos Basin [29]. Towards the south of the Llanos Basin, seismic information shows thrust systems involving basement, related to collisions occurred during the Paleozoic (Figure 3), some of which have been partially reactivated during the Pleistocene [31]. The basement of the basin is affected by several normal faults, some of regional extension, configuring orthogonal grabens and horst systems, which in some areas form a rigid backstop against the southern part of the Eastern Cordillera (Figures 4 and 7). In these backstop zones, the structural map shows a very irregular morphology, affected by normal faults -some partially inverted-and thrusts (Figures 3 and 4). The progressive advance of the Eastern Cordillera deformed belt eastward has structurally stacked sedimentary sequences accumulated along the western edge of the foreland basin [44], [45], forming foothills which extension, thickness, and shortening increase laterally from southwest to northeast (Figure 3). This progressive advance of the Eastern Cordillera foothills has flexed the underlying Mesoproterozoic basement, forming the Eastern Llanos foreland basin, bounded to the east by a forebulge zone, uplifted in response to the regional flexure process [34], [42], [50]. To the southwest of the Llanos Basin, structural sections parallel to the deformed belt show that most of the reservoirs - specially the basement, Paleozoic sediments and Une Formation - outcrop in the Serranía de la Macarena, and serve as area of regional water recharge.
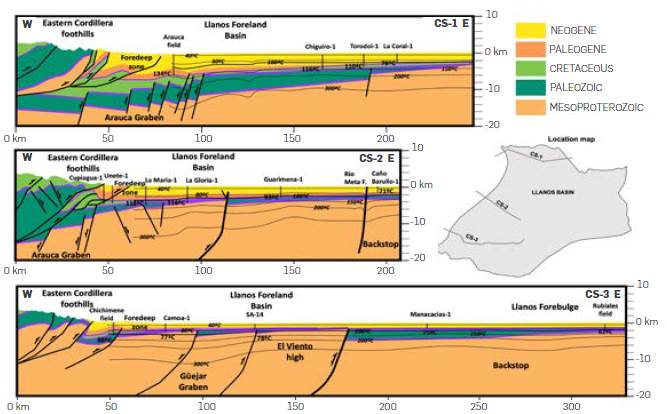
Figure 3 Structural sections across the Llanos Basin (see location of CS-1, CS-2 and CS- 3 in the map and Figure 1) constructed from published works [31], [33], [34], [81], [111]. Thick purple lines show the boundary at the top of the Crystalline Basement, Paleozoic sediments and Une Formation. Values of temperatures along the wells where obtained from published data [16], [83] and isotherms from 40ºC to 300ºC, was extracted from the average geothermal gradient of the basin. Note the gradual rapprochement of isotherms from north to south (especially along the foredeep zone, while the imbrication of thrust and Neogene sediment thickness decrease in the same direction) and west to east (mainly in the backstop zone).
REGIONAL HYDROGEOLOGY
The climate in Colombia is tropical, with a precipitation volume of 3,400 km3/year, of which 2,113 km3/year becomes surface runoff. Part of this volume of surface runoff water, approximately 676 km3/year (about 4.2 Billion Barrels of Water Per Day - BBWPD), corresponds to the volume of water drained by the river networks of the Llanos Basin [51]. In this basin, the estimated volume of co-production oil water is greater than 5 BBWPD, due to the regional groundwater flows, which control the formation of hydrocarbon accumulation in the southeastern part of the Llanos Basin [52]. The preferred direction of groundwater flows in the basin aquifers is from southwest to northeast, suggesting the Serranía de la Macarena as a recharge area. [53]. Structural sections in the Serranía de la Macarena show that most of the reservoirs are connected to the surface (semiconfined aquifer’s), confirming that this area serves as a regional water recharge zone [54]. Regional hydrodynamic and hydrogeochemical studies suggest the presence of upward flow plumes in the central part of the basin, adjacent to the deformation front, while from the east, there are counter-sloping flows to the west, feeding deep over pressured aquifers [19], [55]. Isotopic analysis of produced water shows that in deep aquifer zones (> 3 km), significant volumes of water are expelled as a result of smectite-illite transformation [56], [57].
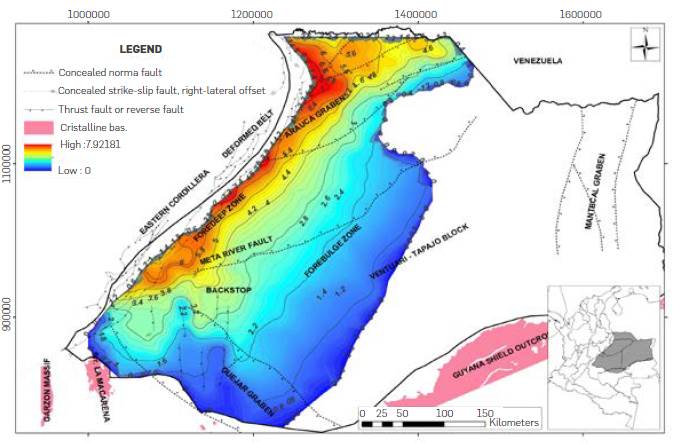
Figure 4 Structural map at the top of the Crystalline basement in km below sea level (color scale in km) constructed from the integration of structural maps published in previous works [28], [29], [33], [64], [65]. Outcrops of crystalline basement extracted from the Geological Map of Colombia [108].
GEOTHERMAL SETTING OF THE BASIN
The heat flux in the Llanos Basin offers a mean value of 37 mW/m2 and a mean geothermal gradient of 28ºC/km, tending to increase towards the south and east [58], [59], where the crystalline basement tends to be shallower, and where the concentration of radioactive elements is higher [16], [17]. Analysis of regional geothermal gradients supports this trend, showing that in the Llanos Basin, temperatures close to 120°C tend to be found at a depth of 4 km in the northern and central part, while towards the south and east, they tend to be found at depths of 3 km [60]. The decrease in the temperature gradient towards the west of the basin (Figure 3), is apparently related to the development of water-formation flows in deep aquifers [19]. Overpressures have been measured along the western edge of the Llanos Basin, probably caused by lateral influx of fluids from the uplifted folds and the deformed belt of the Eastern Cordillera [52]. Additionally, along the foredeep zone, Helium concentrations in aquifer fluids from the Une and Mirador Formations suggest probable mantle contributions [61].
3. DATA AND METHODOLOGY
Analyses of geothermal potential can be used to evaluate energetic resources and reserves, following the guidelines conventionally used for O&G exploration. Studies and publications related to the evaluation of regional caloric potential [62], [63], propose that the geothermal resource is the portion of thermal energy that can be exploited with current technology. Depending on the degree of knowledge and economic feasibility, geothermal resources can be classified as: low certainty; moderate certainty; high certainty.
STRUCTURAL MAPS
To evaluate the geothermal resource potential of the deep reservoirs in the Llanos Basin, depth structural maps were constructed, at the top of the Crystalline Basement, the top of the Paleozoic sediments, and the top of the Une Formation. These maps are expressed in km and show their depth Below the Sea Level (BSL). The structural map at the top of the Crystalline Basement (Figure 4) was constructed from published maps of the basin [28], [31], [33], most of which were the result of controlled seismic interpretation with O&G exploratory wells. The geometry of the major structural features of the Crystalline Basement (Figure 4), was compared with regional gravity and magnetic inversions published for the basin [29], [64], [65]. The structural map at the top of the Paleozoic sediments (Figure 5) was constructed from depths recorded by exploratory wells in the basin [27], [28], [31], [33], [53]. The structural map at the top of the Une Formation was constructed from thicknesses and tops reported by exploratory wells in the area (Figure 6.) and from maps published in previous work [39], [53]. The total isochore maps (total depth from ground level to the stratigraphic levels studied) were obtained by adding the values above sea level extracted from the Digital Elevation Model (Figure 1) to each constructed structural map.
MEAN SURFACE MAP
To estimate the temperatures at the top of each of the constructed structural maps (Crystalline Basement, Paleozoic sediments and Une Formation), the mean surface temperature (T P ) or ambient temperature was first calculated, considering the recommendations proposed by the USGS and the Geological Survey of Colombia for this type of regional analysis [10], [16], [17]. The spatial distribution of the mean temperature in Colombia (T P ) depends mainly on the topographic relief [66]. This dependence has led to several numerical regressions by various authors, in which the common terms are the following:
Where:
T P = Mean Surface Temperature
K = Temperature in the intercept at 0 MASL. Values for the Llanos Basin fluctuate between 27.08676ºC [67], 27.35ºC [68] and 27.425 [69].
c = Slope of the relationship between observed temperaturas in ºC and altitude measured in meters. Values for the Llanos Basin fluctuate between -0.00544 [67], 0.0058 [68].
H = Height of the land in MASL. This value was obtained from the Digital Elevation Model (DEM) with spatial resolution of 30 m [70], [71]
For this study, values of K and c were chosen, according to published works [67], considering a linear regression based on measured data for the Orinoco hydrographic basin, between parallels 3 to 6ºN, a latitudinal interval in which more than 80% of the Llanos Basin is located. Applying this linear regression into the DEM, a mean surface temperature (T P ) map for the entire Llanos Basin was obtained.
GEOTHERMAL GRADIENT MAP
The mean surface temperature (T P ) values added to downhole temperature data available in the literature [16], served to calculate the apparent geothermal gradient - temperature gradient between downhole and surface - at each well point using the following equation [72]-[74]:
Where:
GGT= Geothermal Gradient (ºC/Km)
TBHC= Temperature (ºC) recorded at the Bottom Hole
T P = Mean Surface Temperature
ZBH= True Vertical Depth (m) of temperature measurement in the well
The G GT values obtained for each well served as input to construct an apparent geothermal gradient map for the Llanos Basin (GGTM), interpolating the values by the spline method, controlling the interpolation with the basin boundary (Figure 7).
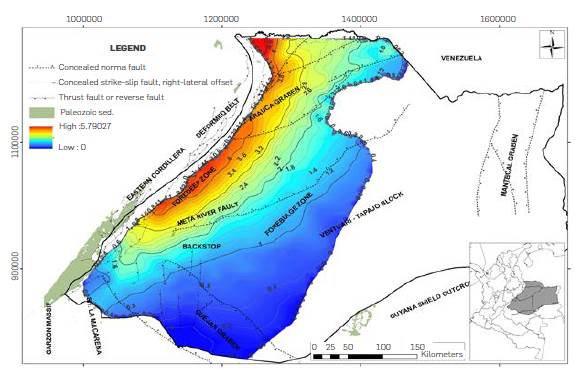
Figure 5 Structural map at the top of the Paleozoic sediments in km below sea level (color scale in km) constructed from the integration of structural maps published in previous works [27], [31], [33], [53]. Outcrops of Paleozoic rocks extracted from the Geological Map of Colombia [108]
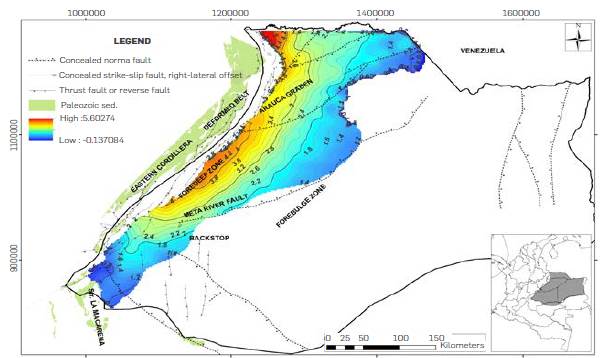
Figure 6 Structural map at the top of the Une Formation in km b.s.l (color scale in km). constructed from well tops analyzed in this study, as well as structural maps published in previous works [27], [31], [53].
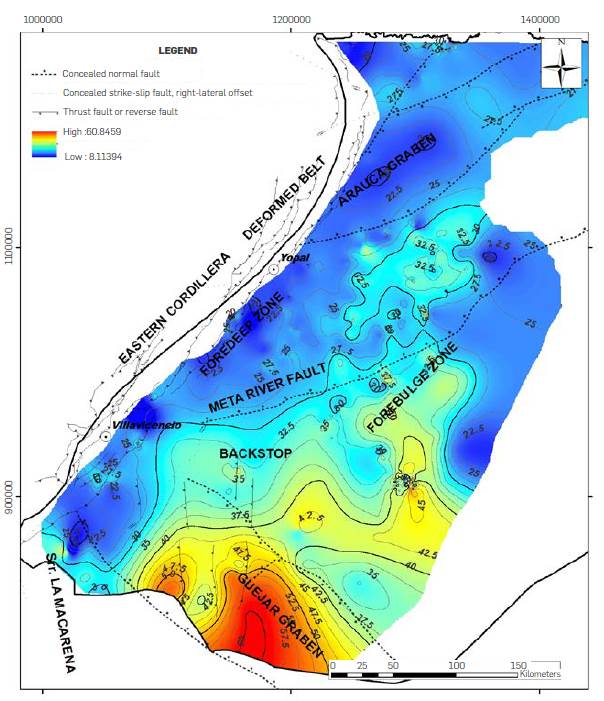
Figure 7 Map of apparent geothermal gradient for the Llanos Basin (GGTM) obtained from downhole temperatures and borehole depths (color scale in ºC/km). Note the arrangement between structures involving basement and variations in the geothermal gradient, suggesting that extensional structures in the southern part of the basin control areas of geothermal gradients close to 60ºC/Km. In contrast, extensional structures such as the Arauca graben present geothermal gradients lower than 30ºC/Km.
THERMOSTRATIGRAPHY
Knowing the apparent geothermal gradient, it is possible to calculate the temperature along selected surfaces (top of the Crystalline Basement, top of the Paleozoic sediments, and top of the Une Formation). To estimate the temperature at each structural map, the equation proposed by Cardoso and Hamza [74] was used:
Where:
T GRID = Temperature ºC calculated at the depth of the selected isochore map
Z GRID = Isochore map in Km (from ground level to the top of the formation)
Replacing terms of the G GT equation in the T GRID equation, an equation is obtained that allows to calculate the temperature at any point of an isochore map:
The application of this equation enabled the calculation of temperature at selected stratigraphic levels (Figures 8 to 10). The equation described above also allows calculating the depth of a given isotherm by changing the order of the terms as a function of Z GRID :

Where:
Z GRID = It is the value of the depth of the selected T GRID isotherm
Using this equation, depth maps of the 100ºC and 200ºC isotherm were calculated (Figures 11 y 12). Temperature maps at selected stratigraphic levels (top of Crystalline Basement, top of Paleozoic sediments and top of Une Formation), and depth maps of selected isotherm (100ºC and 200ºC) were compared with published maps [53], thermal structures resulting from basin models [52], [57] and the regional estimate of the Curie Deep Point derived from airborne magnetic data [75]. The comparison made it possible to adjust the temperature and isotherm maps (Figures 8 to 12), especially in areas with low information density, and also to compile the heat source generating mechanisms described in previous works.
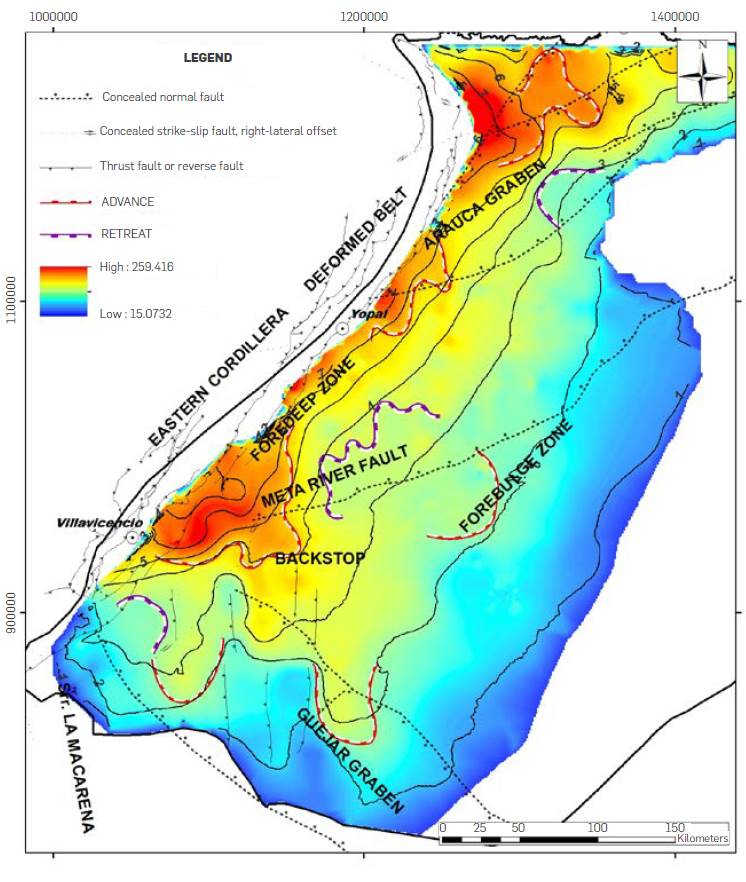
Figure 8 Temperature map in ºC at the top of the Crystalline Basement (color scale in ºC), calculated from the apparent geothermal gradient map for the Llanos Basin (GGTM map of Figure 7). The contours correspond to the sedimentary thickness between the ground level and the top of the Crystalline Basement. Note how temperatures are not related to Crystalline Basement depth, defining areas where isotherms advance towards shallower zones (red dotted line) or retreat towards deeper zones (blue dotted line), areas marked by the presence of basement structures such as the Güejar and Arauca grabens, as well the foredeep zone.
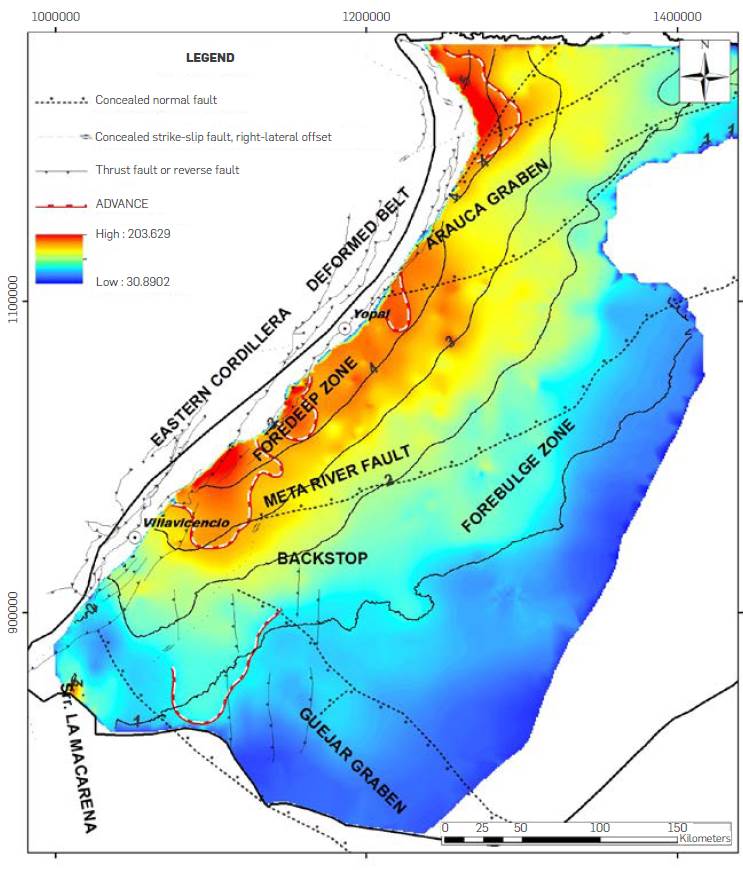
Figure 9 Temperature map in ºC at the top of the Paleozoic (color scale in ºC), calculated from the apparent geothermal gradient map for the Llanos Basin (GGTM map of Figure 7) . The contours correspond to the sedimentary thickness between the ground level and the top of the Paleozoic sediment. Note how temperatures are not related to Paleozoic sediments depth, defining areas where isotherms advance towards shallower zones (red dotted line), especially along the southern portion of the foredeep zone
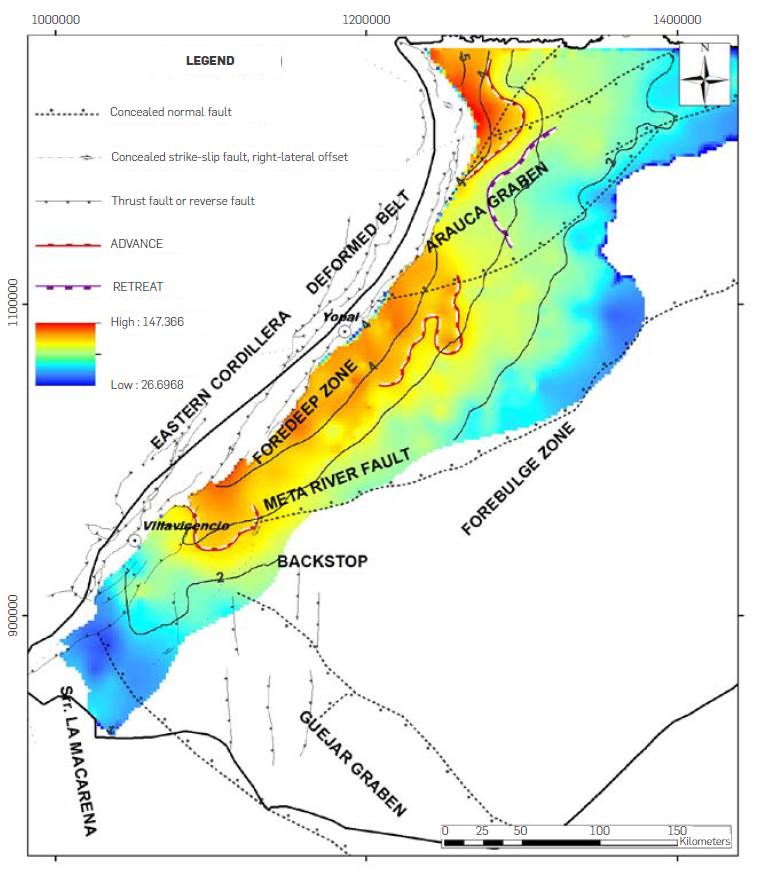
Figure 10 Temperature map in ºC at the top of the Une Fm. (color scale in ºC), calculated from the apparent geothermal gradient map for the Llanos Basin (G GTM map of Figure 7). The contours correspond to the sedimentary thickness between the ground level and the top of the Une Formation. Note how temperatures are not related to Une Formation depth, defining areas where isotherms advance towards shallower zones (red dotted line) or retreat towards deeper zones (blue dotted line)
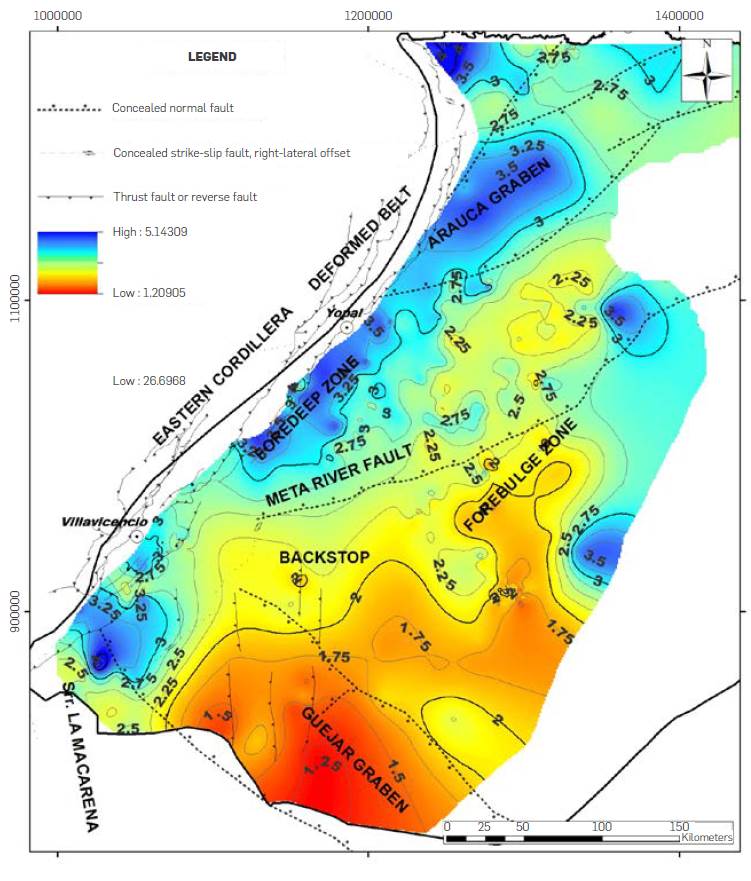
Figure 11 Depth map in Km of the 100ºC isotherm (values of contours and color scale in km) derived from the apparent geothermal gradient map for the Llanos Basin (GGTM map of Figure 7). Note that depths of the 100ºC isotherm with values greater than 3 km coincide with the expression of the foredeep zone and the Arauca graben, while toward the south of the Meta River Fault (especially along the forebulge zone and Güejar graben), the isotherm is present at less than 2 km of depth.
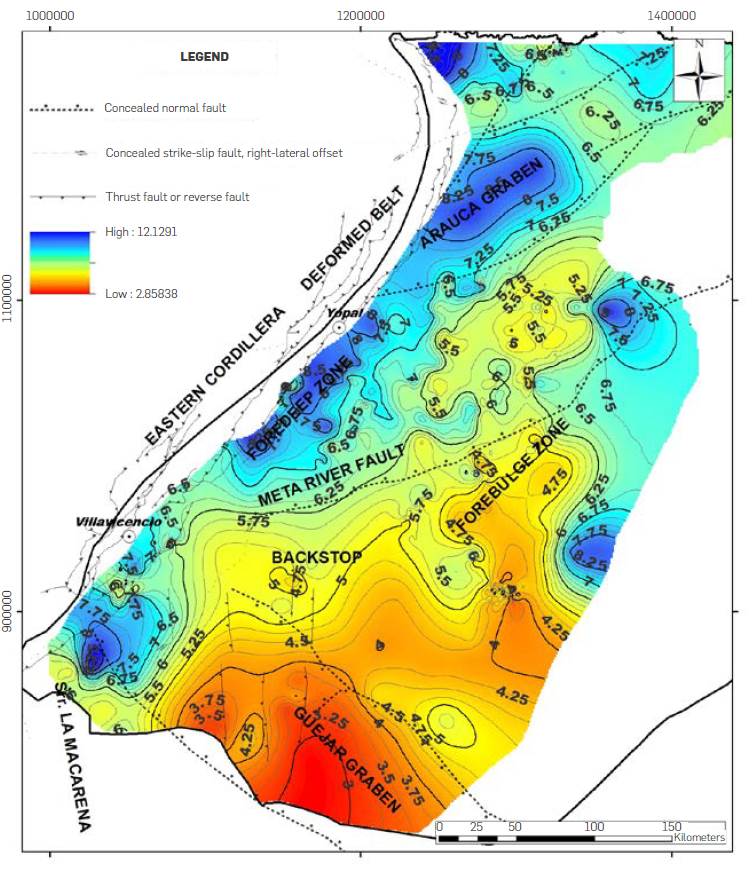
Figure 12 Depth map in Km of the 200ºC isotherm (values of contours and color scale in km) derived from the apparent geothermal gradient map for the Llanos Basin (GGTM map of Figure 7). Note that depths of the 200ºC isotherm with values greater than 6.5 km coincide with the expression of the foredeep zone and the Arauca graben, while toward the south of the Meta River Fault (especially along the forebulge zone and Güejar graben), the isotherm is present at less than 5 km of depth.
RECOVERABLE HEAT
Based on information from structural maps and temperatures at different depths and stratigraphic levels, the recoverable heat per unit was estimated, based on the volumetric method [10], [76]-[80],
using the following equations:
Where
Q Recoverable = Recoverable heat in Joules (J)
Q Total = Total heat stored in the reservoir (J)
R = Recovery factor (%)
Q r = Heat stored in the rock (J)
Q w = Heat stored in reservoir water (J)
ρ r = Rock density in kg/km3
ρ w = Water density in kg/km3
C r = Heat capacity of the rock in J/kg/ºC
C w = Heat capacity of water in J/kg/ºC
V = Volume of rock in km3
φ r = Rock porosity (%)
T = Reservoir temperature (ºC)
T 0 = Surface temperature (ºC)

To calculate the rock volume, it was defined by:
Where:
A = Area of the resource to be evaluated in Km2
D = Total thickness of the formation in Km
μ = Ratio of reservoir thickness to total unit thickness in %. For the crystalline basement, the assumed value is 1 (massive granite, without shales), for the Paleozoic 0.5 according to lithologic descriptions of well logs (Alvarado, 2013), and for the Fm, Une 0.9 [43].
The input values used to calculate the recoverable heat were the following:
ρ r = For the Crystalline Basement, a value of 2.89x10¹² kg/Km3 is assumed [81], for the Paleozoic sediments 2.47 x10¹² kg/km3 [31] and for the Une Formation, 2.42 x10¹² Kg/Km3 [31], [81]
ρ w = 1 x10¹² kg/Km3
C r = For the Crystalline Basement a value of 880 J/kg/ºC was used, and for the Paleozoic sediments and Une Formation reservoirs 775 J/Kg/ºC. These values are taken from published data [82], considering reservoir lithologies such as sands for the Une Formation and Paleozoic sediments, and granite for the Crystalline Basement. Cw = 4,180 J/kg/ºC [82]
φ r = For the Crystalline Basement, we propose 5% (fracture porosity), for the Paleozoic sediments 10%, and for the Une Formation, 20% according to published data [27], [83]
R= According to (Muffler and Guffanti, 1979), a first approximation of regional recovery can vary between 5 and 25%. In this paper, surface extractable potentials with recovery factors of 5 % will be presented (less prospective scenario).
POWER GENERATION POTENTIAL
Recoverable heat maps (Q Recoverable ) were used to estimate the power generation potential by dividing the value of each 1km2 cell by the time of project life (20 years in seconds). The value obtained was multiplied by the capacity factor, compiling the values proposed in different publications [79], [84], [85], which vary between 90 and 97%. The most conservative value (90%) was used in this case.
HYDRAULIC RECHARGE MAP
Based on regional hydrodynamics, hydrogeology and hydrogeochemistry work, a map of water flow directions in the aquifers of the Llanos Basin was constructed (Figure 13). This map is useful to identify the recharge processes and recharge areas of the aquifers, as well as their water productivity. Water salt content data in the Paleozoic and Une formations were also integrated, which is useful to define water migration and genetic processes. Considering the exposure of the outcrops and their connection with the reservoirs in the area of Serranía de la Macarena Srr. and south of the Eastern Cordillera, a regional hydrogeological balance exercise was conducted using the relationship proposed by JICA [86]:
Where:
R = Recharge in mm/year
P = Rainfall in mm/year. These values were taking from published work [87]
E = Evapotranspiration in mm/year. These values were estimated from published work [88]
ES= Runoff in mm/year. These values were taken from published work [89]
The values from the evapotranspiration measurement stations were interpolated to build an evapotranspiration map and subtracted from the precipitation map together with the runoff value (3,741 mm/year). The resulting 1 km2 resolution grid shows the total volume of water entering the aquifers as surface recharge per year in m3, as well as the zones where recharge occurs (areas with semi-confined aquifer conditions). The aquifer recharge map of the basin, integrated with the regional water flow directions, allows for identifying regional water transit corridors and compare them with the temperatures measured in wells. This comparison allows discriminating geothermal plays acc ording to the reservoir and hydrogeological system, in terms of type of aquifers (free, semi-confined, and confined).
PLAY DEFINITION, RISK AND CERTAINTY
The definition of geothermal plays in the Llanos basin was based on the selection of distinctive characteristics in elements such as reservoir (igneous, metamorphic, or sedimentary), type of porosity (primary or secondary), type of aquifer (confined, semi-confined or free) and aquifer recharge (surface water, diagenesis, etc.), following the guidelines and recommendations published on the subject [90]-[93]. The risk of potential energy generation from the analyzed reservoirs is defined as high, moderate and low, depending on the presence - reservoir quality (>20% low risk, 20 - 10% moderate risk, <10% high risk), reservoir temperature (>120ºC low risk, 120 - 100ºC moderate risk, <100ºC high risk) and reservoir depth (< 2km low risk, 2 - 4 km moderate risk, > 4 km high risk). The certainty of geothermal plays was defined in this study considering their exploratory or production maturity, using the terminology conventionally used for O&G [94], as known (proved temperatures and power generation), hypothetical (measured temperatures and fluid flows) and speculative (extrapolated information from wells).
THERMAL STRUCTURE
The surface temperature in the Llanos Basin varies from 27ºC (especially in the flat areas) to 14ºC (southern foothills of the Eastern Cordillera), with an average temperature of 27ºC. The geothermal gradient of the basin, derived from the information of the exploratory wells, is heterogeneous, with values from 10ºC/km north of the Serranía de la Macarena, up to 60ºC/km in the Graben del Güejar area, with an average of 32ºC/Km (Figure 7). Most of the high geothermal gradient values are concentrated in the central part of the Graben del Güejar, tending to intermediate values in the backstop zone, and decreasing in a stepwise way towards the north (Figure 7). This variation coincides with the orientation of large normal faults such as the Meta River and the Arauca Graben (Figure 7). Temperatures calculated at the top of the Crystalline Basement, using the geothermal gradient map of the basin, show minimums of 15ºC, especially towards its eastern edge, direction in which Meso-Proterozoic rocks outcrop, increasing up to 259ºC to the west along the foredeep zone (Figures 4, 5 and 8).
The isotherm map calculated at the top of the Crystalline Basement does not coincide with the structural contours of the basement in some sectors. Regionally, isotherms with values greater than 200ºC are located less than 6 km deep at the southwestern edge of the basin, while to the northeast, along the foredeep zone, these vary between 6 and 7 km deep (Figure 8). This variation in depth of the 200ºC isotherm suggests that, thermally, the foredeep zone of the Llanos Basin tends to be cooler to the northeast and warmer to the southwest. Locally, towards the south of the Llanos Basin, isotherms higher than 80ºC, advancing up dip, from 3 to 2 km deep, in a north - south direction, extending over areas between 20,000 to 30,000 Km2 (Figure 8). There are also areas where the 80 and 100ºC isotherms retreat down dip, especially in the western part of the Güejar Graben, along the hanging wall of the Meta River Fault and the eastern edge of the Arauca Graben (Figure 8). Despite the high geothermal gradients (60ºC/Km) in the central part of the Güejar Graben, the temperatures at the top of the crystalline basement do not exceed 100ºC. This is caused by the reduced thickness of the sedimentary cover in this area, which tends to be less than 2 km (Figure 8).
At the top of the Paleozoic sediments, the calculated isotherm map suggests a mean temperature close to 78ºC. The maximum values of the isotherms are concentrated along the foredeep zone of the Llanos Basin, exceeding 200ºC, while decreasing towards the east, to temperatures close to 30ºC (Figure 9). Locally, to the west of the backstop and the Arauca Graben, isotherms close to 150ºC, advance up dip, with a west-east direction, from 5 to 4 km depth (Figure 9). The isotherm map calculated at the top of the Une Formation shows an increase in temperature from east to west, from less than 30ºC to more than 150ºC. To the west of the Arauca Graben, temperatures at the top of this unit exceed 140ºC, decreasing in a southeastern direction, along the fore deep zone of the Llanos Basin, to minus 100ºC (Figure 10). Locally, to the west of the Arauca Graben, isotherms higher than 120ºC advance up-dip, in a west-east direction, from 4 to 3 km depth (Figure 10). In the opposite way, along the same structure, isotherms greater than 80ºC dip downward, in an east-west direction (Figure 10).
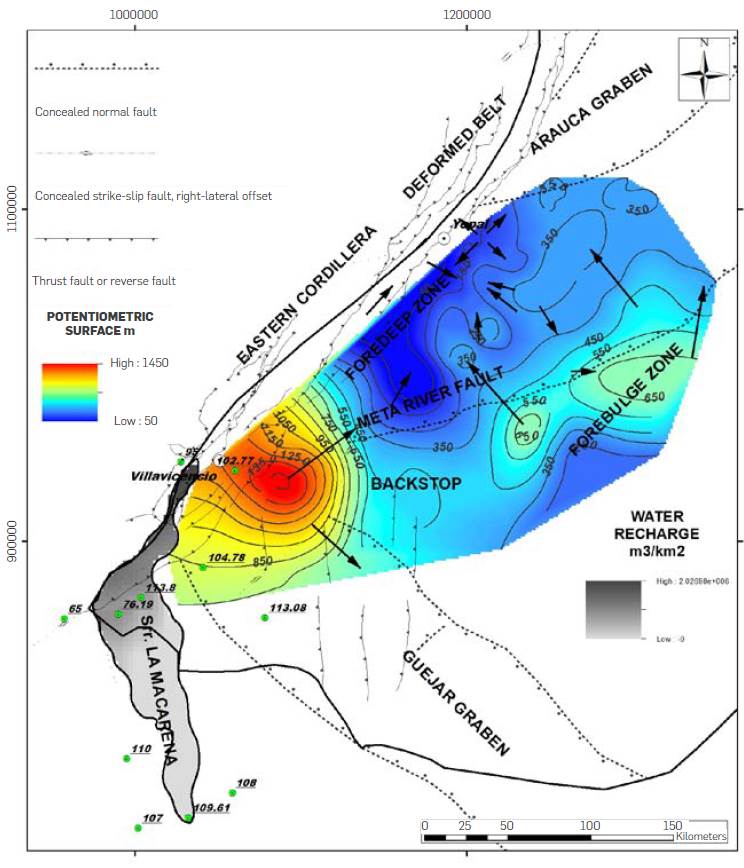
Figure 13 Hydraulic load map for pre-Oligocene units and flow lines (dark arrows), modified from published works in the area [53], [55]. Note that the potentiometric surface (red to blue color scale in m), suggest great hydraulic heat (greater than 800 m of high), near to the water recharge zone (gray scale in m3/km2 for the grid constructed along the Serranía de la Macarena), with values greater than 2x10⁶ m3/km2. The map suggests also a second hydraulic heat along the forebulge zone (less than 200 m of high). Uplift currents of water are concentrated in the foredeep zone associated with faults that connect deepest reservoirs with shallower levels.
The depth maps of the isotherms along the Llanos Basin show well coincidence with regional structures such as the Arauca Graben and the Meta River Fault (Figures 11 and 12). The depth map of the 100ºC isotherm shows that, on average, it can be found at 2.4 km, reaching more than 3.5 km depth along and southwest of the axis of the Arauca Graben. In contrast, towards the south of the Llanos Basin, this isotherm can reach less than 1.5 km depth, especially in the central part of the Güejar Graben (Figure 11). The depth map of the 200ºC isotherm shows that, on average, it can be found at 5.7 km, reaching more than 8 km depth, along and southwest of the axis of the Arauca Graben. In the central part of this structure, the 200ºC isotherm can reach less than 3.5 km depth (Figure 12). Completely, the 100 and 200ºC isotherm maps indicate that they tend to deepen along the axis of the Arauca Graben and the fore deep zone of the Llanos Basin, while to the south, in the central part of the Güejar Graben, the isotherm maps indicate that they tend to become shallower.
The depth variations observed in the isotherm maps suggest that the thermal structure is not homogeneous and is tectonically segmented in the basin. This segmentation would be linked to Meso to Neo Proterozoic cortical structures, which affect the crystalline basement (Arauca and Güejar), as well as the foredeep zone formed during the Cenozoic. The 200ºC isotherm map reflects clearly this tectonic segmentation of the thermal structure, highlighting additional elements such as the Meta River Fault, and some orthogonal lineaments (Figure 12). Another isotherm (580ºC), obtained from the Curie Point Depth Map [75], reflects the regional orientation of the Arauca and Güejar grabens, as well as the foredeep zone, very similar to that observed in the 100 and 200ºC isotherm maps (Figures 11 and 12).
HYDROGEOLOGY AND HYDRO-GEOCHEMISTRY
Regional hydrogeologic and isotopic information available on water extracted from reservoirs in O&G producing fields suggests that the Mesozoic sequences (Une and Guadalupe formations), have two freshwater hydraulic head zones [53]-[55]. One of these hydraulic head zones is located to the southwest of the foredeep, in the range of 800 m height, while the other one is located to the east of the Llanos Basin, in the range of 300 m height (Figure 13). Regional freshwater flow directions derived from hydraulic head maps show preferential orientation from the southwest to the east and northeast of the basin, and another from east to west (Figure 13). The push generated by these hydraulic heads has regional expression, controlling the distribution and lateral trapping of heavy oil hydrocarbon, especially in the southern part of the Llanos Basin [54]. The fields located in these areas tend to produce O&G with water cuts above 95% and volumes exceeding 2 million BWPD [22]. In some areas of the central and northern part of the basin, radial water flow patterns have been reported, interpreted as the result of rising water columns (Figure 13). Isotopically, these waters are of diagenetic origin, and their ascent is related to fault systems that communicate deep reservoirs with shallower ones [55]-[57].
In the Llanos Basin, rainfall varies between 2,000 mm/year and 5,000 mm/year, with values below 2,500 mm/year predominating [87], [95], [96]. The areas with the highest rainfall (5,000 mm/year) are concentrated along the western edge of the basin, especially in the area of Serranía de la Macarena and the southern foothills, where Crystalline Basement rocks, Paleozoic sediments, and the Une Formation outcrop. In this area, precipitation averages 3,305 mm/year, with an average evapotranspiration of 1.258 mm/year [88] and runoff of 1.666 mm/year [89]. The hydrological balance carried out suggests that the area with the lowest recharge is located south of Serranía de la Macarena, with values close to zero or negative, while the area with the highest recharge is located in the northern part of the mountain range and south of the foothills of the Eastern Cordillera, reaching more than 2.000 mm/year (Figure 13). Volumetrically, the balance suggests that more than 2.196 million m3/year enter the subsurface of the Llanos Basin through the recharge area, of which 533 million m3/ year are extracted for hydrocarbon production. Smaller recharge areas are proposed from the eastern part of the Llanos Basin, and water inputs from diagenesis along the foothills of the central and northern Eastern Cordillera [55]. Structural models of the area suggest a connection between outcrops of the Crystalline Basement, Paleozoic and Une Formation, and the reservoirs drilled in the Apiay, Castilla, and Chichimene fields [54]. This connection suggests that the Crystalline Basement, the Paleozoic sediments, and the Une Formation can be considered semi-confined aquifers, which recharge area of approximately 5,067 km [53], according to the hydrogeological balance, would be in the Serranía de la Macarena and southern foothills (Figure 13).
RESERVOIRS
The crystalline basement of the Llanos Basin has been scarcely drilled; however, due to outcrops in the Eastern Cordillera and the Guyana Shield area, it is considered to be composed of igneous and metamorphic rocks. Thus, the presence of reservoir in these rocks is analyzed based on the presence and density of faults in the basin (Figure 14), which were compiled from published works [28], [29], [31], [33], [54], [64]. The highest density of faults seems to be concentrated on the western edge of the Güejar Graben, an area where it appears to collide with the basement of the Eastern Cordillera (Figure 14). Numerous normal and reverse faults are observed in this zone, some with tectonic inversion, but all with an echelon pattern as related to the axis of the rift (Figure 14), suggesting trans-tensional displacements. Another zone of medium density of faults is situated between the Meta River Fault and the Arauca Graben, where synthetic normal faults predominate, antithetical to the general displacement of the Eastern Cordillera (Figure 14). Smaller areas with intermediate fault densities are found along the Arauca Graben.
The distribution and characteristics of the Paleozoic sediments in the Llanos Basin are partially known from samples and logs obtained during exploratory drilling [27], [28], [32], [33], [97], [98]. This information allows us to consider that most of the reservoirs of this age are composed by sandstones, concentrated mostly in the eastern and central part of the basin. Mudstones interbeddings are frequent and predominate over sandstones in the western and southern edge of the basin (Figures 2 and 15). The highest porosity values in the Paleozoic sediments coincide with the distribution of sandstones in the basin, varying between 10 and 15%, whereas in the mudstones-dominated areas, values below 5% are common (Figure 15). Some wells in the southern part of the foredeep zone describe the occurrence of Paleozoic sedimentary rocks, mainly shales and mudstones, affected by low-grade regional metamorphism, like the rocks that outcrop west of the Villavicencio locality (Figure 15). In this zone, the porosity is associated to the occurrence of faults, which affect the Crystalline Basement, the Paleozoic rocks, and the Une Formation.
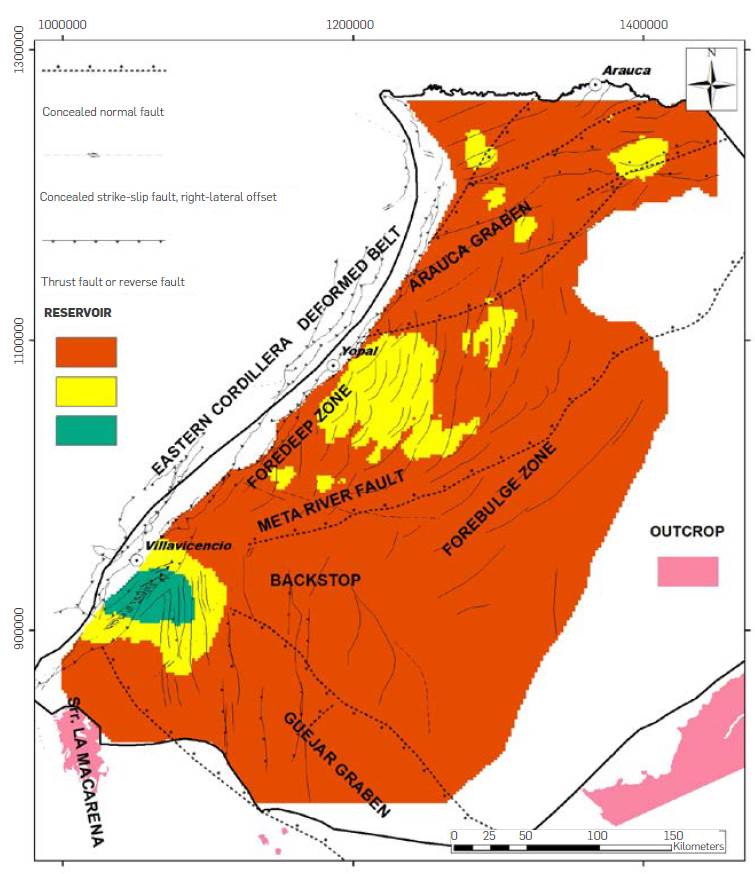
Figure 14 Proposed reservoir map based on the distribution and relative density of faults at the top of the Crystalline Basement (green: best reservoir area; yellow: area with moderate conditions for reservoir; red: areas with poorly conditions for reservoir). The fault distribution map was the result of integration of published works [28], [31], [33], [54], [64], [65], [98]. Outcrops of crystalline basement extracted from the Geological Map of Colombia [108].
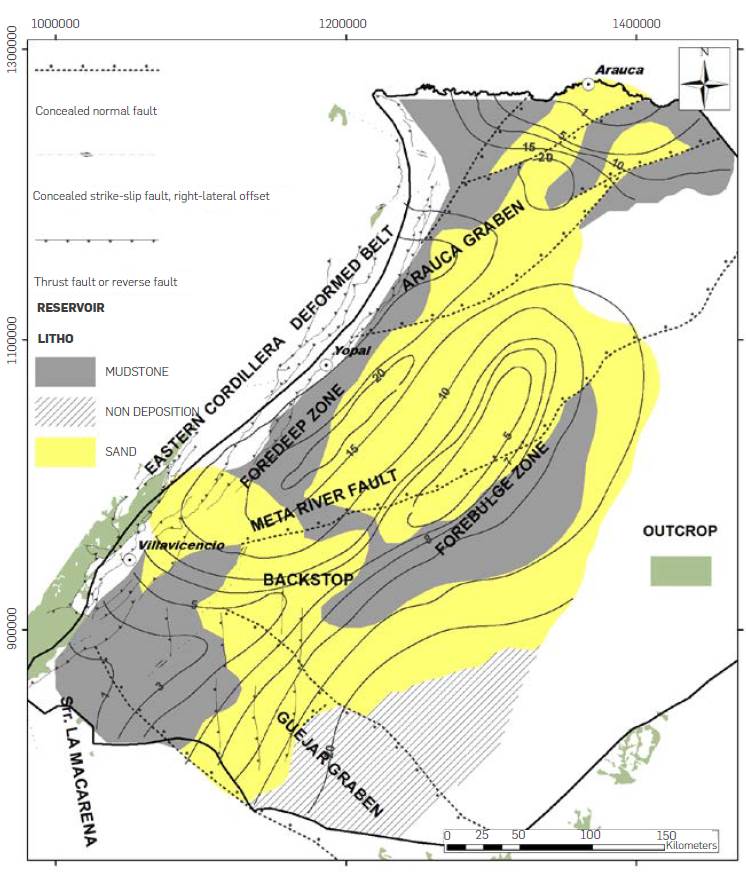
Figure 15 Map of sedimentary facies identified in the Paleozoic and mean porosity values (contour map) obtained from published works [27], [31], [98]. Outcrops of Paleozoic sediments extracted from the Geological Map of Colombia [108].
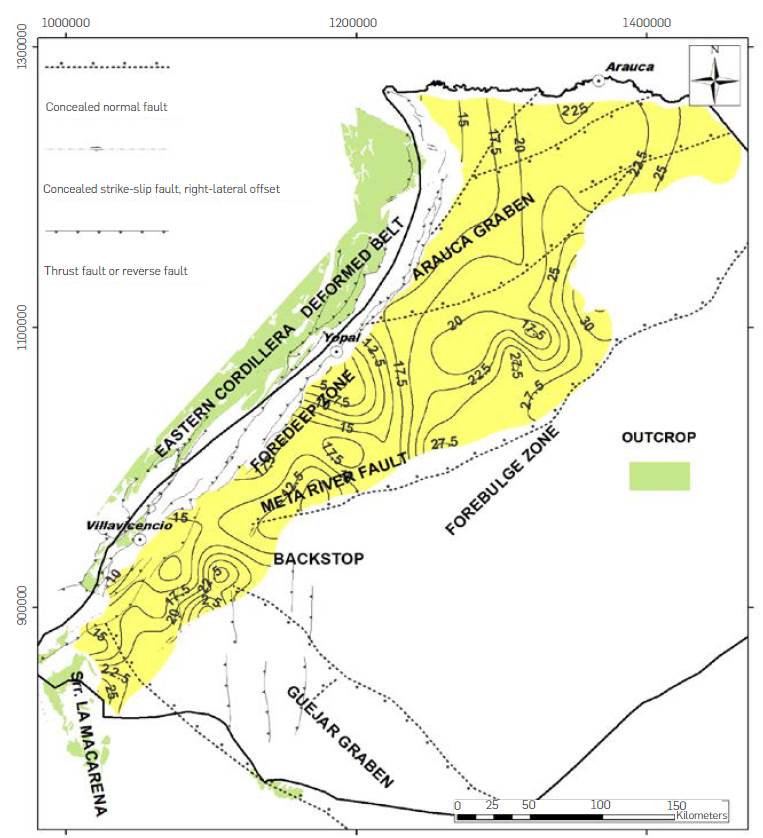
One of the reservoirs with well properties is the Une Formation. The thickness of this formation regionally tends to be constant, with generalized thinning towards the eastern edge of the basin. Towards its western edge, its thickness tends to increase, reaching more tan 200 m [34], [54], [99], [100]. It is a formation essentially composed of coarse to fine- grained quartz sandstones. The porosities observed in the wells vary between 15% and 30% [101], tending to be high towards the east and decreasing towards the western edge of the basin (Figure 16).
POTENTIAL HEAT OF THE BASIN
The evaluation of heat resources was based on the rock volume method, in the Crystalline Basement, Paleozoic sediments, and the Une Formation (see equations for estimating total heat, and their subsequent equations in the methodology section). The definition of the reservoir rock volume in the Crystalline Basement assumed a constant thickness of 1 km for the basin area, resulting in a rock volume of 114,770 km3. The heat of rock stored in this volume is 2.13x10²² Joules, with a mean of 1.86x10¹⁶ Joules. The heat of water stored in this volume of rock is 1.83x10²¹ Joules, with an average of 1.61x10¹⁶ Joules. The total heat stored in the crystalline basement (rock plus water) is 2.31x10²² Joules, with an average of 2.02x10¹⁷ Joules per 1 km2 cell. The amount of recoverable heat (Q Recoverable ) from the total estimated volume of rock - fluid volume considered for the Crystalline basement is 1.15x10²¹ Joules, with an average of 1.01x10¹⁶ Joules per cell of 1km2. This amount of recoverable heat is equivalent to 1,732 GWe, with a basin-wide average value of 15MWe per 1km2 cell. The distribution of the total heat stored in the Crystalline Basement of the Llanos Basin allows defining two areas with a total heat greater than 2.49x10¹⁷ Joules per 1 km2 cell (Figure 17). One of these areas (Area 1) is located west of the backstop zone (Figure 17), with 14,472 km2 and a total potential heat of 4.61x10²¹ Joules. A second area (Area 2), located along the foredeep zone and the Arauca Graben (Figure 17), has 21,626 km2 and a total potential heat of 6.98x10²¹ Joules. The total amount of heat from these two zones (corresponding to 32% of the surface of the Crystalline basement) is approximately 1.16x10²² joules, which corresponds to 50% of the total heat stored in the entire analyzed part of the Crystalline basement, equivalent to 17,400 GWe.
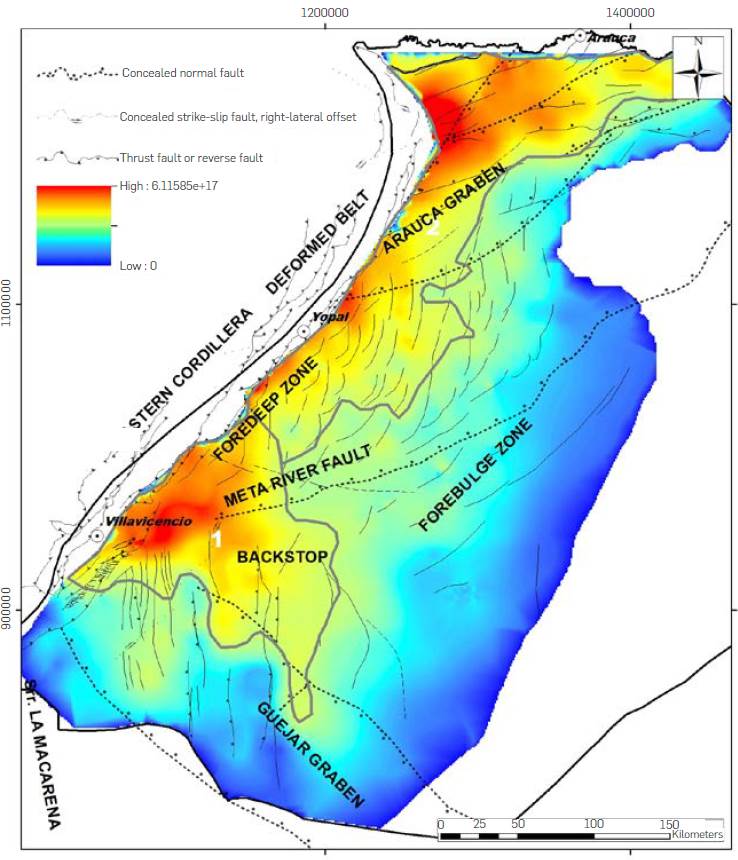
Figure 17 Map of total heat stored in Crystalline Basement rocks (color scale in Joules per 1 km2 cell). Thick grey line polygons define the location of two prospective areas (1: West of the back stop; 2: Foredeep zone - Arauca Graben) that contain the 50% of the total heat stored in the Crystalline Basement, with cell values greater than 2.49x10¹⁷ Joules.
The calculated rock volume for the Paleozoic sediments is approximately 38,430 km3. This rock volume stores a total of 4.28x10²¹ Joules, with a mean value of 3.86x10¹⁶ Joules. The water heat in this volume of rock is 9.64x10²⁰ Joules, with a mean value of 8.7x10¹⁵ Joules per 1 km2 cell. The total heat stored in the Paleozoic sediments (rock plus water) is 5.24x10²¹ Joules, with a mean of 4.73x10¹⁶ Joules per 1km2 cell. The recoverable heat from the total rock - fluid volume considered for the Paleozoic sediments is 2.62x10²⁰ Joules, with an average of 2.36x10¹⁵ Joules per 1 km2 cell. This amount of recoverable heat is equivalent to 394 GWe, with an average of 3.5 MWe per 1 km2 cell. The distribution of total heat in the Paleozoic sediments of the Llanos Basin suggests that in two areas the total heat per 1 km2 cell is greater than 8.27x10¹⁶ Joules (Figure 18). One of these areas (Area 1), covers the west side of the backstop zone and the southern portion of the foredeep zone (Figure 18), with 7,296 km2 and a total potential heat of 9.03x10²⁰ Joules. A second area (Area 2), located along the foredeep zone of the Arauca Graben (Figure 18), has 13,663 km2 and a total heat potential of 1.71x10²¹ Joules. The total amount of heat of these areas (equivalent to 18% of the area covered by the Paleozoic sediments of the Llanos Basin) is about 2.61x10²¹ Joules, which is equivalent to 50% of the total heat stored in the Paleozoic sequence, equivalent to 3,930 GWe.
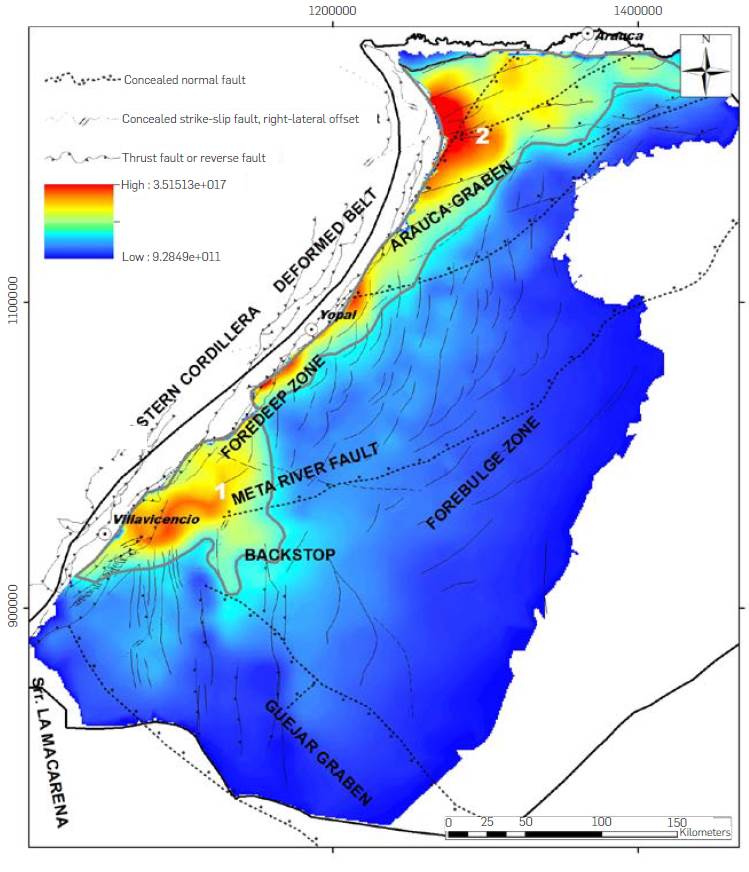
Figure 18 Map of total heat stored in Paleozoic sediments (color scale in Joules per 1 km2 cell). Thick grey line polygons define the location of two prospective areas (1: West of the back stop; 2: Foredeep zone - Arauca Graben) that contain the 50% of the total heat stored in the Paleozoic sediments, with cell values greater than 8.627x10¹⁶ Joules.
The Une Formation has a rock volume of 5,556 km3, a volume that can store about 5.51x10²⁰ Joules, with an average of 9.79x10¹⁵ Joules. The heat generated by the water contained in this reservoir is 7.66x10¹⁹ Joules, with an average of 7.77x10¹⁹ Joules. The total heat stored in the formation (rock plus water) is 8.58x10²⁰ Joules, with an average of 1.52x 10¹⁶ Joules per 1km2 cell. The recoverable heat from this volume is 4.29x10¹⁹ Joules, with an average value of 7.62x10¹⁴ Joules per 1 km2 cell. This amount of recoverable heat is equivalent to 68 GWe, with an average of 1.2 GWe. The distribution of total heat in the Une Formation suggests that in two areas the total heat per 1 km2 cell is greater than 2.33x10¹⁶ Joules (Figure 19). One of these areas (Area 1), is located in the southern part of the foreland zone (Figure 19), with 1,384 km2 and a total heat of 3.30x10¹⁹ Joules. A second area (Area 2), located along the northern part of the foredeep zone and the Arauca Graben (Figure 19), has 12,464 km2 and a total potential heat of 3.96x10²⁰ Joules. The total amount of heat from these areas (which is equivalent to 24% of the area covered by the Une Formation) is approximately 4.29x10²⁰ Joules, which is equivalent to 50% of the total heat stored in the Une Formation, equivalent to 648 GWe.
THERMAL STRUCTURE
The average value of the heat flow in the Llanos Basin is 37 mW/ m2 with an average geothermal gradient of 28ºC/Km, tending to increase towards the south and east of the basin, thus defining a high geothermal anomaly [58], [59]. Towards these areas of the basin, the Crystalline Basement tends to be shallower, and the concentration of radioactive elements is higher [16], [17]. Regional geothermal gradient analyses support this trend, showing that in the Llanos Basin, temperatures near 120°C tend to be found at 4 km depth in the northern and central part, while to the south and east, they tend to be at depths of 3 km [60]. This thermal regime at first glance is not suitable for large energy production; however, in some sedimentary basins in North America (Mississippi, Teapot dome, California) and China (Huawei), there are currently projects that generate power from conventionally exploited reservoirs to extract O&G, between 2 and 4 km depth [12], [102]. The geothermal system in these areas is controlled by heat conduction, especially by heat input from the basement, as well as structures that affect the crystalline basement. Regional conditions of reservoir depth, temperatures, and basement structure are found in the Llanos Basin and allow considering it a prospect for exploration and exploitation of geothermal resources. The integrated data indicates that the Crystalline Basement of the Llanos Basin was affected by a graben system, longer than 300 km, wider than 50 km, formed during the Neoproterozoic [33], [39]. These structures controlled the distribution and thickness of sedimentary sequences during the Paleozoic, and partially reactivated during the Mesozoic. Despite the age of these structures, the present-day geothermal gradient and temperature inferred from the CDP are strongly controlled by them (Figure 7).
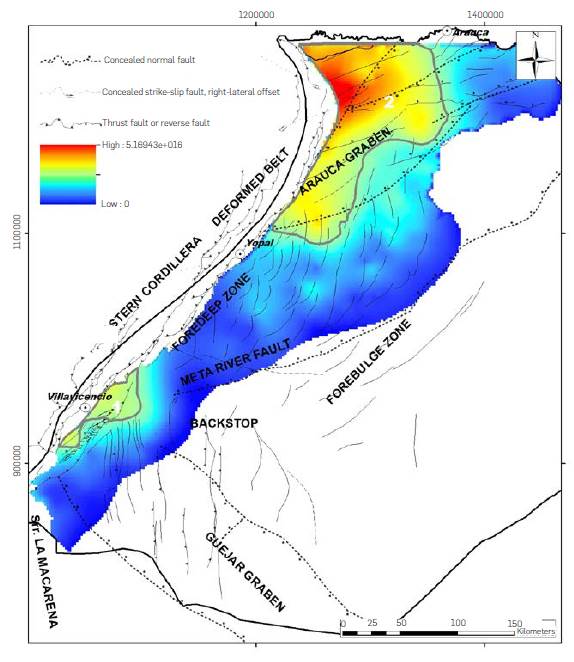
Figure 19 Map of total heat stored in the Une Formation (color scale in Joules per 1 km2 cell). Thick grey line polygons define the location of two prospective areas (1: Southern foredeep zone; 2: Arauca Graben) that contain the 50% of the total heat stored in the Une Formation, with cell values greater than 2.33x10¹⁶ Joules.
Temperatures calculated at the top of the Crystalline Basement, the Paleozoic sediments, and the Une Formation tend to increase along the foredeep zone. However, along the strike of this zone, the isotherms tend to be deeper towards the northeast, while they become shallower towards the southwest (Figures 3, 8, 9 and 10). This change along the strike of the foredeep zone, coincides with the increase in thickness from southwest to northeast (from less than 0.2 km in the Serranía de la Macarena area, to more than 2 km in the northern area of the foredeep zone), of the sedimentary sequences accumulated during the Neogene - Quaternary [44], [54]. The numerical models and temperature measurements in marine sedimentary basins, show that zones with increased sedimentation rates tend to undergo a decrease in their geothermal gradient [103], [104]. Considering the increase in accumulated sedimentary thicknesses towards the north of the foredeep zone, it’s possible to consider that the thermal structure has been dilated by the high sedimentary rates in this sector. In contrast, towards the south of the foredeep zone, the low accumulated thickness allowed to preserve the thermal structure.
The lateral variation of gradient temperature may be related to the expulsion of diagenetic waters from deep aquifers, which occurred during the structural advance of the Eastern Cordillera foothills [19]. These areas with probable fluid expulsion from deep reservoirs, coincide with areas where overpressures have been measured, along the Llanos foothills [52], as well as the presence of helium, with isotopic signatures linked to mantellic sources to the foredeep zone through cortical fault systems [61]. In this context, is may be considered that the structural advance of the Eastern Cordillera foothills over the Llanos Basin has led to the expulsion of overpressure waters in clay units, which have probably started their transformation process from smectite to illite, further dilating the thermal structure along the central-eastern edge of the Llanos Basin.
HYDROGEOLOGY AND HYDRO CHEMISTRY
The connection of the aquifers in the southern part of the Eastern Cordillera foothills with surface recharge zones in the Serranía de la Macarena, cause the input of more than 2 Billion m3/year of water, added to a hydraulic head of more than 800 m difference. This strong inflow and hydraulic differential, seem to locally "cool" the thermal structure at the top of the Crystalline Basement, Paleozoic sediments and Une Formation in the southwest border of the basin for more than 50 km (Figures 8 to 10). To the center and north of the basin, occur a similar phenomenon, less extended, may be connected to distal recharge of semi-confined aquifers from the eastern edge of the basin, as well as upward plumes of water from deeper aquifers (Figures 8 to 10). However, despite the high-water recharge and the large hydraulic head present in the southwestern border of the basin, in some sectors, the thermal structure appears to advance for distances greater than 100 km over the top of the Crystalline Basement, the Paleozoic sediments, and the Une Formation (Figures 8 to 10). This hydrodynamic activity in the deepest aquifers in the southwestern border of the basin suggest that cold-water wedges retract the thermal structure, while they are heated and injected towards the southeast and east of the Llanos Basin (Figures 8 to 10). Additionally, the hydrodynamic activity controls the distribution of heavy oils throughout the southern part of the Llanos Basin, more than 200 km to the east of the recharge zone (Serranía de la Macarena), affecting fields such as Rubiales [52], [54].
The Cl/HCO3 anion ratios in the Une Fm. tend to be higher in the central area of the foredeep zone, suggesting contributions of salty formation waters [56]. This salt probably was supplied from Lower Cretaceous to Upper Jurassic sediments, as evidenced in outcrops and inactive salt exploitations to the northeast of Villavicencio. Regional hydrodynamic and hydrogeochemical studies suggest the presence of upward flow plumes in the central part of the basin, adjacent to the deformation front, while from the east, there are counter-sloping flows to the west, feeding deep overpressure aquifers [19], [55]. Isotopic analyses in production waters show that in deep aquifer zones (> 3 km), there is the expulsion of significant volumes of water, product of smectite-illite transformation [56], [57].
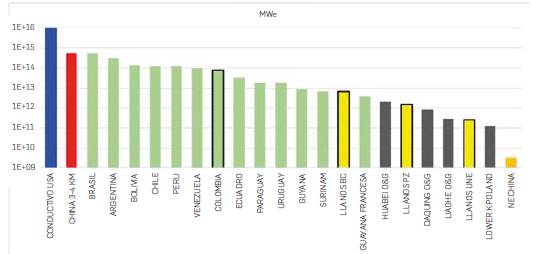
Figure 20 Comparative histogram of total energy resources calculated by volumetric method resulting from this study (Crystalline basement: LLANOS BC; Paleozoic: LLANOS PZ; Une Fm.: LLANOS UNE) and published for sedimentary basins (Conductive USA) in the United States [10], China between 3 and 4 km depth [80], South American countries [105], O&G fields in China co-producing energy [106] and evaluation of NE China [77] evaluation of NE China [77].
AREAS WITH GEOTHERMAL POTENTIAL AND ASSESSMENT RESOURCES
The combined geothermal potential of the Crystalline Basement, Paleozoic sediments, and Une Formation in the Llanos Basin reaches 3x10²² Joules, estimated by the volumetric method. From this potential, near of 2.3x10²² Joules come from the Crystalline Basement, 5.18x10²¹ Joules from the Paleozoic sediments and 8.56x10²⁰ Joules from the Une Formation. This combined geothermal potential in the formations analyzed in the Llanos Basin is equivalent to 11% of the total geothermal potential of Colombia (Figure 20), estimated by Vieira [105]. Sedimentary basins in China with areas and reservoirs like those in the Llanos Basin present a similar potential heat [80], [106], exceeding the total estimated geothermal potential for countries in South América such as Suriname and French Guyana (Figure 20).
The comparative analysis of temperature - reservoir - potential energy results for the Crystalline Basement, the Paleozoic sediments, and the Une Formation, suggest that the southern areas of the Llanos Basin are within a moderate risk zone. In this sector, the great risk is related to the presence of reservoir in the Crystalline Basement and in the Paleozoic sediments (according to the lithology and fault density maps), as well as temperatures above 125ºC in the Une Formation. It is to be highlighted that although regional geothermal studies persistently suggest the presence of a geothermal gradient anomaly in the Rubiales area, greater than 40ºC/Km [15], [17], wells in the area do not exceed 1,000m. Several authors suggest that this anomaly reflects basement topography and probable granitic intrusions [15], [19]. However, this geothermal gradient anomaly would not be consistent with a stable, Precambrian-aged basement [20], an inconsistency that seems to be confirmed by the Curie temperature map [75], which suggests a maximum cortical thickness in the area and a low geothermal gradient.
Published hydrodynamic and hydrogeochemical information and models suggest an important recharge with surface water from the basal reservoirs of the Serranía de la Macarena and southern foothills of the Eastern Cordillera, recharge that controls the distribution and tilting of heavy oil contacts along the southern Llanos Basin [15], [17]. Under these conditions and considering the presence of a regional hydraulic head very close to the surface recharge zone (Figure 13), in the range of 800 m of high with respect to Rubiales [53], [55], it may be said that part of the temperature increase in the Rubiales field reservoirs is associated with warm water plumes coming from the west of the basin. As previously discussed in the hydrogeological and hydrogeochemical analysis, the thermal structure at the top of the Crystalline Basement appears to advance for distances greater than 100 km (Figure 8). This dynamic in the southern foothills area raises the possibility of cold-water wedges that locally retract the thermal structure, while they are heated and injected towards the southeast and east of the Llanos Basin (Figures 8 to 10).
PROPOSED PLAYS IN THE LLANOS BASIN
The integrated analysis of the distribution of reservoirs (Crystalline Basement, Paleozoic sediments and Une Formation), their temperature and depth along the Llanos Basin, have allowed defining corridors with better geothermal prospectivity. Hydrogeological and hydrogeochemical analyses are added to defined corridors elements such as: a) type of aquifer (confined, semi-confined, free); b) location of recharge zones; c) regional flow directions; d) water composition. Considering the geothermal corridors and their hydrogeological and hydrogeochemical elements, three plays with regional extension were defined (Figure 20).
The first reservoir play (Play A) is composed by rocks of the Crystalline Basement - Paleozoic sediments, which porosity is given mainly by fracture systems and temperatures above 120ºC (Figures 8, 9, 14 and 15). This play is developed mainly in the southwestern part of the Llanos Basin, an area where the Crystalline Basement and the Paleozoic sediments outcrop and serve as a recharge area, allowing them to be considered as semi-confined aquifers (Figures 14, 15, 21 and 22). Wells’ data is not available to evaluate the regional hydrodynamic flow within the Crystalline Basement or Paleozoic sediments, so the advance or retreat of isotherms, salt wedges and hydraulic connectivity with recharge zones cannot be established with certainty. However, the high regional hydraulic head leads to think that a significant hydraulic flow can develop through the fractured Crystalline Basement and Paleozoic sediments zones. The total heat potential in the play area (8,854 Km2) can reach 4.11x10²¹ Joules (Figure 21). The theoretically extractable energy from this amount of heat stored in the area of the Play A is 310 GWe (see methodology for heat to power generation potential conversion). This play can be considered hypothetical according to the O&G play nomenclature, as the basement in the southwestern part of the basin has not been drilled and water production has not been tested.
A second play (Play B) is composed by a siliciclastic reservoir, known as Une Formation, with primary porosity greater than 10%, and temperatures between 80 and 120ºC (Figures 10, 16, 21 and 22). This play is located mainly in the southern part of the foredeep zone of the basin, an area in which the reservoir outcrops along Serranía de La Macarena and serves as a regional water recharge zone, allowing us to consider this reservoir as semi-confined. The information from wells, hydro geochemistry, and production in the various O&G fields suggests that the Une Formation in the southern part of the Llanos Basin is characterized as a very active hydrodynamically aquifer, constituting a regional carrier bed. This regional carrier bed condition seems to affect the distribution of isotherms in the southern part of the basin, developing zones of thermal advance and retreat (Figure 10). It is yet to be confirmed if the fault system affecting the Crystalline Basement and the Paleozoic sediments reach the Une Formation in the southern part of the basin, increasing their potential to obtain fluids with higher temperatures. The map of extractable energy distribution in the Une Formation suggests that the Play B area (5,912 km2) can reach 9.47x10¹⁹ Joules, theoretically equivalent to 7.13 GWe extractable (see methodology for heat to power generation potential conversion). This play can be considered emergent, as the reservoir has been drilled, with reservoir temperatures above 110ºC, surface water production with temperatures above 100ºC (Guatiquia and Apiay oil fields) and flow rates above 20,000 BWPD.
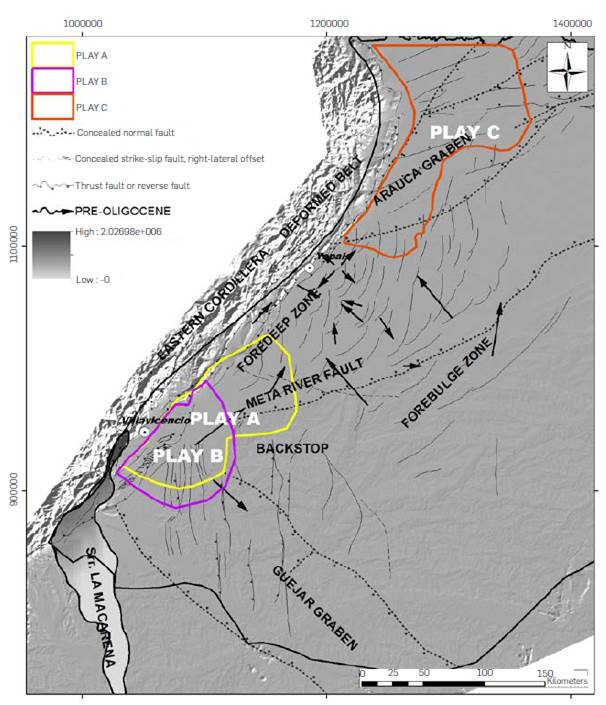
Figure 21 Location map of proposed plays (A bounded by the polygon with yellow thick line, B bounded by the polygon with blue thick line and C bounded by the polygon with red thick line), from the integrated analysis of the distribution of reservoirs (Crystalline Basement, Paleozoic sediments and Une Formation), temperature hydrogeology and hydrochemistry. Plays A and B are controlled by the fault density and the water flow derived from the recharge zone located along the Serranía de la Macarena and the high hydraulic heat. Play C its controlled mainly by diagenetic water flow and depth of the aquifers.
A third geothermal play (Play C), is composed by siliciclastic reservoirs, corresponding to the Une Formation, with primary porosity higher than 10% and temperatures above 100ºC, at depths greater than 3 km (Figures 10, 16, 21 and 22). This play is situated in the central and northern part of the basin, where deep aquifers such as the Une Formation are structurally disconnected from surface recharge zones (confined aquifers). A large volume of the water extracted from these confined aquifer’s is the result of diagenetic processes, as well as upward plumes of deeper water (Paleozoic or deeper levels), through fault systems (Figures 13, 21 and 22). Despite being the same reservoir as Play B, Play C is a confined aquifer, which recharge comes from formation waters, contrasting with Play B, which aquifer is semi-confined, having a strong hydraulic gradient due to surface recharge. In the zone of Play C, the thermal structure is dilated compared to the southern part of the basin (Play B), given the effects of the high sedimentation rate during the Mio-Pliocene. The map of extractable energy distribution in the Une Formation suggests that the Play C area (12,454 km2), can reach 4.14x10²⁰ Joules, theoretically equivalent to 31.17 GWe extractable (see methodology for heat to power generation potential conversion). This play can be considered proven, as the reservoir overlying the Une Formation has been drilled, with temperatures above 110ºC, surface water production with temperatures above 80ºC (Guatiquia and Apiay wells), and production of energy from installed ORC power plant near to 100 KWh [107].
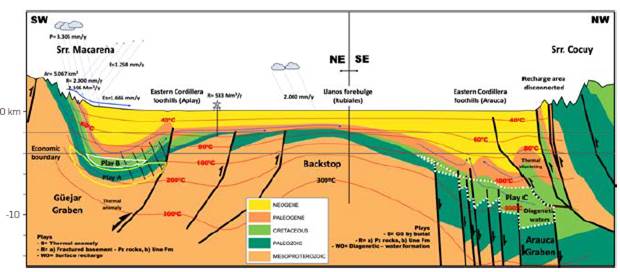
Figure 22 Conceptual hydrogeological model for the area between the Eastern Cordillera foothills Llanos Basin. Note the connectivity of the crystalline basement, Paleozoic and Une Fm. with the recharge zone of the southern Eastern Cordillera foothills - Serranía de la Macarena on the left, the contracted thermal structure and the subsurface flow lines, showing the passage of surface waters through the zone of higher temperature and its displacement towards the Rubiales area (center of the image). Along the Eastern Cordillera foothills and southern Llanos Basin, the configured play would be related to fractured Crystalline Basement and Paleozoic metasedimentary reservoirs (Play A: Yellow polygon) and Une Fm. (Play B: White Polygon) with porosities >10%. The northern Eastern Cordillera foothills (right part of the image), shows complete disconnection between the aquifers of the lying block and those exposed in the hanging block in the Arauca area, water input mainly by diagenesis and thermal structure dilated by rapid sedimentary rates during the Neogene - Quaternary. The play in these areas (Play C: Doted white line polygon) would be related to Une Fm. reservoirs, with porosities >10% and depths between 4 km and 10 km with temperatures above 100ºC. Ar: Recharge Area; R: Recharge; E: Evapotranspiration; Es: Runoff; Ew: Extracted by coproduction waters; WO: Water Origin; S: Source of heat.
CONCLUSIONS
The information acquired by oil companies in the sedimentary basins of Colombia could allow to reduce the geothermal exploration risk to a moderate range, reducing investments in exploratory phases, and defining places with suitable properties for the exploitation of the resource. The accumulation of information available for the Llanos Basin made it possible to estimate a geothermal potential in deep aquifers (Crystalline Basement, Paleozoic sediments, and Une Formation), by the volumetric method. A recovery factor of 5% was used to calculate the amount of recoverable energy at the surface that could be used to generate electricity.
The geothermal gradient and isotherm maps built for the Llanos Basin suggest that there is a clear influence of the basement cortical structure (grabens and horst distribution) on the thermal structure of the area, together with the differential sedimentary rhythms developed along the Llanos foothills from the middle Miocene to the Quaternary. Additionally, differential sedimentation rates along the foredeep zone during the Cenozoic generated a blanketing effect on the original geothermal structure.
The presence of regional hydraulic heads with strong gradient, as well as the hydrogeochemical information, suggest that the Une Formation behaves as a semi-confined aquifer in the southern part of the Llanos Basin. It is not possible to establish from the available data whether this behavior can be extended to the Crystalline Basement and Paleozoic sedimentary rocks. The strong hydraulic gradient seems to affect the distribution of isotherms in the deep aquifers, producing regional scale thermal advance and retreat zones.
The integration of the regional geothermal corridors constructed for the aquifers at the top of the Crystalline Basement, Paleozoic sediments, and Une Formation, to the regional hydrogeological and hydrogeochemical patterns, suggest the presence of three regional geothermal plays, which have been denominated in this paper plays A, B and C.
Play A is the deepest, composed by Crystalline Basement and Paleozoic sediments rocks, where porosity is given by natural fracture systems. It is interpreted as a semi-confined aquifer, very active hydrodynamically. The extractable heat potential in the play area (8,854 km2) can reach 4.11x10²¹ Joules, theoretically equivalent to 310 GWe (assuming 20 years- production, 95% production efficiency, and 5% of heat recovery to surface). This play can be considered hypothetical, as the basement in the southwestern part of the basin has not been drilled, and water production has not been tested.
Play B is composed by the Une Formation, with primary porosity greater than 10%, and temperatures between 80 and 100ºC.
Its reservoir behaves as a semi -confined regional aquifer, hydrodynamically active. The map of extractable energy distribution in the Une Formation suggests that the Play B area (5,912 km2), can reach 9.47x10¹⁹ Joules, theoretically equivalent to 7.13 GWe extractable on surface. This play can be considered emergent, as the reservoir has been drilled, with reservoir temperatures above 110ºC, surface water production with temperatures above 100ºC (Guatiquia and Apiay fields), and flow rates above 20,000 BWPD.
Play C shares the same reservoir as Play B, but hydrodynamically corresponds to a confined aquifer, fed by formation waters. In this play, fracture systems allow communicating waters from deep reservoirs, generating upward currents, with higher caloric contribution. The map of extractable energy distribution in the Une Formation suggests that the Play C area (12,454 km2) can reach 4,14x10²⁰ Joules, theoretically equivalent to 31.17 GWe extractable on surface. This play can be considered proven, as the reservoir overlying the Une Formation has been drilled, with temperatures above 110ºC, surface water production with temperatures above 80ºC (Guatiquia and Apiay fields), and energy production by Organic Cycle Rankine method of 100 KWh.

