


 English (pdf)
 Article in xml format
 Article references
 Send this article by e-mail
 Cited by SciELO
  Cited by Google
  Similars in
SciELO
Similars in
SciELO  Similars in Google
 Permalink
Introduction
Competitiveness in World retail has always been very strong and Brazilian retail is no different. This competitiveness reflects in the profit margin and data presented by the Paulista Supermarkets Association (PSA, 2016) demonstrate low profitability of the sector, which is approximately 1.8%. For this reason, the search for alternatives that allow the retailer to create new sources of income to leverage net profit becomes relevant.
On the other hand, even with a low profit margin, the large representation of retail grocery in Brazilian trade gives this sector a series of responsibilities in addition to its important role in the movement of sustainability, environmental education and awareness of a less exaggerated consumption. These responsibilities require constant innovation in their managers regarding acting and thinking about the organization in environmental and social areas (Szczesny et al., 2008; Bahn and Boyd, 2014; Winandy and Gallardo, 2014).
The adoption of reverse logistics practice recalls products such as cardboard and plastic in the production chain and has been proven to be a new source of financial revenue. In this way, some factors encourage the adoption of this practice in the retail sector, such as reduced availability, the cost of cardboard and plastic used by other sectors of the economy, the concern of the population regarding the preservation of the environment and the idea of reducing the waste of materials that can be reused in the production process (Dias and Braga Junior, 2015; Kumar, Sunder and Sharma, 2015).
Considering these findings, reverse logistics appears as a profit opportunity for the sector. The reuse of materials that would be discarded by groceries will generate economic, environmental and social benefits. Thus, the retail sector gains new opportunities, for example, the commitment to reduce the generation of garbage and the recycling and reuse of materials that would be discarded. This makes the retail grocery an important intermediary in other chains that, until then, were not part of its scope of action and that enhance its image as an environmentally correct company (Ganesan, George, Jap, Palmatier and Weitz, 2009; Dias and Braga Junior, 2015; Dias, Junior and Martinez, 2016).
Knowing the environmental and social benefits of using reverse logistics, the economic benefit ends up being increased by not requiring significant investments for the retailer to carry out the process of separation, storage and sale of the cardboard and plastic that would be discarded. Therefore, the research problem that guides the present work is expressed by the following question: How does the implementation of reverse logistics contribute to the increase in retail grocery´s profit?
Guided by this question, the objective of this research was to analyze the financial result achieved with the practice of reverse logistics of cardboard and plastic. A case study was carried out in a grocery network in the State of São Paulo, Brazil, which consists of 22 stores.
In this study, we obtained the values invested for the implementation of the process, the costs and expenses of maintenance and, finally, the revenue achieved with the reverse logistics of cardboard and plastic, since these, waste large volume generated in retail.
As a result, it was possible to observe that the grocery corporation increased its net profit with the practice of reverse logistics in a value proportional to the net profit generated by two groceries with revenue of 600 thousand dollars. It was concluded that the implementation of reverse logistics was satisfactory, generated as well environmental benefits resulting from waste reduction, and contributed to the generation of direct and indirect jobs created by business growth.
Theoretical Discussion
Retail is a part of the distribution channel and the main intermediary between industry and the final consumer. Thus, it can be defined as “all activities that include the process of selling products and services for a personal need of the final consumer” (Levy and Weitz, 2000; Parente, 2000). Historically, retail originated from informal sales taking place on city streets and evolved into stores and emporiums that sold durable and nondurable products. Since the Industrial Revolution, with the growth of industry and the creation of standardized products, commercial establishments have grown, thus resulting in large self-service markets.
For Levy and Weitz (2000), retail is divided into the selling of general goods and the selling of services, and the supermarkets are inserted in the food retailing category. Some authors such as Parente (2000), Levy and Weitz (2000) classified grocery retails as self-service systems relying on a variety of between 4,000 and 14,000 products, including food and nonfood items, with at least two checkouts and a sales floor area between 300 m² and 5,000 m². Supermarkets consist of sections, such as grocery, butcher, cleaning products, and provide carts and baskets to consumers without requiring the presence of a seller. Another important feature of this sector is high turnover of products with low profit margins (Kumar, Sunder and Sharma, 2015).
Over time, the grocery retail has undergone several changes. According to Parente and Gelman (2009), these changes have occurred mainly because of the influence of society, which is increasingly aware of the scarcity of natural resources. Thus, the protection of the environment shall be the focus of attention in companies operating in retail, from a socially responsible position. Retailers are now assuming a new role: committing to the reduction of waste generation, recycling, and reuse; and creating the effect of increasing their responsibility to the final consumer (Dekimpe, Gielens, Raju and Thomas, 2011; Dias and Braga Junior, 2015; Janakiraman, Syrdal and Freling, 2016).
Among the environmentally correct actions carried out by companies in the grocery retail segment are the use of recyclable packaging, encouragement of the practice of selective waste collection, and prevention of wasting natural resources such as water and electricity (Dekimpe et al, 2011).
In fact, grocery retails are increasing their accountability to the consumer’s concern for the environment. Companies that adopt environmentally friendly practices are recognized by the consumer, thus creating a competitive advantage in the marketplace. Another result of these actions for retailers that operate in the supermarket area is increased business profitability, which thus generates economic benefits.
To achieve greater corporate profits and market share, in the face of an extremely competitive environment, organizations seek to establish integration relationships with partners, suppliers and distributors to optimize their performance and gain competitive advantage. According to Zailani et al. (2015), the competitive level of an organization is closely related to its capacity for efficient interaction with the supply chain that it belongs to, since, as Ellram and Cooper (2014) argue, competitive advantage can be achieved through better use of internal and external resources and capabilities to meet the needs of consumers.
This integration, given by a supply chain, assists in the management of all activities involved in the production of consumer goods, such as the selection of raw materials, processing, and logistics activities, both integrated and reverse (Subramoniam et al., 2009). Specifically, reverse logistics allows products and packaging to be reinserted in the production cycle (Silva et al, 2013; Dias, Junior and Martinez, 2016). Marchesini and Alcântara (2016) show that the logistics activities developed in the returns management are to develop a reverse logistics network; to identify logistics activities that can help avoid discards; to define logistics procedures to meet the return flow, including collection routes; to provide information on the costs of reverse logistics for the different disposal options (recycling, remanufacturing or use by secondary markets); and to operate the return cycle (receiving the return request, selecting the disposal option, determining the route and receiving the returns).
Reverse logistics, as well as integrated business logistics, is part of the supply chain management. Integrated logistics is responsible for dealing with the direct distribution flows of produced goods (Agrawal et al., 2016), while reverse logistics (also known as green logistics) is the planning of reverse flow of products and packaging, starting from the consumption point to the origin point (Tibben-Lembke, 1998).
According to Gurnani, Sharma and Grewal (2010), reverse logistics covers the returns of post-sale and post-consumer products to the business cycle or to the production cycle through the reverse distribution channel. In this sense, post-sales reverse logistics are related to products that, after being sold, return for some reason, such as shipping error, while post-consumption reverse logistics is related to products that have already been consumed, which can be destined to landfills or be recycled (Gurnani, Sharma and Grewal, 2010; Cruz et al., 2013). It should be emphasized that both products and packaging can be destined for recycling processes or disposed of in landfills, or even discarded incorrectly in nature.
The efficiency and results of reverse logistics applications can be perceived by gains in advantages in the following areas: (i) economic, due to the use of recycled raw material for the manufacture of new products, which generates a reduction of costs in the processes in addition to being a source of alternative income obtained through the sale of the materials; (ii) environmental, reducing the disposal of solid waste in the environment and mitigating environmental impacts; (iii) social, with the generation of jobs (direct and indirect) and income and by offering better living conditions to the population (Braga Junior et al., 2009; Hernández et al., 2012; Dias and Braga Junior, 2015); and (iv) competitiveness, through all the above factors (Tibben-Lembke, 1998).
The main factors that lead organizations to operate in reverse logistics are 1) environmental legislation, 2) economic benefits obtained, and 3) the growing environmental awareness of consumers. In addition, Rogers and Tibben-Lembke (1999) still note other reasons: 1) competitive reasons, 2) cleaning the distribution channel, 3) profit margin protection and 4) recapture of value and recovery of assets.
According to Bernon et al. (2011), reverse logistics can bring economic benefits because recycled products have a significantly lower value compared to the original item's cost. In this respect, some companies in Germany use the reverse logistics model to maximize their profits by selling recyclable materials, thus generating a financial return to the organization (Reyes and Meade, 2006; Bahn and Boyd, 2014).
Braga Junior et al. (2009) analyze the reverse logistics in the grocery sector as consisting of four main elements: industry, retail, final consumer and the secondary market (represented by recycling companies). These elements interact with each other through buying and selling operations, where retailers buy ready-made products from the industry and resell them to the final consumer. The reverse flow starts with the consumer, who passes the packaging to the retailer that sells it to the secondary market, which, in turn, sells the recycled material to the industry, thereby restarting the cycle (Jakhar, 2015).
In the case of this research, the final consumer is not inserted in the reverse flow, since this is done by groceries, where the first packaging is removed before the products are placed on the shelves for resale to the consumer.
Therefore, through the adoption of reverse logistics practices, the sector can obtain competitiveness and optimize its performance due to the great representation of the retail sector and its role in social, environmental and economic responsibility.
Methodology
This research aims to analyze the processes, data and financial results achieved through reverse logistics applied by a grocery network. Thus, to achieve the proposed objective, research will be conducted using a case study (Yin, 2015) of exploratory, descriptive and documentary characteristics. Such a case study was conducted with 22 groceries belonging to a grocery network whose stores are distributed in the State of São Paulo.
The exploratory research of a qualitative nature was oriented to develop a theoretical basis through a bibliographical revision in relation to supply chain, reverse logistics and the retail grocery sector. In addition, a participant observation was made in the data collection process, seeking to identify the positive and negative aspects of the practice of reverse logistics (Aaker et al., 2004).
For the financial analysis, data were collected on the investment made by the grocery network for the implementation of reverse logistics and the costs for the operation of the process through the sales reports of the cardboard and plastic.
The financial reports analyzed were as follows:
Management control of materials input;
Management control of materials output;
Invoice material output.
Regarding the analysis of the investment for the implementation of the process of press and storage of cardboard and plastic, data were raised from the following:
Purchase of equipment for the processing of cardboard and plastic;
Leasing space for cardboard and plastic processing.
For the maintenance of processing, the following costs were considered:
Payment and expenses of employees assigned to the process;
Costs related to processing (energy, water, etc.)
Based on these data and information, an IRR (internal rate of return) and NPV (net present value) analysis was also performed, as well as a result statement on the activities involving cardboard and plastic processing.
The data presented in the case analysis followed a proportionality of the actual data so as not to harm the results presented in the work. This process was used to preserve the identity of the grocery network and the confidentiality of the information and data made available for the research.
Results
Company Characterization
According to Parente (2000), considering the number of checkouts and the size of the sales area, the grocery network under study is formed by 22 stores classified as medium and large. These stores are in 20 different cities in a radius of approximately 250 km from its head store.
This geographic positioning contributed to the creation of a distribution center (DC) centralized in the city of the head store and strengthened the management model format by a distribution center that allows greater efficiency to the retailer because it concentrates the volume of purchases and reduces the cost of processing and storage (Braga Junior et al, 2009).
This centralization system has been adopted since July 2014, both for distribution logistics and reverse flow, since in the distribution process, in 90% of the return trips, the trucks returned empty. With the processing of the cardboard and the plastic being carried out in the distribution center, the return trips to the DC started to be better utilized, known as the return load. Prior to this centralization process, each grocery in the network made the destination of these products in the way it believed to be the most appropriate.
Currently, all material generated by the 22 stores is transported to the distribution center through trucks that perform the internal logistics of the network, and thus, the material is pressed and weighed. The bundle of pressed plastic weighs approximately 350 kg, and the cardboard weighs approximately 250 kg, depending on the percentage of moisture it has.
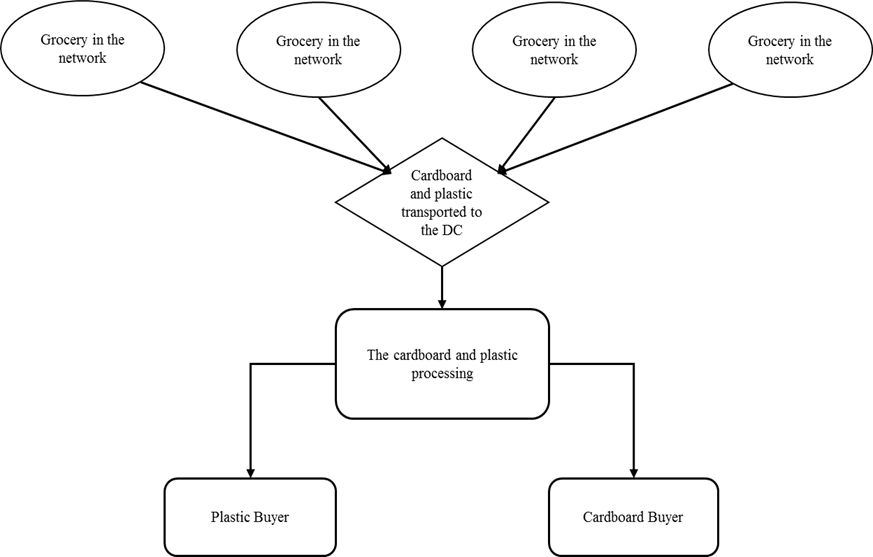
The cardboard is sold to the company SONOCO Inc., and the plastic is sold to the company that distributes materials of this type to the grocery store, in the form of garbage bags and bags. Because of the large volume of cardboard, the buyer company withdraws the material once a week. However, the loads are shipped with less frequency for plastics. Thus, these partner companies are responsible for determining the destination of the collected materials. The accomplishment of the input, storage and sale process of cardboard and plastic in the store is demonstrated by Figure 1.
The network distribution center is located at coordinates 22°38'59.34 "S and 50°26'02.31" W and occupies 10,600 m², with 5,800 m² (54.7%) of covered area and 4,800 m² (45.3%) of open area.
This distribution is within the recommendations for the retail grocery sector proposed by Silva (2014). For the processing of cardboard and plastic, 60 m2 of the covered area and 190 m2 of the open area were separated out, representing, respectively, 1% of the covered area and 4% of the open area.
Financial Advantages
The calculation of the investment required for the centralization of the process was based on the cost per m² of DC, which is approximately US$ 187.50 (Silva, 2014). In this way, the area that is reserved for processing has an approximate cost of US$ 46,875.00 (US$ 187.50 multiplied by 250 m²), and its use must provide at least a return of US$ 468.75 (1% of the nominal value of the leased property). In addition to the area required for processing, there was a need to invest in equipment, and the total cost of investment is presented in Table 1.
Considering the investment values presented in Table 1, the NPV and IRR values were calculated to analyze the viability of centralization of the cardboard and plastic processing in the network distribution center considering the expected values of the cash flow that can be provided, which is presented in Table 2
The estimated average revenue was based on the average volume of cardboard generated by the network (80,000 kg) at the sale value of US$ 0.13 and the plastic (5,000 kg) at the value of US$ 0.63. The cost is related to workforce, to the area rentals and to process maintenance.
Table 1 Investment for Implementation of Reverse Logistics.
| Description | Qty. | Value | Total |
|---|---|---|---|
| Area Rentals | 1 | $ 468.75 | $ 468.75 |
| 12 Ton Baler Press | 2 | $ 10,937.50 | $ 21,875.00 |
| Hand pallet truck 2200 kg | 1 | $ 312.50 | $ 312.50 |
| Space Suitability | 1 | $ 468.75 | $ 468.75 |
Fuente: Authors.
Table 2 Expected cash flow.
| Period | ||||||
| P1 | P2 | P3 | P4 | P5 | P6 | |
| Expected Average Revenue | $13,125 | $13,125 | $13,125 | $13,125 | $13,125 | $13,125 |
| Cost | - $781 | - $781 | - $781 | - $781 | - $781.00 | - $781 |
| Expense | - $313 | - $313 | - $313 | - $313 | - $313.00 | - $313 |
| Machines and Equipment | - $22,656 | 0 | 0 | 0 | 0 | 0 |
| Result | - $11,094 | $12,031 | $12,031 | $12,031 | $12,031 | $12,031 |
Fuente: Authors.
The calculations were based Hillier et al (2010) on the NPV formula (eq. 1) and based on the estimated data; the results obtained were as follows: an IRR of 17.81% per month for the estimated period and an NPV of US$ 16,386.00, considering the expectation of 6 months for investment and an expected rate of return of 5% per month.
 (1)
(1)Considering the feasibility of the investment, the cardboard and plastic processing was implemented in the network distribution center, and the results from the period from July/14 to June/16 are presented in Table 3.
Regarding the values that occurred and discounting the costs and expenses to carry out the process, the average monthly result was approximately US$ 14,000.00. This result represents the equivalent of the net profit of two groceries in the network, with revenues of approximately US$ 600,000.00.
Final Consideration
By analyzing and comparing the results achieved by the grocery network during the 24-month period, it was possible to identify the implementation effects of the collection and the processing of cardboard and plastic. One of the main effects observed was the new point of view of the group on environmental management in the retail sector and the practices of reverse logistics process for these products. However, the main factor that encouraged the company to adopt the reverse logistics process of cardboard and plastic was the financial question, that is, the financial return that this activity could provide.
Table 3 Results achieved.
| Period | Total of Plastic (kg) | Plastic Unit Price | Total of Cardboard (kg) | Cardboard Unit Price | Total revenue |
|---|---|---|---|---|---|
| Jul/14 | 0.0 | $ - | 69,110.00 | $ 0.13 | $ 8,638.75 |
| Aug/14 | 0.0 | $ - | 25,860.00 | $ 0.11 | $ 2,828.44 |
| Sep/14 | 0.0 | $ - | 56,340.00 | $ 0.14 | $ 7,922.81 |
| Oct/14 | 10,420.0 | $ 0.63 | 111,860.00 | $ 0.14 | $ 22,242.81 |
| Nov/14 | 6,330.0 | $ 0.75 | 82,040.00 | $ 0.14 | $ 16,028.00 |
| Dec/14 | 4,920.0 | $ 0.75 | 85,130.00 | $ 0.13 | $ 15,129.34 |
| Jan/15 | 17,843.0 | $ 0.75 | 138,878.00 | $ 0.13 | $ 32,043.98 |
| Feb/15 | 0.0 | $ - | 74,580.00 | $ 0.13 | $ 9,322.50 |
| Mar/15 | 20,940.0 | $ 0.75 | 130,304.00 | $ 0.13 | $ 31,993.00 |
| Apr/15 | 0.0 | $ - | 92,000.00 | $ 0.13 | $ 11,500.00 |
| May/15 | 0.0 | $ - | 88,200.00 | $ 0.13 | $ 11,025.00 |
| Jun/15 | 0.0 | $ - | 95,300.00 | $ 0.13 | $ 12,210.31 |
| Jul/15 | 0.0 | $ - | 72,220.00 | $ 0.13 | $ 9,253.19 |
| Aug/15 | 0.0 | $ - | 26,980.00 | $ 0.13 | $ 3,372.50 |
| Sep/15 | 0.0 | $ - | 58,530.00 | $ 0.13 | $ 7,316.25 |
| Oct/15 | 0.0 | $ - | 120,790.00 | $ 0.13 | $ 15,098.75 |
| Nov/15 | 9,840.0 | $ 0.66 | 111,500.00 | $ 0.13 | $ 21,091.88 |
| Dec/15 | 0.0 | $ - | 134,700.00 | $ 0.13 | $ 17,679.38 |
| Jan/16 | 12,578.0 | $ 0.66 | 98,380.00 | $ 0.13 | $ 21,166.69 |
| Feb/16 | 9,650.0 | $ 0.70 | 102,000.00 | $ 0.13 | $ 20,172.66 |
| Mar/16 | 10,609.0 | $ 0.66 | 99,460.00 | $ 0.14 | $ 20,948.72 |
| Apr/16 | 9,509.0 | $ 0.69 | 99,220.00 | $ 0.14 | $ 20,490.25 |
| May/16 | 0.0 | $ - | 86,200.00 | $ 0.14 | $ 12,121.88 |
| Jun/16 | 13,423.0 | $ 0.66 | 98,500.00 | $ 0.15 | $ 23,583.84 |
| TOTAL | 126,062.0 | 2,158,082.00 | $ 373,180.92 |
Fuente: Authors.
In this sense, the results obtained presented a good representation in relation to the net profit that the retail grocery can provide in Brazil. Another aspect that draws attention is the management of the process for reverse logistics that is structured independently of the management of the network stores. This may also be one of the factors that provides the results presented in this research.
In addition, another point to be considered is the importance of environmental management through reverse logistics as a strategic retail tool. However, some aspects need to be considered for environmental management through reverse logistics to fit this profile.
First, the use of the reverse logistics potential is conditioned to the strategic decisions of the company. In this sense, management must take the initiative to exploit opportunities as a way of leveraging other results in the use of these resources.
Second, it is also necessary that the reverse logistics process be conducted in a way that ensures synergy of decisions, that is, the decisions taken in its scope must be in line with the company's business logistics decisions and other decisions in general.
Finally, one limitation of the present research is the fact that it was not possible to compare the results with the financial indicators of the network, and it is possible to only affirm that the financial result provided is equivalent to the financial result of two groceries stores with revenues of approximately US$ 600,000.00.
As a suggestion, which is increasingly reinforced by the aspects observed and the implications for the company when it seeks sustainability, the retailer's role in the retail reverse logistics chain should be viewed as an active part of the company's business, as it can generate financial, social and environmental gains.

