


Services on Demand
Journal
Article
 English (pdf)
 Article in xml format
 Article references
 Send this article by e-mail
Indicators
-
 Cited by SciELO
 -
 Access statistics
Related links
-
 Cited by Google
 -
 Similars in
SciELO
Similars in
SciELO -
 Similars in Google
Share

 Permalink
Earth Sciences Research Journal
Print version ISSN 1794-6190
Earth Sci. Res. J. vol.17 no.2 Bogotá July/Dec. 2013
HYDROGEOLOGY
Groundwater potential zonation by Remote Sensing and GIS techniques and its relation to the Groundwater level in the Coastal part of the Arani and Koratalai River Basin, Southern India
S Suganthi1, L Elango2 and S K Subramanian3
1 Department of Geology, Anna University, India
2 Department of Geology, Anna University, India
3 National Remote Sensing Centre, Hyderabad, India
Manuscript received: 17/10/2012
Accepted for publication: 26/11/2013
ABSTRACT
Groundwater is being pumped extensively from the coastal part of the Arani and Koratalai River Basin, Tamil Nadu, India for irrigation and water supply to the city of Chennai. The objective of this study is to delineate the groundwater potential zones of this area using Remote Sensing (RS) and Geographic Information System (GIS) techniques. Weighted overlay analysis was used to demarcate the ground- water potential zones. Various thematic layers such as geology, geomorphology, soil, lineament density, drainage density, rainfall and landuse maps were prepared. The geological map was prepared using a Geological Survey of India (GSI) district resource map. Indian Remote Sensing System Linear Imaging Self-scanning Sensor III (IRS-1D LISS III) satellite imagery was used to prepare the geomorphology, soil, lineament density, drainage density, and landuse maps. The final groundwater potential map was prepared by assigning appropriate weightage to different thematic maps and adding them to the final groundwater potential map. The derived groundwater potential map was overlaid with the groundwater level and location of well fields for validation. The map prepared will help in systematic and proper development of groundwater resources in this area to meet the growing water requirements of the city of Chennai.
Key words: IRS-ID LISS III satellite imagery, paleochannels, overlay analysis, potential zones, groundwater level, Chennai, well fields.
RESUMEN
Aguas subterráneas se bombean en gran cantidad desde la parte costera en las cuencas de los ríos Arani, en Tamil Nadu, India, para el riego y el aprovisionamiento de agua a la ciudad de Chennai. El objetivo de este estudio es delinear las zonas potenciales de aguas subterráneas en esta área a través de sistemas de Teledeteción (RS) y de Información Geográfica (GIS). Se hizo un análisis sobrepuesto compensado para demarcar las zonas con posibilidad de tener aguas subterráneas. Se prepararon mapas de uso de la tierra con varios elementos temáticos como geología, geomorfología, terreno, densidad de lineamiento, densi- dad de drenaje y precipitación. El mapa geológico fue preparado a partir del Mapa Distrital de Recursos, del Servicio Geológico de la India (GSI). Fueron utilizadas imágenes satelitales Sensing System Linear Imaging Self-scanning Sensor III (IRS-1D LISS III) para definir la geomorfología, terreno, densidad de lineamientos, densidad de drenaje y mapas de uso del terreno. El mapa final de zonas potenciales de aguas subterráneas se preparó con la superposición apropiada de diferentes mapas temáticos sobre los mapas de aguas subterráneas potenciales. Para la validación apropiada, el mapa derivado se solapó con los de niveles de aguas subterráneas y de zonas de pozos. El mapa preparado ayudará en el desarrollo sistemático y apropiado de las fuentes hídricas subterráneas en esta área que permita abastecer la creciente demanda de agua de la ciudad de Chennai.
Palabras clave: atributos sísmicos, inversión sísmica, indicador de zona de flujo, índice de calidad de depósito, unidad de flujo hidráulico, redes neuronales probabilísticas.
Introduction
Groundwater is the largest fresh water resource on the Earth, which makes it an important source for human consumption and the overall development of a region. Mapping groundwater potential zones is essential for planning the location of new abstraction wells to meet the increasing demand for water. The occurrence, distribution, and movement of groundwater mainly depend upon the geological and hydro-geomorphological features of the area. A detailed study of groundwater occurrences can be made by surface and subsurface investigation methods. The groundwater potential zones and paleochannels were investigated using the geological and geophysical methods reported by Shirke et al. (2005) and Ariyo et al. (2011). However, these methods are based on extensive and time-consuming ground measurements that can be used only for large-scale mapping. The use of remotely sensed data along with Geographic Information System (GIS) is well suited, and it can be easily combined with the data generated from conventional and ground measurement systems.
Remote sensing and GIS possess new possibilities for hydrogeological studies (Thomas et al., 1999; Lokesh et al., 2007). High-resolution satellite imageries are widely used in groundwater studies due to their high spectral and spatial resolution. They are used to identify the geology, geomorphology, soil, lineament density, drainage density, rainfall and landuse for maps that indicate the occurrence of groundwater (Preeja et al., 2011). Rao et al. (2004) studied the integration of groundwater resources evaluation using the remote sensing method. The groundwater prospect evaluation by high-resolution satellite imageries was reported by Mondal et al. (2007). The overlay analysis by GIS technique was used to delineate the groundwater potential zone studied by Nag (1998); Sikdar et al., (2004); Prasad et al., (2008); Teixeira et al., (2008); Girish et al., (2008); Nagarajan and Singh (2009); and Sukumar and Sankar (2010).
Agricultural, industry and domestic water users in the north Chennai region depend upon the pumping of groundwater from the Arani and Koratalai river basin. In addition, groundwater from this region is also being pumped by Chennai Metropolitan Water Supply and Sewerage Board (CMWSSB) to supply water to the city of Chennai. In spite of the large-scale pumping of groundwater from this area, no attempt has been made to make use of remote sensing and GIS techniques to identify groundwater potential zones. Hence, the present study was carried out with the objective of mapping the spatial distribution of groundwater potential zones in the Arani and Koratalai river basin, which will assist in the proper development of groundwater resources in this area.
Descriptions of the study area
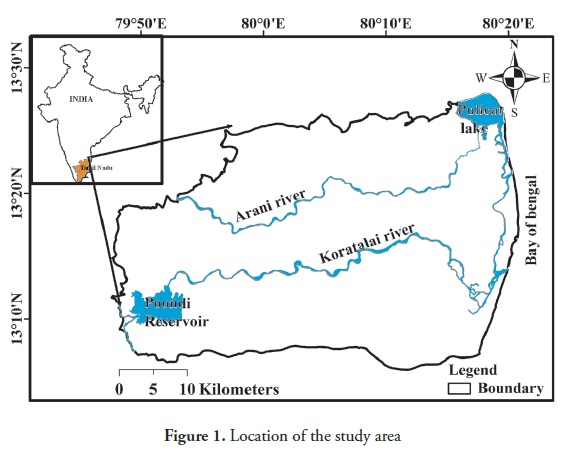
The study region (1792 km2) is bounded between the latitudes of 13°7'00"N and 13° 27' 00"N and longitudes of 79°47'30"E' and 80°20'00"E (Figure 1). The study area was demarcated based on the watershed divide in the northern and southern direction. As this study area is focusing only on the coastal part of the Arani and Koratalai river basin where groundwater is being pumped extensively, the state boundary to the west was considered the western boundary. Topographically, the study area slopes gently from east to west, with the exceptions of a few hillocks, and there is no appreciable change in the north to south direction. The highest elevation of approximately 90 m was observed in the hill areas located in the northwestern part to sea level in the east. The atmospheric temperature in this area ranges from 22 to 42 ºC. The average annual rainfall is approximately 1100 mm. Approximately 40% of the annual rainfall occurs during the south west monsoon season (July to September) and remaining 60% occurs during the north east monsoon season (October to December). The rivers in this region are non-perennial and a substantial quantity of water flow only occurs during the monsoon season. Groundwater is the major source of water for drinking and agriculture purposes when compared to surface water in this region. Agriculture is the main occupation for livelihood in this area, where rice, groundnut, sugarcane, pulses and banana are the most important crops. Dug wells are the major source for irrigation, followed by tanks and bore/tube wells.
Methodology
Indian Remote Sensing System Linear Imaging Self-scanning Sensor III (IRS-1D LISS III) satellite imagery (April 2006) was used to prepare the geomorphology, soil, lineament, drainage density and landuse maps. These maps were prepared at a 1:50,000 scale. The geological map was prepared using the Geological Survey of India (GSI; 2001, 2005) district resource map. The GIS analysis was carried out by using ArcGIS 9.3 (2007) of ESRI Inc. The drainage density and lineament density were prepared using the density analysis tool in the Arc GIS 9.3. The rainfall distribution map was prepared using rain gauge station data. The integration method of weighted overlay analysis was adopted to combine all thematic layers by assigning rank and weightage for each thematic layer. Weighted overlay analysis is a simple method to analyze multiclass maps based on the relative importance of each thematic layer and a layers class.
Several studies have reported the relative importance of various thematic layers that control the groundwater potential in an area. The weight for the selected thematic maps was based on Saaty's scale (1980). Suja and Krishnan (2009); Nag and Ghosh (2012); and Etishree et al. (2013) have suggested the weightages based on Saaty's (1980) scale for different thematic maps to delineate groundwater potential zones. In the present study, the weightages were assigned based on these studies. The individual layers and their classes are assigned a weightage and a rank ranging from 0.10 to 0.25 and 1 to 4, respectively. Higher weightage and ranks are given to the sites that are expected to have high groundwater potential. The thematic layers were then integrated by overlay analysis in the Arc GIS 9.3 environment.
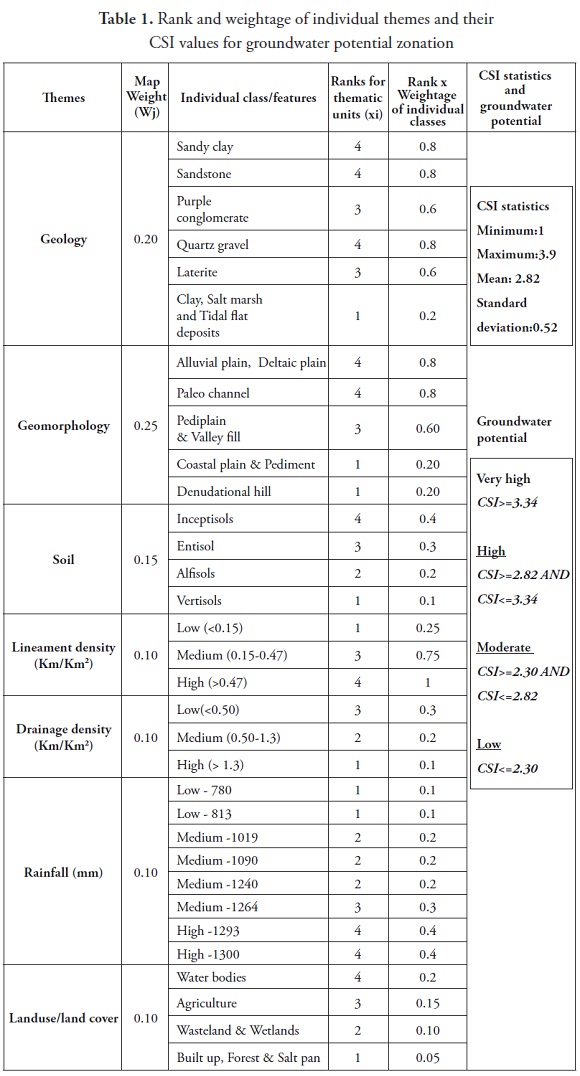
The groundwater potential zone was prepared by delineating the study area into four classes: very high, high, moderate and low. The Cumulative Score Index (CSI) was used for this classification. CSI was calculated by multiplying the rank and weightage of each thematic layer as expressed in the following equation.
CSI = ∑ (Geology rank x weight + Geomorphology rank x weight + Soil rank x weight, Lineament density rank x weight + Drainage density rank x weight + Rainfall rank x weight + Landuse rank x weight)
Where, Wj is the normalized weight of the jth factor; Xi is the rank of the ith classes/features of a thematic layer; m is the total number of thematic layers; and n is the total number of classes/features in a thematic layer (Deepesh et al., 2011; Rose and Krishnan 2009).
The mean and standard deviation of CSI was used to delineate the region as very high (>Mean+ Standard deviation), high (Mean to Mean+ Standard deviation), Moderate (Mean- Standard deviation to Mean) and low (<Mean - Standard deviation).
Results and discussion
Groundwater availability mainly depends on geology, geomorphology, soil, lineament density, drainage density, rainfall and landuse. Hence, all the thematic maps pertaining to the study area were prepared as per the methods explained earlier. The salient aspects of these thematic maps are described below.
Geology
Geology of the study area in Arani and Koratalai river basin, Chennai city and its surrounding is shown in (Figure 2). Geologically, the study area is underlined by formations ranging in age from Archean to recent. The central and coastal portions of the study area are dominated by sand and sandy clay, which are partly alluvial, marine and aeolian in origin. The southern portion has purple conglomerate and laterite, which contains small amounts of sandstones. The western parts are underlined by a thick pile of gondwana shale, clays and sandstones below the recent alluvial deposits. The southeastern portion of this area is covered by small patches of clay. Beyond the study area in the southern direction, charnockite, sandstone and shale are widely distributed. The unconsolidated quaternary alluvial formations up to the depth of 50 m from the ground surface consist of sand, sandy clay and clay. These alluvial deposits function as an aquifer system. Due to the presence of interlaying clay lenses in this formation the lower part function as a semi-confined aquifer. The upper parts of the quaternary alluvial formation function as an unconfined aquifer. The permeability in the lower part of the sequences is high compared to upper part. The hydraulic conductivity of the aquifer varies from 30 to 260 m/d and the specific yield from 0.15 to 0.18 (UNDP, 1987). The area with sand and sandy clay is a groundwater potential zone due to its high porosity and high permeability. A weightage of 0.20 was assigned for this layer.

Geomorphology
The identification of geomorphologic features is very important for demarcating groundwater potential. The hydro-geomorphological features of this area were mapped using IRS-ID LISS III satellite data. The major geomorphologic features are alluvial plain, paleochannels, pediments, pediplain, valley fill, coastal plain, deltaic plain and denudational hill (Figure 3). The four cycles of erosion gave rise to a complex assemblage of fluvial, estuarine and marine deposits in this area. Geomorphic evolution and morphostructural analysis of the area suggests neotectonic activity during the quaternary period, resulting in marine regression, large-scale changes and shifting of the course of major rivers (UNDP, 1987). This has resulted in burial of old river courses due to subsequent sedimentation, and these paleochannels would generally be considered potential reservoirs for groundwater (Samadder et al., 2011). The paleochannels of the study area were mapped using IRS LISS-III imagery based on the tonal difference. The Arani and Koratalai basin mostly comprises alluvial plains with paleochannels, which are expected to be zones with groundwater potential (Figure 3). This thematic layer is very important due to the presence of paleochannels and deltaic plains, which are potential zones for groundwater storage. Hence, a higher weightage of 0.25 was assigned to this layer.

Soil
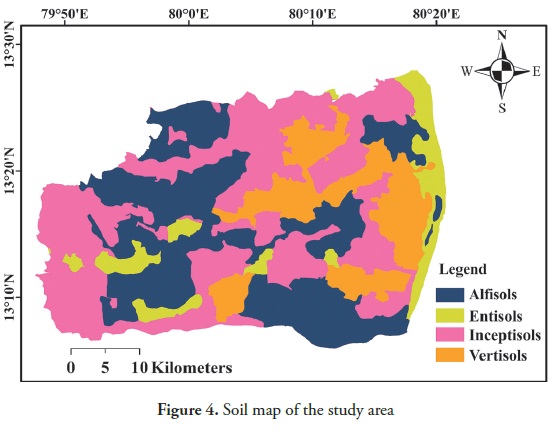
The soil map was prepared by using IRS-ID LISS III data with additional input derived from the district resource map. Four types of soils, i.e., entisols, inceptisols, alfisols and vertisols, are present in the study area. According to the United States Department of Agriculture (USDA, 1999) soil taxonomy, entisols of recent origin found in floodplains are delta deposits. Inceptisols are quite young soils and are found in steep slopes and flood plains. Alfisols are clay-enriched subsoils with relatively high fertility. Vertisols are dark black soils that are rich in expandable clay minerals that readily swell upon wetting and shrink when dried. This type of soil is suitable for rice cultivation due to the low permeability when saturated. The areal distribution of these soils in the study area indicates that the inceptisols are widely distributed (Figure 4). The inceptisols and entisols have a high infiltration rate due to the presence of sand and gravel. As vertisols and alfisols contain clays, the infiltration rate in these soils is less. Hence, regions consisting of inceptisols and entisols were given high ranks, and a 0.15 weightage was assigned to this layer.
Lineament density
The lineaments are straight, long, linear features that are enhanced by the permeability of the terrain, which is developed by tectonic activity. The lineaments are usually associated with a linear vegetative pattern, straight drainage course, ridge topography, etc. In general, lineament controls groundwater movement and storage. The lineaments present in the study area were derived from the IRS-ID LISS III satellite imagery. Most of the lineaments are in the central part of the study area, and most are associated with straight drainage courses as shown in Figure 5. The lineament length varies from a few meters to kilometers, and lineaments trend from northeast to southwest. The lineament density was determined from the density analysis tool in the ARC GIS 9.3 environment. The region was classified into three categories, low (0.00-0.15 km/km2), medium (0.15-0.47 km/km2) and high (>0.47 km/km2). The zones with very high lineament density were classified as high groundwater potential and assigned a weightage of 0.10.

Drainage density
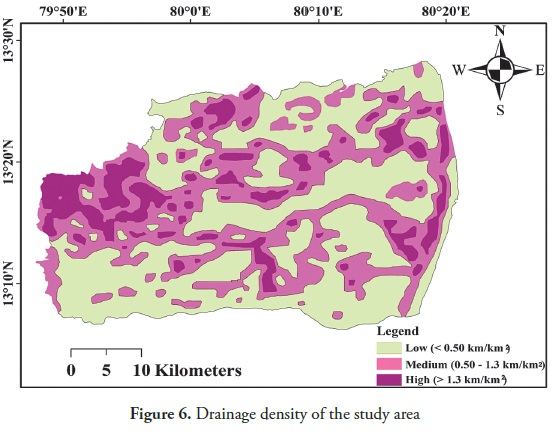
Drainage density helps to assess and understand the characteristics of runoff and groundwater infiltration in this area. Drainage density (total length of drainage channels per unit area) values were calculated using the natural break method (Jenks, 1967). The regions were classified as low (< 0.50 km/km2), medium (0.50-1.3 km/km2) and high (> 1.3 km/km2) drainage density zones, as shown in Figure 6. Areas with low drainage density indicate comparatively higher infiltration and low runoff. The zones with low to moderate drainage density are considered excellent groundwater potential zones and were assigned a weightage of 0.10.
Rainfall
Rainfall is a primary source of water for groundwater recharge in this area. The Theissen polygon method was used to derive the rainfall distribution map. Based on the rainfall, the region was classified into eight zones, as shown in Figure 7. The central and southwestern parts of the study region receive comparatively more rainfall. The northern part receives the lowest amount of rainfall. The highest mean annual rainfall of 1300 mm was observed in the southern part of the study area. Receiving more rainfall is favorable for the presence of more groundwater. This layer was assigned a weightage of 0.10.

Landuse/Land cover
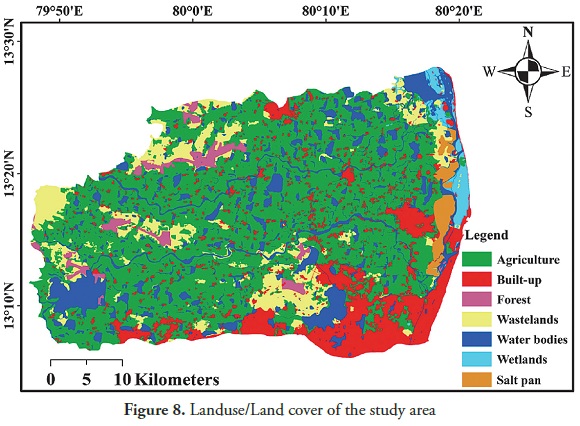
The landuse and land cover map was prepared from the IRS- ID LISS III satellite data using ENVI 4.7 software with supervised classification, as shown in Figure 8. Landuse/Land cover patterns provide information about infiltration and runoff, which are controlled by the nature of surface material. Landuse patterns such as built-up, forest, agriculture, wasteland, wet land and salt pans were identified. Agriculture is the main occupation in this area. For the landuse/land cover map, a weightage of 0.10 was assigned.
Groundwater potential map
The relative importance of various thematic layers and their corresponding classes were used for generating the groundwater potential zone map. The rank and weightage of individual thematic layers and the mean and standard deviation of CSI for arriving at the groundwater potential map are given in Table 1. The groundwater potential zonation map prepared by this method is shown in Figure 9. The study area was classified into very high, high, moderate and low groundwater potential zones. Very high (15.70%) and high (43.15%) groundwater potential zones contain geologic units of quartz gravel, purple conglomerate, sandstone, sand and sandy clay; geomorphological units of alluvial plain, deltaic plain, paleochannels and valley fills; high lineament density; soil units of inceptisols and entisols; low drainage density; and high mean annual rainfall. The moderate potential zone (25.33%) is dominated by geologic units of laterite, geomorphic units such as pediments, pediplain, coastal plains, soil units of entisols, medium lineament and drainage density. A low (15.01%) potential zone is present mainly in the coastal plain, and it includes saltpan, clay patches and salt marsh, tidal flat deposits and denudational hills, built-up and forest landuse patterns, a vertisol soil type and higher drainage density.
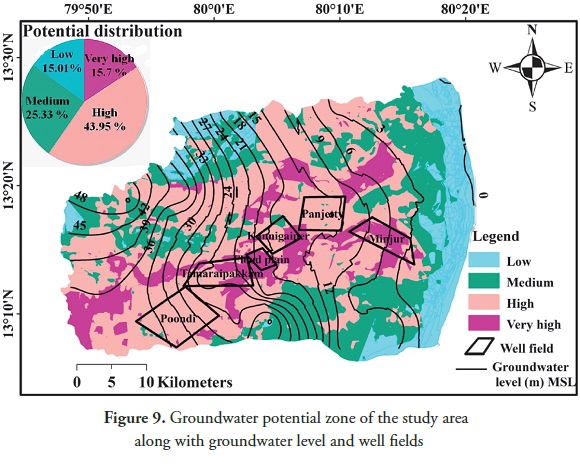
The prepared groundwater potential map was compared with a groundwater contour map from April 2006 and the locations of well fields (Figure 9). It is observed that in the very high and high groundwater potential zones, the groundwater table is reasonably flat with widely spaced groundwater contours. The relatively widely spaced groundwater contours surrounded by closely spaced contours indicate that the water table is relatively flat. The well fields of Minjur, Panjetty, Kannigaiper, Flood Plain, Thamaripakkam and Poondi are located mostly in very high and high potential zones (Figure 9). As the groundwater within the study area is under threat due to seawater intrusion, the groundwater pumping in the western part of these well fields is comparatively higher than the eastern well fields.
Conclusion
This study was carried out to map the groundwater potential zones in the region of north Chennai, India, where groundwater is being over exploited to meet the demand from agriculture, industry and domestic users. Weighted overlay analysis was adopted to prepare a map of groundwater potential zones using seven thematic layers: geology, geomorphology, soil, lineament density, drainage density, rainfall and landuse. The delineated zones within this region were classified as very high, high, moderate and low groundwater potential zones. A groundwater table contour map and the locations of existing well fields were overlaid with the groundwater potential map. It is observed that in the very high groundwater potential zones the groundwater table is reasonably flat. Further, it was identified that the existing well fields are located in regions with high groundwater potential zones. These observations validate the map prepared in this study. The saltpans and saline water intrusion are likely due to the over-extraction of groundwater, which affects the quality of the groundwater along the coastal region. To prevent seawater intrusion, groundwater pumping from the Minjur well field needs to be stopped. To meet the increasing demand and to prevent seawater intrusion, new well fields may be formed in other high groundwater potential zones, especially in the western region of the Poondi well field. This study demonstrates the application of remote sensing and GIS techniques for integrating surface and subsurface information in a rapid and cost-effective manner, which may assist in locating sites for the development of groundwater well fields in the future.
Acknowledgement
The authors wish to acknowledge the research grant (NRSC/HGD/EOAM-AU/2009 ) provided by the National Remote Sensing Centre (NRSC), Department of Space (DOS), Hyderabad, India, to carry out this research.
First two authors thank University Grant Commission's Special Assistance Programme (Grant No. F.550/3/DRS/2013 -SAP-1), Centre with Potential for Excellence in Environmental Science programme (Grant No.F.No.1-9/2002 (NS/PE) and European Commission (Saph Pani project - Grant No.282911) for their support.
References
ArcGIS9.3 (2007) Welcome to ArcGIS Desktop, http://webhelp.esri.com/arcgisdesktop/9.3 (Accessed March 8, 2014). [ Links ]
Ariyo, S.O., Folorunso, A.F. and Ajibade, O.M. (2011). Geological and geophysical evaluation of the Ajana area's groundwater potential, South Western Nigeria. Earth Sciences Research Journal 15, no.1, 35-40. [ Links ]
Deepesh Machiwal, Madan, K. Jha, Bimal C. and Mal. (2011). Assessment of Groundwater Potential in a Semi-Arid Region of India Using Remote Sensing, GIS and MCDM Techniques. Water Resource Manage, 25, 1359-1386. [ Links ]
Etishree, A., Rajat, A., Garg, R.D. and Garg, P.K, (2013). Delineation of groundwater potential zone: An AHP/ANP approach, Journal of Earth System Science. 122, 887-898. [ Links ]
Girish Kumar, M., Agarwal, A. K., and Bali, R. (2008). Delineation of potential sites for water harvesting structures using remote sensing and GIS, Journal of the Indian Society of Remote Sensing. 36,323–334. [ Links ]
Geological Survey of India (GSI). (2001) & (2005). District Resource Map, Chennai and Kanchipuram District, Tamil Nadu. India. [ Links ]
Jagadeeswara Rao, P., Harikrishna, P., and Suryaprakasa Rao, B. (2004). An integrated study on groundwater resource of Peddagedda watershed, Journal of the Indian Society Remote Sensing. 32, 9-14. [ Links ]
Jenks, G.F. (1967). The data model concept in statistical mapping, International Year Book of Cartography. 7, 186-190. [ Links ]
Lokesh, A., Gopalakrishna, G.S., and Mahesh, M.J. (2007). Hydrogeomorphological studies in Kallambella watershed Tumkur district, Karnataka State, India using remote sensing and GIS, Journal of the Indian Society of Remote Sensing. 35, 107-115. [ Links ]
Mondal, M.S., Pandey, A.C. and Garg, R.D. (2007). Groundwater prospects evaluation based on hydrogeomorphological mapping using high resolution satellite images: a case study in Uttarakhand, Journal of the Indian Society of Remote Sensing. 36, 69-76. [ Links ]
Nag, S. K. (1998). Morphometric analysis using Remote Sensing techniques in the Chaka sub-basin, Purulia district, West Bengal, Journal of the Indian Society of Remote Sensing. 26, 69-76. [ Links ]
Nag S.K and Ghosh, P. (2012). Delineation of groundwater potential zone in Chhatna Block, Bankura District, West Bengal, India using remote sensing and GIS techniques. Environmental Earth Science. DOI 10.1007/s 12665-012-1713-0. [ Links ]
Nagarajan, M., and Singh, S. (2009). Assessment of groundwater potential zones using GIS Technique, Journal of the Indian Society of Remote Sensing. 37, 69-77. [ Links ]
Prasad, R.K., Montal, N.C., Pallavi Banerjee., Nandakumar, M.V. and Singh, V.S. (2008). Deciphering potential groundwater zone in hard rock through the application of GIS, Environmental Geology. 55, 467–475. [ Links ]
Preeja, K.R., Sabu Joseph., Jobin Thomos. and Vijith, H. (2011). Identification of groundwater potential zones of a tropical river basin (Kerala, India) using remote sensing and GIS techniques, Journal of the Indian Society of Remote Sensing. 39, 83-94. [ Links ]
Sikdar P. K., Chakraborty, S., Enakshi Adhya and Paul, P.K. (2004). Landuse/land cover changes and groundwater potential zoning in and around Raniganj coal mining area, Bardhaman district, West Bengal - A GIS and Remote Sensing approach, Journal of Spatial Hydrology. 4, no.2. [ Links ]
Samadder, R.K., Kumar, S., and Gupta, R.P. (2011). Paleochannels and their potential for artificial groundwater recharge in the western Ganga plains, Journal of Hydrology. 400, 154–164. [ Links ]
Satty, T.L., (1980). The Analytic Hierarchy Process; McGraw Hill, New York, NY. [ Links ]
Shirke, J.M., Krishnaiah, C., and Panvalkar, G.A. (2005). Mapping of a paleochannel course of the Wainganaga River, Maharastra, India, Bulletin of Engineering Geology Environment. 64, 311-318. [ Links ]
Suja Rose, R.S. and Krishnan, N. (2009). Spatial analysis of groundwater potential using remote sensing and GIS in the Kanyakumari and Nambiyar Basins, India, Journal of the Indian Society of Remote Sensing. 37, 681-692. [ Links ]
Sukumar, S., and Sankar, K. (2010). Delineation of potential zones for artificial recharge using GIS in Theni district, Tami Nadu, India, International Journal of Geomatics and Geosciences. 1, no.3, 640-648. [ Links ]
Teixeira, J., Chaminé, H. I., Espinha Marqus, J., Gomes, A., Carvalho. J.M., Pérz Albertí, A. and Rocha, F.T. (2008). Integrated approach of hydrogeomorphology and GIS mapping to the evaluation of groundwater resources: an example from the hydro mineral system of Caldas Da Cavaca, NW Portugal, Global Groundwater Resource and Management. 227-249. [ Links ]
Thomas, A., Sharma, P.K., Sharma, M.K and Sood, A. (1999). Hydrogeomorphological mapping in assessing groundwater by using remote sensing data-a case study in Lehra Gaga block Sangrur district, Punjab, Journal of the Indian Society of Remote Sensing. 27(1), 31-42. [ Links ]
United Nations Development Programme (UNDP). (1987). Hydrogeological and artificial recharge studies, Madras, India, Technical Report, DP/UP/IND-78-029/2. [ Links ]
United States Department of Agriculture (USDA) (1999). A basic system of soil classification for making and interpreting soil surveys, Soil Taxonomy, Second Edition, Natural Resources Conservation Service. [ Links ]
