


 English (pdf)
 Article in xml format
 Article references
 Send this article by e-mail
 Cited by SciELO
  Cited by Google
  Similars in
SciELO
Similars in
SciELO  Similars in Google
 Permalink
Introduction
Land degradation is a severe environmental problem, which removes fertile top soil, and increases sedimentation in rivers and dams (Shao et al., 2014). Land degradation affects a large area of northeastern Brazil in reasons of many factors, such as the decrease of crop productivity. These problems are even more pronounced in semi-arid regions. This region is characterized by low rainfall, high temperatures, slightly weathered soils, and low phytomass production (Sousa et al., 2012). In addition, these regions have unique geo-environmental characteristics and are highly susceptible to dangers from natural and socioeconomic hazards (Lal, 1986), and also receive low, erratic rainfall of up to 600 mm yr-1, with periodic droughts and various associations of vegetative cover and soils (Silva et al., 2015).
In this region, soil erosion process by water is a major problem that the area has suffered in the last century (Santos et al., 2017). In Brazil, areas prone to desertification cover 980,711 km2, distributed in eight states of northeastern Brazil (Costa et al., 2009), and approximately 99,000 km2 are in an advanced stage of desertification (Sousa et al., 2012).
According to Anache et al. (2017), quantitative results related to erosion rates and conservation policies are not usually available for areas with erosion problems, particularly semi-arid regions which suffer from political neglect and industrial and economic stagnation (Beskow et al., 2009). Furthermore, the agricultural sector in the semi-arid region of Brazil is dependent on natural rainfall and this high dependence on the short rainy season renders the country very vulnerable to weather hazards due to low-investment and family farming or traditional extensive livestock farming. Therefore, proactive policies and sustainable water management strategies that are based on decision support systems are crucial in semi-arid regions, such as irrigation projects and transposition of the São Francisco River (Henkes, 2014). Increased water scarcity, rising temperatures, and extreme climate events such as floods and droughts have grown in magnitude and frequency during the last few decades (Rao et al., 2016), which directly influence the type and condition of the vegetation cover. The higher frequencies of extreme events, as droughts, represent a big threat to the economy and to the livelihoods of the population because of their many consequences to cropland, food security, water availability and health.
Furthermore, despite an extensive body of knowledge about the relationships among vegetative cover, soil erosion and eco-environmental changes (Srinivasan & Galvão 1995; Marengo et al., 2016; Martins et al., 2018), very little is known about such processes in the caatinga biome (Schulz et al., 2017), because this biome is poorly analyzed and considered as one of the more neglected of Brazilian biomes (Beuchle et al., 2015; Ribeiro et al., 2016). Data availability of soil erosion and land changes in the caatinga is limited to thesis, few papers or technical notes published in regional journals, which makes it difficult for an international audience (Silva et al., 2017). A preliminary literature review on temporal and spatial research has shown that several regional-scale studies on land change exist in Brazil (Portillo-Quintero et al., 2013; Schucknecht et al., 2013; Coelho et al., 2014; Salazar et al., 2015), but without integration about soil erosion and eco-environmental changes in desertification area.
Besides the climatic causes, the intensification and mechanization of agriculture in recent decades have been known as the main causes of the acceleration of erosion processes (Cerdá et al., 2009) and consequently the acceleration of desertification. Thus, changes in land cover, agricultural intensification, and increased storm intensity due to climate variability could increase erosion and eco-environmental change considerably in the coming years. Environmental or erosion models are important decision tools for policy makers, as they help to quantify environmental sensitivity and to understand the relationship between human activities and environmental quality, particularly in semi-arid regions (Manfré et al., 2013).
The development of studies to monitor land degradation is urgently needed to preserve natural resources and increase quality of life, especially within environmentally important biodiversity hotspots such as the Monteiro region of Brazil. In order to study eco-environmental changes and soil loss, several approaches for vulnerability and risk assessment using geographic information systems (GIS) have been developed in the last few years (Braga et al., 2013; Brito Neto et al., 2016). These approaches allow an integrated evaluation of environmental outcomes using mathematic models, especially distributed models, which are valuable in evaluating different strategies for improvements in land use management.
Several physically-based models have been developed in order to estimate sediment yield, such as LISEM (de Roo and Jetten, 1999), WEPP (Flanagan et al., 2012), Kineros2 (Woolhiser et al., 1990), and SWAT (Arnold et al., 1998). The four models mentioned have the following disadvantages: (a) they need extensive data sets as input and have many calibration parameters; (b) they require either complex laboratory analyses or dificult and expensive field data collection, which may be infeasible in many developing countries; and (c) in spite of having some calibration parameters (Zhang et al., 2013), the models (except SWAT) do not have an optimization method implanted in the software. Some strength of these models can be emphasized: (a) they are physically or semi-physically based models, and basic processes are incorporated;(b) they take into account spatial variability of inputs and outputs, thus better representing the real world; (c) three of them are derived from the Universal Soil Loss Equation (USLE). This equation was developed by Wischmeier & Smith (1965) and is the simplest equation for erosion estimation. It estimates mean annual soil loss for a long time and has been applied with success in several parts of the world. Thus, the goal of this work is to evaluate the influence of eco-environmental changes in soil erosion in a desertification area within Monteiro County, Brazil.
2. Material and Methods
2.1 Study area
The study was conducted within Monteiro County, inserted in the semi-arid area within the rectangle defined by the following coordinates: 37° 21' 21" W and 7° 42' 55" S, and 36° 55' 31" W and 8° 3' 31" S (Figure 1). Monteiro has an approximate area of 990.47 km2 and is in the Paraíba State, northeastern Brazil. The climate is BSw type (hot semi-arid), according to Kõppen classification. The study area is characterized by an aridity and dry climate with historical average rainfall (1999-2011) around 700 mm (Silva, 2004), absence of aquifers, low effective depth of the soils and high evapotranspiration totals. The rainfall intensity is low/moderate and generally occurs during a single rainy season causing a negative water balance (Barbosa et al., 2006). As in other semi-arid regions, the seasonal variability of rainfall is high, resulting in rainfall outside of the characteristic periods, with rainfall occurring mostly during months from February and May (Srinivasan & Paiva, 2009). The average value for potential evapotranspiration is 1900 mm yr-1, according to Santos et al. (2017).
Temperatures are high and quite spatially and temporally uniform, with an annual average ranging from 25 to 30 °C. Monteiro has a heterogeneous landscape and lies over a crystalline basement that spreads by almost all the state of Paraíba from the Agreste to the Sertão mesoregions. The crystalline basement is mainly composed of metamorphosed rocks and tectonically structured Precambrian rocks (schist, gneiss, migmatite, quartzite) and granitic intrusions (Huhn et al., 2014). Quaternary alluvial deposits flank intermittent rivers and streams (de Queiroz & Norton 1992). This region is composed of two main units: Meso- to Neoproterozoic gneisses, migmatites, and meta-supracrustal rocks and Neoproterozoic granitoid plutons of Serra do Monte and Serra do Bravo (Souza et al., 2005). The geomorphology in general is well diversified, constituting by different forms of relief, which were worked by different processes, influenced by the semi-arid climate, and endogenous and exogenous processes.
2.2 Vegetation physiognomies and land cover
The study area is located in the caatinga biome, and the predominant vegetation is the semi-arid tropophile (loss of leafs in drought conditions and/or high humidity) with physiognomic aspects of caatinga vegetation (Lima, 2012), with deciduous species, which lose their leaves during the dry season that occurs from June to January (Silva et al., 2011). The natural distribution of trees is conditioned by the main limiting factors, such as geology, soil types, climatology and water availability. Each tree species is adapted to certain conditions and is located in its niche.
The caatinga vegetation (native vegetation) has vast biodiversity, and around 50% of its original vegetation cover remains relatively intact despite the high human population density and high deforestation rates (Schulz et al., 2017). Northeastern Brazil is composed of highly dynamic ecosystems that readily respond to climatic conditions such as precipitation. The elevation and effective root development capacity of soil thickness are the dominant factors controlling vegetation structure and distribution.
This region possesses a number of species and has high importance as a biodiversity hotspot and is thus extensively studied by environmental scientists. In addition, this region is economically important to Paraíba State due to bentonite mining (Gopinath & Lima 2011) and biodiversity (Lima & Artigas 2013). However, given the environmental and economic importance, there are surprisingly few studies that have examined the environmental fragility of Monteiro region.
Caatinga vegetation is classified as steppe savannah (bush and dense), with species of genera Spondias, Mimosa and Aspidosperma, and is a typical vegetation type in the semi-arid region of Brazil. The caatinga consists of a complex mixture of deciduous woody species with an annual herbaceous understory. This biome has a large number of plant associations and floristic complexes with different physiognomies, including xerophilous, deciduous trees, thorny bushes, cactus, and bromeliads, varying from grassland to xerophytic thorn savanna, and shrub woodland (Barbosa et al., 2006). In this study, three caatinga types were identified based on Mansur et al. (2000) and adopted by Lima & Artigas (2014): (a) Tropophile caatinga high strand (TCHS): savannas and woody savannas as one type of caatinga dry forests with dense cover; (b) Tropophile caatinga middle slope (TCMS): characterized by low amounts of woody vegetation and high human-driven transformation; and (c) Tropophile caatinga plain (TCP): close and open shrublands were interpreted as shrubland, i.e., xerophytic thorn scrubs or degraded caatinga dry forests with less dense and lower vegetation cover.
The vegetation condition used in this study was verified by bioclimatic balance evaluation (rainfall data, soil temperature and soil texture), and such a condition was verified in the field with the objective of associating the bioclimatic condition with the vegetation physiognomy. The floristic survey technique used was that of linear transects of 50x2 m, when data of height and diameter of the vegetation were observed.
2.3 Soil types
The soils in the study area are morphologically diverse, including soils with reddish horizons of clay accumulation, sodium-affected soils with well-developed clay-pans, shallow undeveloped soils, alluvial soils, and cracking-clay soils (de Queiroz & Norton 1992). Luvisols, Fluvisols, Lithosols, Acrisols, and Regosols were identified in the study area. The soil classification of FAO/UNESCO (1988) was used in this study. Luvisols are the most representative soil classes with reference to the study area and are little to moderately developed soils. These soils are developed mainly from gneisses and mica-schists, with or without the contribution of transported materials, and can be formed from other rocks such as phyllites, shales, siltstones, limestone and clayey sediments (de Oliveira et al., 2009). Fluvisols are young soils with weak horizon differentiation possessing AC-proiles and are predominantly brown in color, with texture ranging from coarse sand in levee oils to heavy clays in interfluves. The Lithosols are characterized by young soils and normally limited to a thin A-horizon over an incipient B-horizon. Acrisols are thin ochric surface horizon, dark color and lack distinct pedogenic horizons; they are shallow to moderately deep; and in Paraíba State tend to be coarse-textured. Regosols are very weakly developed mineral soils in unconsolidated materials that have only an ochric surface A-horizon that is not very shallow. This soil type is extensive in eroding lands, particularly in semi-arid regions (Maranhão 2014). Familiarity with the soil classification was gained through ield observations and conversations with farmers during a detailed year-long ecological assessment of a portion of Monteiro County.
2.4 Land cover change and geospatial analysis of soil erosion
Different thematic layers were generated to spatially estimate the soil loss and eco-environmental changes between 1987 and 2010 using Landsat TM imagery dataset. A multi-temporal remotely sensed imagery TM/Landsat (WRS2: 215/65 and 215/66), dated May 1987 and 2010, with spatial resolution of 30 x 30 m were used. Landsat satellite images were classified using supervised classification of maximum likelihood. Accuracy assessment included ground truth points collected in field, high-resolution imagery from 2014, available for visualization on Google Earth (http://earth.google.com), comparison to fine-resolution IKONOS image, and land owners' information, as used by Garcia and Ballester (2016). The areas of different land cover types and final thematic maps were produce using ArcGIS 10.1® (ESRI, 2015). Then, based on these procedures, products and maps, the formal USLE model was applied using a typical GIS-based equation implementation (Figure 2).
Figure 2 Flowchart depicting steps taken to assess USLE model validity for eco-environmental changes in desertification in the Monteiro County.
In this case study, estimates of soil loss from the Monteiro County were estimated based on the USLE to predicting the mean annual erosion and its spatial distribution during the period analyzed (1987 and 2010). The USLE was selected for the current study as it yields reasonably reliable data, at least in certain conditions with moderate input required for data gathering (Mohamed 2013). This equation provides acceptable estimates of average annual sheet and rill erosion from a wide range of land cover, soil, and climatic conditions. The USLE is based on:

where Y is the loss (average annual soil in t ha-1 yr-1), R is the rain erosivity (in MJ mm ha-1 h-1 yr-1), K is the soil erodibility (in t h MJ-1 mm-1), LS is the slope-length factor, which includes slope length and slope steepness factors (booth dimensionless), C is the cover management factor (dimensionless), and P is the support practice factor (dimensionless). As there are no support and conservation practices in the Monteiro, P factor values were assumed to be 1 (Silva et al., 2012). Thus, the CP factor (vegetation cover) was adopted.
2.5 Determining USLE Factors
2.5.1 R factor (erosivity)
In order to determinate rainfall erosivity (R factor), daily rainfall data between January 1998 and December 2010 from 12 grid points of Tropical Rainfall Measuring Mission (TRMM), product 3B42 (V7), with spatial resolution of 0.25° x 0.25° were used (Figure 3). The monthly rainfall erosivity of each grid point was estimated for this period as:
where R is the rainfall erosivity factor (MJ mm ha-1 hr-1 y-1), i is the number of years, j is the number of days per year, and EI30 is rainfall erosivity at 30 minutes per day (hundred t mm ha-1 h-1).

where EI1440 is erosion index per day (hundred t mm ha-1 h-1).

where PI1440 is daily precipitation index (mm h-1).

The daily R value obtained was converted to monthly and annual values. Then, the mean annual erosivity for the 17 year period was derived.
2.5.2 K factor (erodibility)
In order to obtain the values of K factor, data from analysis of eighteen soil samples were used, which were obtained by the Brazilian Agricultural Research Corporation (EMBRAPA) in Monteiro County, available at www.sisolos.cnptia.embrapa.br. The soil erodibility factor (K) was determined based on the methodology proposed by Williams (1995):

where fsand is the coarse sand indices, fel-si is the silt and clay rate, forgc is the organic carbon content and fhisand is the sand content. The parameters used to calculate the K factor were calculated using the following equations:
where ms is the percentage of sand, msilt is the percentage of silt, mc is the percentage of clay and orgC is the organic carbon percentage contained in the A-horizon (surface soil). Soil distribution in the Monteiro and the K factor values are shown in Table 1.
2.5.3 LS factor (topographic)
Smith & Wischmeier (1957) evaluated the effect of slope and length on soil erosion for several locations, and deined the dimensionless length and steepness of slope factor (LS). In the present study, the LS factor was obtained using one freely-available global digital elevation model (DEM), i.e. product ASTER GDEM2 with a spatial resolution of 30 m, which is available at https://asterweb.jpl.nasa.gov/gdem.asp. Thus, in order to estimate LS factor, Eq. 11 was used, as proposed by Moore and Burch (1986) and was also used by Zhang et al. (2009):

where V is the product of flow accumulation and cell size and θ is the slope in degrees; both are directly derived from the DEM.
2.5.4 C factor (land cover)
The C factor was estimated using remote sensing techniques based on vegetation indices derived from satellite images by the normalized difference vegetation index (NDVI), named NDVI-C. The NDVI measures the amount of green vegetation and is expressed as:

where NIR is reflection of the near infrared portion of the electromagnetic spectrum and IR is reflection of the upper visible spectrum. In a subsequent step, NDVI-C values for each land cover were taken from each image. These sample points were used for a linear regression analysis:

The C factor prediction model based on NDVI was tested here, because it was used for similar studies in the Europe, Asia and South America (Anache et al., 2014; Durigon et al., 2014; Silva et al., 2013; Wang et al., 2010; Meusburger et al., 2010; Ahmet, 2010; de Asis & Omasa, 2007; Lin et al., 2002). A desirable feature of C factor prediction using NDVI satellite imagery is that it estimates the fractional abundance of ground cover and barren soils simultaneously, which is appropriate for soil erosion analysis. To obtain a better picture of the NDVI images, NDVI profiles were created for all land cover classes. The NDVI-C factor values obtained can be found in Table 2.
2.6 Indictors of desertification and rates of eco-environmental degradation
Numerous models and indicators were developed to analyze the eco-environmental degradation (Al-Awadhi et al., 2005; Garcia and Ballester, 2016) and assessment of climate variability on water resources. In this study, eco-environmental degradation rate was calculated according to Puyravaud modified index (Puyravaud, 2003):

where X is the landscape change rate, S1 and S2 are the land area of each land cover at time (1987 for T1 and 2010 for T2). Puyravaud modified index was adopted to make the present results comparable to other studies, thus, the result of deforestation, forest degradation and land cover changes were considered as landscape loss.
3. Results and Discussion
3.1 Analysis of Eco-Environmental degradation processes
After the classification of satellite data, the reliability of results depends on the overall accuracies of the classified images. The result of this process indicates whether the land cover changes have been accurately identified and extracted. Figure 4 shows land cover classes in Monteiro for the studied years. The dominant land cover in the study area in 1987 and 2010 were TCMS, TCP, TCHS, barren land, water, and urban area. Figure 4b shows a recovery and an increase in the TCMS and TCHS.
Table 3 shows the distribution of land cover types (change in area and percentage growth) for the study area in 1987 and 2010. The results show that there was an increase of TCHS area compared to the TCMS and TCP, mainly on the western edge of the municipality, whereas in the eastern portion, the areas covered by TCMS were replaced by TCP. The TCP and TCHS areas increased from 231.4 km2 and 225.1 km2 in 1987 to 282.9 km2 and 275.1 km2 in 2010, respectively. The results show an increase of 21.84 % of the total area of TCHS, while TCMS declined by 13.7 % and the barren land decreased by 64.9 % (Table 3). The decrease is particularly evident in areas covered by vegetation (24.1 %) and water (15.5 %), corresponding to an average loss of 342.2 and 97.4 km2 yr-1, respectively. The results also show a great growth of the Urban area (> 200 %), influenced by population increase, when in 1980s the resident population was 26,852 inhabitants and in 2010s it increased to 30,852 inhabitants (210 %), with 66 % of the total population living in the urban zone (Lima, 2012).
From Table 3, it is clear that a substantial change in land cover patterns has occurred over the studied years. As shown, Urban area and TCP classes has been the main receivers of land from other classes. The increase of urbanization in the area provoked an intense land cover change during the last decades. As observed in Table 3, Monteiro County was mainly covered by TCMS (46.1 % in 1987 and 39.8 % in 2010). In general, a substantial loss of natural vegetation (caatinga) was observed during the study period in Monteiro. Degraded land (barren land) presented a fluctuating pattern during the studied period, e.g. 6.7 % of the total landscape in 1987 and the minimum value in 2010 with 2.3 % of the total study area.
The eco-environmental degradation processes in Monteiro between 1987 and 2010 (Figure 5) was also calculated based on Puyravaud modified index. In this figure, the positive and negative bars represent land cover types that respectively expanded and decreased in extent. The results show that the environmental conversion processes occurring in Monteiro can be characterized in terms of two types between 1987 and 2010: (1) barren land decreased by approximately 4.5 % and by 0.5 % for TCMS; and (2) TCP and TCHS increased by 0.6% and 0.7%, respectively. The results show that the decrease in the area of degraded land was more than that of reclaimed land. The urban area categories clearly increased in the period studied, followed by TCP and TCHS. It was observed that, even a small increase in the land cover can cause a resignation on erosion processes.
During the analyzed period, the land cover had a spatial reconfiguration in Monteiro. Spatial distributions of transition among land cover classes are shown in Figure 6. The pristine areas were derived from boolean operations using land use and land cover maps from 1987 and 2010. The results show that few areas remained unchanged throughout the whole landscape changing process. The areas with land cover change and without change for the studied period were 857.72 km2 and 132.75 km2, respectively. Land cover types without changes were observed among TCHS (62.53 km2), TCP (50.75 km2) and TCMS (12.43 km2). Main changes were observed among TCP (94.50 km2), TCHS (9.12 km2), TCMS (19.93 km2) and Barren land (8.6 km2).
Figure 6 Map of natural areas that showed no land cover or land use change in Monteiro County from 1987 to 2010 (pristine).
Tables 4 and 5 show the land cover change matrixes for Monteiro County for 1987 and 2010. Table 6 shows the errors of omission and commission obtained by the verification of classified images. The omission errors were small (below 2%), showing an excellent accuracy between the classes predicted and those identified in the field. Commission errors showed points that were improperly included in all categories. Additionally, the Kappa coefficients for the 1987 and 2010 maps were 0.99 and 0.97, respectively, which could be considered an almost perfect evaluation based on the reference table presented by Landis & Koch (1977).
Table 4 Land cover change classification matrix for Monteiro County for 1987.
TCP = Tropophile caatinga plain, TCMS = Tropophile caatinga middle slope and TCHS = Tropophile caatinga high strand.
Table 5 Land cover change classification matrix for Monteiro County for 2010.
TCP = Tropophile caatinga plain, TCMS = Tropophile caatinga middle slope and TCHS = Tropophile caatinga high strand.
It is also interesting to note that the intense anthropogenic pressures (due to removal of wood for the production of firewood and coal) in Monteiro County have generated scattered occupation throughout the region, resulting in environmental degradation mainly caused by deforestation, poor soil use and careless advances on TCMS areas. The erosion increase in these areas also is due to the intensification of goat breeding (agrosilvipasture and silvipasture) in the region, as a practice of economic sustainability of population to coexist with the droughts owing to the climatic conditions of the region. These areas represent zones under intense anthropogenic influence which should be considered as important regions due to their land cover changes. This can cause environmental impacts and decreased crop production in these areas in the future, especially in those related to grazing.
3.2 Geospatial assessment of soil loss vulnerability
After estimating all factors, a geospatial assessment of soil loss vulnerability was computed. Figure 7a shows the annual rainfall erosivity calculated for the region. In this study, erosivity factor values were within a range of 3,896-4,623 MJ mm ha-1 h-1 yr-1. In comparison, R factor values increased from the east to west towards the north and south of the region. The results from this study show that erosivity in the region was high, because depends on the intensity and amount of rainfall. The main result is that the potential risk in the region of Monteiro is very high due to climatic unevenness in which extreme events occur in rainy seasons.
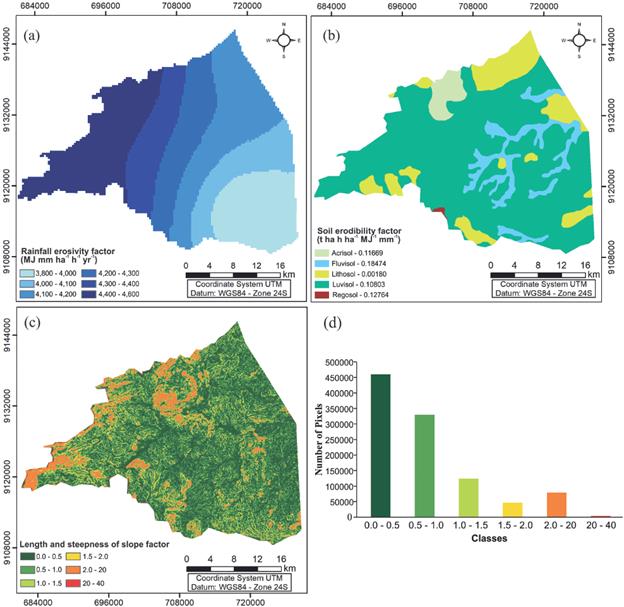
Figure 7 (a) Map of erosivity factor, (b) map of main soil types and K factor values, (c) map of length and steepness of slope factor (LS), and (d) classes of LS values for Monteiro. (a) Map of erosivity factor, (b) map of main soil types and K factor values, (c) map of length and steepness of slope factor (LS), and (d) classes of LS values for Monteiro.
High intensity rainfall events provoke severe erosion within the area, when compared to the R factor values mapped for humid areas of Brazil (Anache et al., 2018; da Silva et al., 2013), which were 1,000 < R factor < 5,000 MJ mm ha-1 h-1 year-1 for the semi-arid region in Brazil. These values showed that the region climatologically had a high erosion potential. Therefore, in spite of showing higher erosivity values, it has long been recognized that the climatic conditions of these regions together with land cover, soil types, and topographic factors can increase the soil loss.
Figure 7b shows soil types and the spatial distribution of K factor in Monteiro County. The K values varied from 0.034 to 0.052 t h-' MJ-' mm-', with the mean value equal to 0.043 t h-' MJ-' mm-'. The major soil types in the study area are Luvisols (73.23%) and Lithosol (13.86 %) with 2:1 minerals that expand (swell) when wet, and shrink when dry, i.e., plastic characteristic. When studying the soil moisture in the profile corresponding to the root zone in semi-arid region of Brazil, Costa et al. (2013) showed that the largest runoff volumes occur in the plot with the Luvisol (mean field capacity of the profile of 0.225 m3 m-3), against a value of 0.280 m3 m-3 for field capacity for plot with an occurrence a Red-Yellow Ultisol. This characterizes the capability of a Luvisol for producing of soil loss, when compared to other soils of the region. The Lithosol is not more susceptible to erosion. It is noted that 9.24% of Monteiro's overall area contains Fluvisols, which have the highest soil erodibility values. The soils of the region are characterized by the soil moisture variation, which provokes deep cracks during dry spells, and very plastic and sticky soil consistency, when wet (dos Santos et al., 2016). The low permeability is due to the high clay content, however possesses high water adsorption, which results in high initial abstractions when dry. Porosity below the inflection point corresponds to textural voids, as presented by Silva et al. (2011). These factors may increase the erosion processes in the study area.
The spatial distribution of LS factors is shown in Figure 7c. Monteiro has LS factor values which ranged from 0-0.5 to 20-40, with the highest values in the classes 0-0.5 (44 % of total area) and 0.5-1 (32 % of total area) (Figure 7d). According to the spatial analysis, Monteiro is characterized by its increasing elevation values from east to west, with a maximum drop of 673 m. The LS factors suggested that the largest values occur in the northwest and north portions, and at a low frequency in the central and east parts, which means that there is an increase of soil loss only in a very small part of the study area that has steeper slopes, which is more susceptible to such a loss. The north and northwest areas of the region have the highest elevation.
Figures 8a-b show the NDVI maps for the years studied. The NDVI values varied from -1 to 0 for areas with water or barren land, while values above 0 and less than 1 represent the TCMS, TCP and TCHS classes. The lowest NDVI values occurred in the TCP areas characterized by small agricultural areas and in places where goat farming exist. Owing to the larger amount of barren land located in the hillside edges of the valleys, higher C factor values occur in those areas as well. In 1987, the larges area with NDVI values represented the 0.25-0.50 class, while in 2010 the class with the largest area was the 0.50-0.75. In addition, many streams and reservoirs found in the images from 1987 were not present in those from 2010. This change was probably caused by land degradation or climatic conditions, even for such a short time period (i.e. 23 years).
Table 5 summarizes the average rate of soil loss for different land cover types. It is noted that the majority of land cover in the area (TCMS TCP and TCHS) is expected to have average annual soil losses o approximately 2.83 t ha-1 yr-1 for 1987 and 1.0 t ha-1 yr-1 for 2010. These values can be considered low for these land cover types when compared to Silva et al. (1999, 2012), due to the high C factor values present in a large part of the area (considering that there was no major program of natural cover restoration or erosion control) and due to climatic conditions in the study area which can be considered unusual for a semi-arid region.
Table 7 Statistics for the estimated soil loss for each land cover type in Monteiro from 1987 to 2010.
Figures 9a-b show annual soil loss within Monteiro for the years 1987 and 2010. The results show that the soil loss values ranged from 2 to 500 t ha-1 yr-1 for two years studied, and a decrease can be observed in the areas with the highest trend to soil loss in 2010, which is a direct reflection of the ongoing reduction of vegetation cover. The current rate of soil loss from the study area was different to the mean soil loss rate obtained by Silva et al. (2008), Srinivasan & Paiva (2009) and Montenegro et al. (2013) for erosion plots of 100 nx2 with different surface cover types in Sumé and São João do Cariri Counties. However, the current rate in our study area is well above the other cover types and cultivated fields in savannah and caatinga environments (Oliveira et al., 2015).
The lowest rates of soil loss were observed for Urban area and TCHS and TCMS. In this study, mean annual soil loss for Barren land was 132.6 t ha-1 yr-1 in 1987 and decreased to 93.3 t ha-1 yr-1 in 2010, and for TCP was 5.9 t ha-1 yr-1 in 1987 and 1.2 t ha-1 yr-1 in 2010.
Furthermore, another important feature of this area is the undulating relief in the western edge of Monteiro. Areas with higher soil loss have LS factor values higher than 12.3 % and land cover classified as TCP and TCMS, whereas the lower soil loss was in TCHS, because it occurs in the tops of the mountains, where intact vegetation exist, which significantly reduces the soil erosion. Thus, interventions should therefore be prioritized for areas with a slope steeper than 10 %. The soil erosion influenced by erosivity also is uncertain in the study area regarding rainfall magnitude and consecutive dry days (dos Santos et al., 2016).
Human activities such as deforestation, removal of TCMS for firewood and other purposes, and using arid and semi-arid lands interchangeably for cultivation and grazing significantly increase water productivity and soil loss, which in turn increases the potential for land degradation. Consequently, the removal of TCMS and TCP as a means to improve rangeland productivity must be accompanied by careful management. Therefore, keeping suitable vegetative cover should be considered for soil and water conservation in forests and rangeland, and any cultivation or brush control should be carefully practiced to avoid retrogressive trends in these lands.
The present study brings a contribution to the knowledge and discussion on historic and current status of land use and cover in the semi-arid region of Brazil (caatinga biome), mainly between 1987 and 2010. It provides key information to institutions concerned with land cover change assessment or environmental conservation on how much of the natural vegetation in the region has already been lost and in which rates are occurring forest and woodland losses during different historical time period, using satellite imagery and GIS techniques.
As example of action for the caatinga biome conservation, there is the creation of protected areas in the remaining areas of caatinga, the so-called conservation units. They are defined areas where the nature and resources could be protected by the Brazilian Forest Code of 1965 (BRAZIL, 1965). In addition to such measure, there is also the dissemination of sustainable technologies, reforestation, forest management, agroecology, support to the local productive groups and environmental education. Such regional planning and action propositions could reduce the increase of desertification in the semi-arid region of northeastern Brazil.
4. Conclusions
In this study, environmental and natural vulnerability maps developed for the Monteiro municipality in Paraíba State in the Brazilian semi-arid region helped to develop a better understanding of ecosystem fragility and urban growth in desertification areas. Intense anthropogenic activities take place at sites that are mainly related to agriculture and are aided by a lack of guidelines for local environmental management. The research shows that great changes have taken place in the eco-environment in Monteiro area.
Soil erosion is a severe problem in semi-arid region of northeastern Brazil, and study the soil loss risk and eco-environmental changes is necessary for management sustainable of land cover. The results indicate that soil losses are lower in the Monteiro area, revealing the regeneration of vegetative cover and a decrease in erosion-prone areas. However, further studies are needed to conirm this tendency within other soil geomorphological units. Finally, the application of the USLE/GIS approach resulted in a consistent pattern of soil erosion among different land cover types, slope positions and soil groups and reasonably predicted annual soil losses, locating the erosion-prone areas in Monteiro County where concentrated flow created irreversible soil losses.

