


 English (pdf)
 Article in xml format
 Article references
 Send this article by e-mail
 Cited by SciELO
  Cited by Google
  Similars in
SciELO
Similars in
SciELO  Similars in Google
 Permalink
Introduction
The slaking and durability behaviors of rocks is generally evaluated by using the slake-durability test. The test method is described in ISRM (1979) and as an international standard in ASTM (1990). The test index namely Slake-durability index (Id) is an important parameter to investigate the engineering behavior of rock-materials and rock masses, especially for weak and soluble rocks including clay-bearing, carbonate and evaporate rocks (Franklin and Chandra, 1972; Onodera et al., 1974; Crosta, 1998; Koncagul and Santi, 1999; Gokceoglu et al., 2000; Dhakal et al., 2002; Singh et al., 2005; Gupta and Ahmed, 2007; Yagiz, 2011).
Slaking and durability behaviors of various rocks were studied by many scholars using the slake-durability test (e.g. Bell, 1992; Moon and Beattie, 1995; Gokceoglu, 1997; Sadisun et al., 2005; Fuenkajorn, 2011; Sebastian Brysona et al., 2012; Yavuz, 2012; Keaton, 2013; Heidari et al., 2015; Yavuz et al., 2017). In this regard, Gokceoglu et al. (2000) assessed the effect of mineralogy and strength on the durability of different types selected from Turkey. Singh et al. (2006) reported that the strength characteristics of marble are highest at pH=7 and the strength reduction is greater in the acidic conditions than in the alkaline. Dhakal et al. (2002) indicated that the durability of rocks is affected by their mineralogy. The durability of some carbonate rocks in acidic environments was studied by Gupta and Ahmed (2007). Kolay and Kayabali (2006) identified the influence of aggregate shape and angularity on the slake-durability index for the same rocks. The effect of water pH on slaking process of different rocks has been analyzed by Kayabali et al. (2006), Gupta and Ahmed (2007) and Zhou et al. (2005). Ghobadi and Fereidooni (2015) studied the influence of mineralogy on the durability and strength of hornfelsic rocks under acidic rainfall in urban polluted areas. Many other researchers have used different methods including regression analysis, fuzzy logic system and grey system modeling prediction to estimate the slake-durability of rocks (Lu et al., 2005; Singh et al., 2005; Moradian et al., 2010; Tasdemir et al., 2013; Fereidooni, 2016). Singh et al. (2005) investigated the effect of acidity of water on the slake-durability index of shales and used the artificial neural network and neuro-fuzzy logic systems for predicting the parameter for shales. Sharma and Singh (2008) tested various rocks including sandstone, basalt, mica schist, coal, and shale, to assess the relationships between the slake-durability index and uniaxial compressive strength (UCS), impact strength, Schmidt hardness and P-wave velocity. Yagiz (2011) carried out a comprehensive study to determine relationships between the slake-durability index and physical and mechanical properties of some carbonate rocks from Turkey. In this study, dry density, saturated density and Schmidt rebound hardness are related to the first cycle slake-durability index. But uniaxial compressive strength is related to the fourth cycle slake-durability index. Momeni et al. (2017) have investigated the effect of weathering on durability and deformability properties of three different types of granitoid rocks. In their research, to assess the weathering effect on the durability behavior of these rocks, a slake durability test was performed up to 40 cycles. The results showed that the slake durability index can be used for determining the weathering grade and the long-term durability assessment of the rocks. Kahraman et al. (2017) found the correlation between the slake-durability index and uniaxial compressive strength of pyroclastic rocks. Monticelli et al. (2020) assessed the relationship between durability index and uniaxial compressive strength of a gneissic rock and found that the slake -durability test is a suitable test for predicting susceptibility of the studied rock to weathering, loss of strength, and durability. Many other researchers have the slake -durability test for assessing behaviors of various rocks that a summarized history of their researches is presented in Table 1.
Table 1 A summarized history of application of the slake-durability test by previous researchers
| No. | Reference | Studied rock types | Description | Number of test cycles | Applied solution |
|---|---|---|---|---|---|
| 1 | Gokceoglu et al. (2000) | Clay-bearing rocks | Study the effect of the number of wetting-drying cycles on the durability of weak rocks | Four cycles (Id4) | Natural water at 20 °C |
| 2 | Dhakal et al. (2002) | Pyroclastic rocks, sandstones and mudstones | Investigated the relationship between mineralogy and durability in different solutions | Ten cycles (Id10) | Distilled water, NaCl and CaCl2 solutions |
| 3 | Kayabali et al. (2006) | Gypsum | The influence of pH of testing liquid on the slake durability index (Id) | Two cycles (Id2) | HCl and NaOH solutions with pH values of 2, 4, 6, 8, 10, and 12 |
| 4 | Gupta and Ahmed (2007) | Limestone, shale and siltstone | Evaluating the effect of mineralogical characteristics and pH of water including acidic and alkaline environment on the durability of rocks | Five cycles (Id2) | pH of the liquid is 2, 4, 6, 8, 10 and 12 at about 20 °C |
| 5 | Sharma and Singh (2008) | Sandstone, Basalt, Phyllite, Mica Schist, Coal, Shale | Use of regression analysis for correlation between ultrasonic wave velocity (VP) and slake durability index | One cycle (Id) | Natural water at 25 °C |
| 6 | Kolay et al. (2010) | Sandstone, limestone, granite, tuff, Marl | Present empirical relationships between durability index and point load strength by some soft computing approaches | Two cycles (Id2) | Natural water |
| 7 | Ghobadi and Momeni (2011) | Granitic rocks | Assessing the effect of pH on the degradability of rocks by slake durability test | Fifteen cycles (Id15) | Sulfuric acid (H2SO4) with pH 2.5, 4, and 5.5 |
| 8 | Yagiz et al. (2012) | Carbonate rocks | Effect of the slake durability cycles on the modulus of elasticity (E) and uniaxial compressive (UCS) strength of rocks | Ten cycles (Id10) | Natural water |
| 9 | Tasdemir et al. (2013) | Sandstone, marl, ignimbrite, limestone, tuff, granite | Use of artificial neural network (ANN) approaches for estimating slake durability index | Two cycles (Id2) t | Natural water |
| 10 | Ghobadi and Mousavi (2014) | Sandstones | Evaluating the influence of pH and salty solutions on the durability of rocks | Fifteen cycles (Id15) | Acidic (H2SO4) and alkaline (NaOH) watery environments and saline solutions (NaCl and Na2SO4) |
| 11 | Gautam and Shakoor (2016) | Claystone, mudstone, siltstone and shale | Performing slake durability test for laboratory comparing the slaking behavior of common clay-bearing rocks | Five cycles (Id5) | Natural climatic conditions |
| 12 | Kahraman et al. (2017) | pyroclastic rocks | Prediction of uniaxial compressive strength from slake durability index by using regression analysis | Four cycles (Id4) | Tap water at about 20 °C |
| 13 | Fereidooni and Khajevand (2018) | Travertine | Establish relationship between number of cycles of slake durability test and geotechnical properties of rocks such as physical properties, uniaxial compressive strength, Brazilian tensile strength, point load strength, block punch strength and Schmidt rebound hardness | Ten cycles (Id10) | Natural water with pH = 7 and sulfuric acid solution (H2SO4) with pH of 5.5 and 4 |
| 14 | Yagiz (2018) | Travertine and limestone | Assessing the effect of pH of testing solution on degradability of rocks by performing slake durability test | Five cycles (Id5) | Various acidic (HCl) and alkaline (NaOH) watery environments with pH from 2 to 10 |
| 15 | Fereidooni and Khajevand (2019) | Different sedimentary rocks | Purposed new weathering method for evaluating the durability of rocks under different pH conditions | Ten cycles (Id10) of slake durability test and ten cycles (AWI10) accelerated weathering test (AWT) | Natural water and sulfuric acid solution with different pH conditions |
| 16 | Liu et al. (2020) | Sandstone | Evaluating the effect of various chemical additives in the slaking fluid on the durability, by slake durability test and Dual rotation test | Two cycles (Id2) | Distilled water and dual rotation test in SDS, NaCl, MgCl2, Na2CO3, K2CO3, Na2SO4 , Al2(SO4)3 solutions |
| 17 | Selen et al. (2020) | Flysch and serpentinite | Study the slaking and disintegration behavior of the weak rock mass consisting of clay and clay-like minerals for hydropower project using modified slake durability test | Two cycles (Id2) | Tap water at 20-25 °C |
| 18 | Khajevand (2021) | Carbonate rocks | Study the effect of mineralogy, petrographic and textural properties on slake durability index | Three cycles (Id3) | Natural water of the region |
| 19 | Arman (2021) | Evaporate rocks | Correlation between uniaxial compressive strength and second cycle of slake durability index and present empirical equations | Two cycles (Id2) | Natural water |
| 20 | Momeni et al. (2017) | Granitoid rocks | The effect of weathering on durability and deformability properties of granitoid rocks | Up to 40 cycles (Id40) | Natural water |
| 21 | Monticelli et al. (2020) | Gneiss | Relationship between durability index and uniaxial compressive strength of a gneissic rock at different weathering grades | Two cycles (Id2) | Natural water |
In the current research, the effect of number of wetting-drying cycles and pH of water on the values of the slake-durability index was investigated for fifteen different rock samples including sandstone, limestone, travertine, and conglomerate collected from northwestern parts of Damghan, north of Iran. Also, the relationships between slake-durability index (Id10) from one side and physical properties (dry and saturated unit weights, porosity, water absorption), index properties (Schmidt rebound hardness, P-wave velocity), and mechanical properties (uniaxial compressive strength, point load index, Brazilian tensile strength and block punch strength) from the other side have been investigated for the rocks. These rocks outcropped on the area and are used as construction materials and building stones in nearby cities. In previous researches, different rocks were subjected to two cycles of the slake-durability test, this doesn't exactly simulate the natural conditions to evaluate rock durability. In the present study, the test is carried out up to ten cycles and the relationship between slake-durability indexes of all cycles and engineering properties of the rocks were investigated. It can be considered as an innovation for the research.
Sampling locations
The northwestern parts of Damghan, northern Iran, were selected as sampling locations. The area is dominantly composed of various sedimentary rocks with a longitude of 54° 08' E to 54° 15' E and a latitude of 36° 14' N to 36° 17' N. It is elevated between 1380 and 1445 m above the mean sea level with a typical continental climate. Fifteen rock samples from four rock types including three sandstones, three limestones, six travertines, and three conglomerates were collected from this region for laboratory testing. The sandstone samples were collected from the Devonian Padeha Formation from a ballast mine on the Chesmeh-Ali road. The limestone samples were selected from the Bahram Formation of the middle Devonian outcropping in northern parts of the ballast mine. The travertine samples were collected from the Chemeh-Hafez Quarry located near the Astaneh village. These travertines occur along the minor branch of the Astaneh Fault from spring waters passing within dolomites and vermicular limestones of the Elika Formation. They were deposited between the Pishsarkoh and Anbehkoh mountains. The conglomerate samples are obtained from the Fajan Formation of the Paleocene-Eocene outcropping on a new road cutting in the margin of Chesmeh-Ali road.
Methodology
To do the current study, the block samples of sandstones (SS), limestones (LS), travertines (TS) and conglomerates (CS) were selected from outcrops available in mines, quarries and road cuttings in the study area. The rock samples were obtained from the depth of excavated locations and they were completely fresh. Then they were transferred to the laboratory. In the laboratory, core specimens were prepared from the rock blocks using the core-drilling machine. The laboratory specimens were prepared in three shapes; irregular or lump, disc, and cylinder. The irregular or lump specimens were used for the slake-durability test. The disc specimens were used for the Brazilian and punch tests. The cylindrical specimens were used for measuring physical properties, ultrasonic wave velocity, point load, and uniaxial compressive strength.
Mineral composition and textural properties of the samples were determined using a polarizing microscope and X-ray diffraction (XRD) based on ASTM (2009) and ISRM (2007) standard procedures. For assessing the effect of mineralogy on rock durability, microscope investigation of thin section and XRD analyses were performed on the samples after the slake-durability test in acidic conditions in 2θ ranges from 4° to 70°. Physical properties including specific gravity (Gs), dry density (үdry), saturated density (үsat), water absorption (Wa), and porosity (n) were determined based on ISRM (2007). These tests involved five sets of experiments carried out on each rock types. Index and mechanical properties including Schmidt rebound hardness (HS), ultrasonic P-wave velocity (VP), uniaxial compressive strength (UCS), point load index (IS(50)), Brazilian tensile strength (BTS) and block punch strength (BPS) were obtained in accordance to related international standard methods. Hereof, the Schmidt rebound test was performed according to ISRM (1981) and ASTM (2001c) by a Schmidt hammer with 2.207 N/m energy on rock blocks of the studied samples. According to the standards, it must do 20 impacts on rock surface and record them. Then, half of the less valuable data (10 impacts) are omitted and averaged over the rest. The P-wave velocity test was applied based on ISRM (2007) and ASTM (1996). P-wave velocity of the tested rocks was determined from five set of experiments for each rock types performed directly on cylindrical shaped specimens in the laboratory by using a Peroceq© digital ultrasonic tester (Model: ND 180; Trade name; Pundit Lab+; Transit time range: 0.1-9999 us; Energizing pulse: 125, 250, 350, 500 V; Frequency range: 24-500 KHz). The uniaxial compressive strength was performed based on the methods suggested by ISRM (1979; 2007) and ASTM (1995). To determine UCS, five cylindrical specimens with the length to diameter ratio of 2-2.5 were tested of each rock sample. The point load tests were undertaken for the rock specimens with unit length to diameter ratio according to ISRM (1985) and ASTM (2001a). The Brazilian tensile test was performed on rock specimens. The length to diameter ratio of the samples was from 0.5 to 0.75 in accordance with the ISRM (1978) and ASTM (2001b). Ten sets of experiments on each rock types were performed for determining the point load index and the Brazilian tensile strength of the studied rocks in the laboratory. The block punch test was used to assess the shear strength of the studied rocks. For this purpose, the cores are cut into thin discs of various raw thicknesses ranging between 5 and 15 mm using a diamond saw (Ulusay et al., 2001). The slake-durability tests were applied on the fifteen rock samples based on ISRM (2007) and ASTM (1990). 450 rock lumps (ten pieces of about 40-60 g of each sample) were prepared for performing the test. The rock lumps were rotated for 10 min in a test drum made of a standard sieve mesh so that slaking products would be finer than 2 mm and pass through the drum. The drum was half immersed in water. The rock pieces retained in the drum were dried at 105 °C for a full day in the oven. Then, they were cooled and weighed. The slake-durability index (Id) corresponding to each cycle of the test was calculated as the percentage ratio of final to initial dry weights of rock lumps in the drum after the cycle. Also, in order to understand the effect of wetting and drying cycles and acid solutions on the durability of the rock samples, the slake-durability test was performed up to ten cycles in different pH conditions. The used slaking fluid were natural water with pH=7 of the region and sulfuric acid solutions with pH of 5.5 and 4 prepared in the laboratory. In fact, there are many polluting gases in the air that one of their most important is sulfur dioxide (SO2). This gas combines with rainfall waters in the air to produce sulfuric acid. We select this acid due to two reasons; 1) it is abundant gas in polluted cities of Iran, 2) if the other acids were selected, the research became very long. So, the authors decided to perform the research with only one acid namely sulfuric acid.
Finally, correlations between the slake-durability index and physical, dynamic and mechanical properties were assessed by regression analyses in different pH conditions. Regression analyses led to new empirical equations for predicting physical and mechanical properties of the studied rocks from the slake-durability index.
Results and discussions
Mineralogical and petrographic properties
The studied rocks are commonly composed of quartz, calcite, aragonite and dolomite. The sandstone samples are dominantly composed of quartz, and calcite with minor dolomite and hematite. Mono crystalline and fine grain quartz (smaller than 0.125 mm) and rhombohedra dolomite are the important textural characteristic of these samples. The limestone samples are dolomitic limestone composed of calcite, dolomite, and quartz. Breccia structure and dolomitic vein with fossil fragments are the textural characteristics of these samples. Mineral composition of the travertines is aragonite, calcite, quartz, and admixture of fluorite and bornite. These samples have a layered texture that is due to the succession of crystalized aragonite and calcite and micritic layers. The travertine samples are porous and dominantly have mixture cement composed of calcite and aragonite. The conglomerate samples are composed of micritic limestone, crystalline calcitic limestone, sandstone and siltstone fragments with calcitic cement. Rock fragments larger than 2 mm with low textural maturity and poor sorting are the most important textural characteristics of the conglomerate samples. Rock types and the modal abundance of the minerals in the rock samples are given in Table 2.
Table 2 Type and mineral composition of the rock
| Sample | Rock type | Mineral content (%) | ||||||
|---|---|---|---|---|---|---|---|---|
| Qtz. | Cal. | Arg. | Dol. | Hem. | Bor. | Other Minerals | ||
| SS1 | Sandstone | 61 | 21 | - | 13 | 2 | - | 3 |
| SS2 | Sandstone | 60 | 25 | - | 10 | 3 | - | 2 |
| SS3 | Sandstone | 59 | 28 | - | 9 | 3 | - | 1 |
| LS1 | Dolomitic limestone | 20 | 55 | - | 21 | 2 | 1 | 1 |
| LS2 | Dolomitic limestone | 20 | 55 | - | 20 | 2 | 1 | 2 |
| LS3 | Dolomitic limestone | 19 | 55 | - | 19 | 4 | 1 | 2 |
| TS1 | Travertine | 8 | 35 | 55 | - | 1 | - | 1 |
| TS2 | Travertine | 10 | 40 | 45 | - | - | - | 5 |
| TS3 | Travertine | 8 | 45 | 45 | - | - | - | 2 |
| TS4 | Travertine | 10 | 40 | 48 | - | - | 1 | 1 |
| TS5 | Travertine | 8 | 40 | 50 | - | - | 1 | 1 |
| TS6 | Travertine | 9 | 40 | 49 | - | - | 1 | 1 |
| CSi | Conglomerate | 42 | 45 | - | 5 | 6 | - | 2 |
| CS2 | Conglomerate | 40 | 45 | - | 3 | 5 | - | 7 |
| CS3 | Conglomerate | 39 | 45 | - | 5 | 4 | - | 7 |
Qtz.: Quartz (SiO2); Cal.: Calcite (CaCO3); Ara.: Aragonite (CaCO3); Dol. Dolomite Ca.Mg(CO3)2; Hem.: Hematite (Fe2O3); Bor.: Bornite (Cu5FeS4)
Physical properties
The average values of specific gravity (Gs), dry density (үdry), saturated density (үsat), water absorption (Wa), and porosity (n) are presented in Table 3. Based on the results, the values of dry density increase in the samples of travertine, sandstone, conglomerate, and limestone, respectively. The values of porosity increase in the samples of limestone, travertine, conglomerate, and sandstones, respectively. In this regard, the samples of TS3 and LS1 have the lowest and highest values of dry density and the TS1 and SS3 samples have the lowest and highest values of porosity, respectively. According to the rock classification suggested by IAEG (1979), most of the samples have moderate dry density and low to medium porosity.
Table 3 Values of physical properties of the rocks
| Sample | Physical properties | Description of үd (IAEG 1979) | Description of n (IAEG 1979) | ||||
|---|---|---|---|---|---|---|---|
| GS | үd (g/ cm3) | (g3 cm3) | Wa (%) | n (%) | |||
| SS1 | 2.49 | 2.44 | 2.53 | 3.69 | 7.58 | Moderate | Medium |
| SS2 | 2.49 | 2.45 | 2.52 | 3.42 | 8.41 | Moderate | Medium |
| SS3 | 2.35 | 2.35 | 2.46 | 4.82 | 10.32 | Moderate | Medium |
| LS1 | 2.66 | 2.61 | 2.67 | 2.32 | 5.80 | High | Medium |
| LS2 | 2.56 | 2.52 | 2.60 | 3.33 | 7.83 | High | Medium |
| LS3 | 2.65 | 2.61 | 2.70 | 1.79 | 4.41 | High | Low |
| TSi | 2.37 | 2.32 | 2.35 | 1.22 | 2.80 | Moderate | Low |
| TS2 | 2.25 | 2.20 | 2.26 | 2.41 | 5.60 | Moderate | Medium |
| TS3 | 2.32 | 2.28 | 2.33 | 1.33 | 4.82 | Moderate | Medium |
| TS4 | 2.30 | 2.26 | 2.30 | 1.84 | 5.04 | Moderate | Medium |
| TS5 | 2.32 | 2.37 | 2.39 | 1.15 | 4.71 | Moderate | Low |
| TS6 | 2.13 | 2.09 | 2.14 | 2.31 | 6.69 | Low | Medium |
| CS1 | 2.56 | 2.51 | 2.57 | 2.25 | 5.44 | Moderate | Medium |
| CS2 | 2.48 | 2.43 | 2.50 | 3.11 | 8.22 | Moderate | Medium |
| CS3 | 2.54 | 2.49 | 2.57 | 3.01 | 6.98 | Moderate | Medium |
Table 4 Values of the dynamic and mechanical properties of the rocks
| Sample | Hs | VP (m/s) | UCS (MPa) | (MPa) | BTS (MPa) | BPS (MPa) |
|---|---|---|---|---|---|---|
| SS1 | 29 | 3854 | 46.29 | 8.85 | 6.67 | 8.15 |
| SS2 | 26 | 3517 | 32.46 | 6.54 | 5.38 | 6.83 |
| SS3 | 24 | 3093 | 16.09 | 5.80 | 3.81 | 5.90 |
| LSi | 36 | 5171 | 50.13 | 10.32 | 7.93 | 9.36 |
| LS2 | 28 | 4672 | 25.19 | 8.20 | 4.76 | 7.83 |
| LS3 | 36 | 5284 | 51.51 | 11.86 | 9.22 | 10.27 |
| TS1 | 30 | 5984 | 31.96 | 9.15 | 7.74 | 6.15 |
| TS2 | 20 | 4198 | 19.37 | 6.28 | 5.08 | 4.25 |
| TS3 | 25 | 5402 | 25.34 | 7.00 | 6.85 | 5.13 |
| TS4 | 29 | 4789 | 28.35 | 8.61 | 7.18 | 6.46 |
| TS5 | 26 | 4707 | 25.89 | 7.54 | 6.19 | 5.50 |
| TS6 | 20 | 3427 | 18.52 | 6.40 | 5.16 | 4.88 |
| CS1 | 27 | 3735 | 26.15 | 8.86 | 4.66 | 6.16 |
| CS2 | 18 | 2931 | 14.97 | 5.16 | 2.97 | 4.99 |
| CS3 | 28 | 3789 | 23.88 | 7.67 | 3.88 | 5.73 |
Dynamic and mechanical properties
The average values of the dynamic and mechanical properties for the rocks are outlined in Table 4. Based on the results, the values of these properties increase in the samples of limestone, sandstone, travertine, and conglomerate, respectively. In this regard, the sample of CS2 has the lowest value and the samples of LS1 and TS1 have the highest value of Schmidt rebound hardness. The values of P-wave velocity range from 2931 to 5984 m/s. The CS2 and TS1 samples have the lowest and highest values of the parameters, respectively. Based on the IAEG (1979) classification, these samples are classified as the rocks with low to very high P-wave velocity. The samples of CS2 and LS3 have the lowest and highest UCS values, equal to 14.97 and 51.51 MPa, respectively. Based ISRM (2007), the tested samples are classified as weak to strong rocks. The CS2 and LS3 samples have the lowest and highest point load index values, equal to 5.16 and 11.86 MPa, respectively. Based on the Broch and Franklin (1972) classification, the tested samples are classified as very strong to extremely strong rocks. Based on the results, CS2 and LS3 samples have the minimum and maximum values of BTS, equal to 2.97 and 9.22 MPa, respectively. The samples of TS2 and LS3 have the lowest and highest values of point load index, equal to 4.46 and 10.27 MPa, respectively. Based on Ulusay et al. (2001), the samples of TS3 and CS2 are weak rocks and the other samples are classified as moderate rocks.
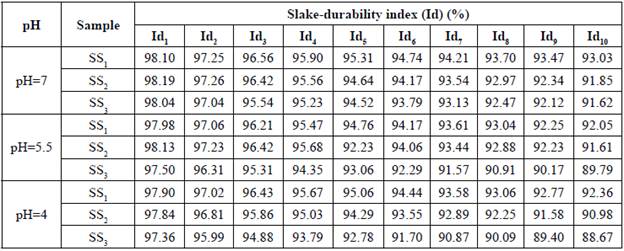
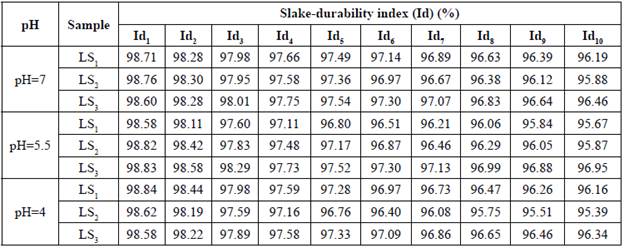
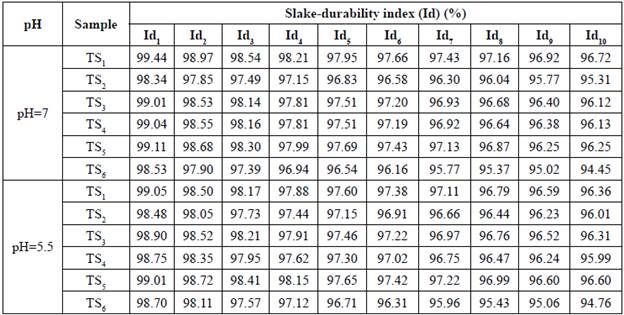
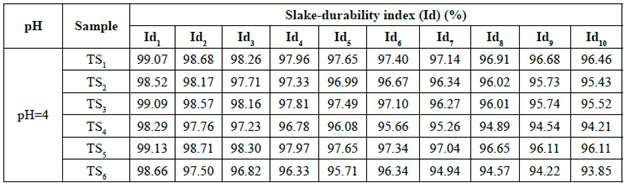
Slake-durability index
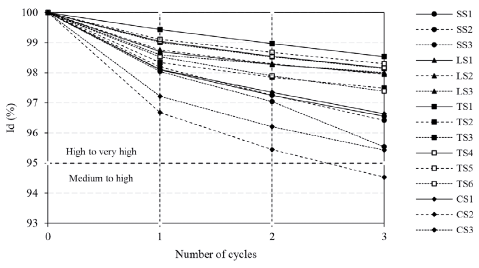
The values of the slake-durability index for the samples of sandstone, limestone, travertine, and conglomerate are outlined in Tables 5, 6, 7 and 8, respectively. Based on the results, the values of the slake-durability index increase in the samples of conglomerate, sandstone, travertine, and limestone, respectively. In this regard, the samples of TS1 and CS2 with slake-durability index equal to 96.72% in pH=7 and 85.85% in pH=4, have the maximum and minimum values of the parameter after ten cycles of the test, respectively. According to the Gamble (1971) classification, the tested samples are classified as durable and very durable rocks after the first cycle of the test (Fig. 1).
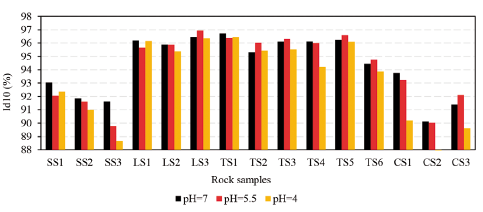
The effect of wetting-drying cycles on the slake-durability index of the studied rock samples in different pH conditions are presented in Figure 2. Also, the results of the 10th cycle of the slake-durability test as comparative diagram are shown in Figure 3. According to these figures, as the number of cycles increased, the values of Id decreased (specimen weight loss increased) for all the rocks. This is similar to the obtained results presented in all researches summarized in Table 1. The decreasing rate of Id in the initial cycles is higher than the end cycles. Also, in more samples, a constant pattern exists between the slake-durability index and pH of the testing solutions so that the Id decreases with decreasing pH from 7 to 4. This is coordinated with the results presented by Kayabali et al. (2006), Ghobadi and Momeni (2011), Ghobadi and Mousavi (2014), Fereidooni and Khajevand (2018), and Fereidooni and Khajevand (2019). This occurs because all the samples have calcite (CaCO3) which is a highly susceptible mineral when to be attacked by acidic agents. It has also been observed that porous travertine TS6 is more susceptible to degradation as compared to the other rock samples. The samples of conglomerate exhibited an entirely different pattern so that the minimum values of the slake-durability index were obtained for these samples in comparison to the other samples which possess a middle range of the slake-durability index. As a matter of fact, the higher values of Id, especially in acid solutions, must represent the higher resistance of a sample to degrade under a given set of conditions. But this is not true for the samples of the conglomerate. Because these samples have weak cement and their rock fragments simply cut out from the rock lumps due to collision and abrasion to each other during the slake-durability test. This lead to obtain low values of Id being obtained in the samples of conglomerate.
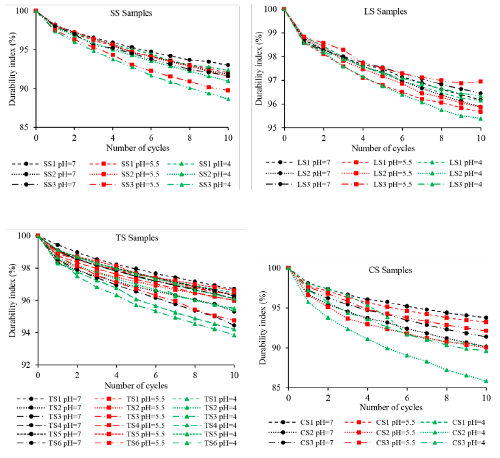
Figure 2 Influences of number of wetting-drying cycles and pH on the slake-durability index of the rocks
XRD analyses
The obtained results from XRD analyses, as shown in Figure 4, indicate that quartz and calcite are the most important minerals in the rock samples. The crystallinity degree of these minerals has been evaluated in the 2θ ranges of 20° and 50°. The mineral composition of the rock samples contains a large amount of quartz, calcite and a small amount of other minerals such as hematite and bornite. Therefore, the thin section mineralogical studies have been confirmed by XRD analyses.
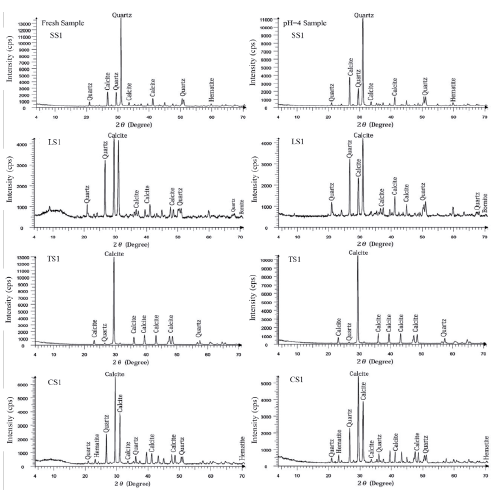
Figure 4 Diffractograms of the fresh samples (left) and the samples under slakedurability test at pH=4 (right)
Mineral composition of the fresh samples and the samples under slake-durability test was approximately similar to each other. The diffractograms for the two states are different only in the intensity of the mineral peaks indicating a decreasing trend of calcite peaks. This means that acid solutions have a specific effect on chemical weathering of the rock's minerals. The sulfuric acid solutions with pH=4 could react with calcite and break it down. This is confirmed by Ghobadi and Momeni (2011), Ghobadi and Mousavi (2014), and Fereidooni and Khajevand (2019). The decrease in peaks of calcite in the diffractograms of the durable rock samples is evidence for this occurrence.
Regression analyses
One of the commonly accepted methods for investigating empirical relationships between different rock properties is regression analysis (Khanlari et al., 2014 a, b; Fereidooni et al., 2015; Ghobadi and Babazadeh, 2015; Fereidooni et al., 2016). Simple regression analyses were performed to develop relationships between slake-durability and physical, index, and mechanical properties of the studied rocks. In addition, the relationships between experimental and calculated results are developed based on equations obtained for the rocks. Although in Momeni et al. (2017) and Monticelli et al. (2020), Id2 is selected to be correlated to the other rock properties, in the present research, the values of Id10 were correlated to the values of physical, index and mechanical properties of the studied rocks. Because the effect of water pH changing from 7 to 4 on Id is more visible after 10 cycles of the slake durability test.
Correlations between the slake-durability index and physical properties
Correlations between Id10 in natural water with pH=7 and physical properties are shown in Figure 5, and the extracted empirical equations between the parameters are presented in Table 9. In this research, the fitting lines are drawn separately for each type of rock sample. Because in this case, a better relationship is obtained between the two variables with a higher determination coefficient (R2). Based on the results, obtained correlation coefficients range from 0.22 to 0.99. The samples of limestone have better correlations than the other samples. The least correlation belongs to the samples of sandstone. Slake-durability index decreases with increasing porosity and water absorption. Therefore, correlations between the parameter and porosity and water absorption are inverse linear. Correlations between experimental and calculated values of dry and saturated density, porosity and water absorption based on the equations for all tested samples are shown in Figures 6 and 7, respectively. For evaluating the validity of the results, the 1:1 relationship (y=x) has been plotted in these figures. It is clear that the lines closely match the line of y=x, which confirms the validity of the equations.
Table 9 Empirical equations between the slake-durability index with porosity and water absorption of the rocks
| Sample | R2 | Equation | x - y |
| SS | R2 = 0.31 | үd = 0.040 Id10 - 1.294 | Id10 - үd |
| R2 = 0.52 | үs = 0.036 Id10 - 0.833 | Id10 - үs | |
| R2 = 0.69 | n = -1.538 Id10 + 150.560 | Id10 - n | |
| R2 = 0.22 | Wa = -0.465 Id10 + 46.839 | Id10 - Wa | |
| LS | R2 = 0.78 | үd = 0.159 Id10 -12.663 | Id10 - үd |
| R2 = 0.97 | үd = 0.174 Id10 - 14.052 | Id10 - үs | |
| R2 = 0.99 | n = -5.913 Id10 + 574.660 | Id10 - n | |
| R2 = 0.98 | W = -2.670 Id10 + 259.270 | Id10 - Wa | |
| TS | R2 = 0.86 | үd = 0.112 Id10 - 8.470 | Id10 - үd |
| R2 = 0.87 | Үs = 0.100 Id10 - 7.313 | Id10 - үs | |
| R2 = 0.84 | n = -1.436 Id10 + 142.570 | Id10 - n | |
| R2 = 0.72 | Wa = -0.583 Id10 + 57.592 | Id10 - Wa | |
| CS | R2 = 0.81 | үd = 0.020 Id10 + 0.618 | Id10 - үd |
| R2 = 0.59 | үs = 0.017 Id10 + 1.007 | Id10- үs | |
| R2 = 0.98 | n = -0.749 Id10 + 75.627 | Id10 - n | |
| R2 = 0.94 | Wa = -0.247 Id10 + 25.455 | Id10 - Wa |
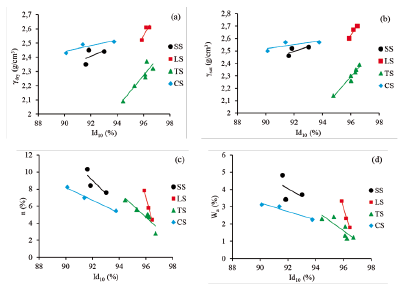
Figure 5 Correlations between the slake-durability index and, a) dry density, b) saturated density, c) porosity and d) water absorption for the rocks
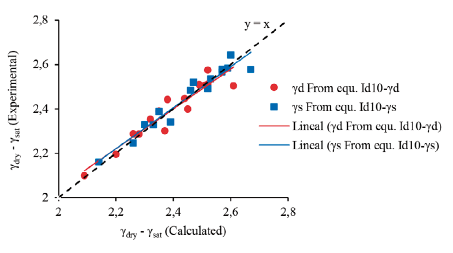
Figure 6 Correlations between experimental and calculated values of dry and saturated densities for the rocks
Correlations between the slake-durability index and index properties
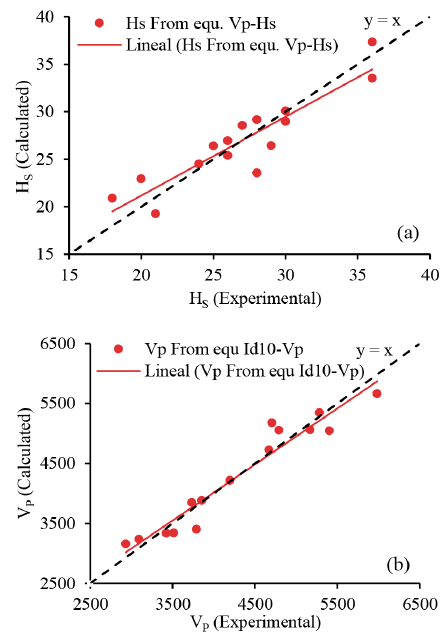
Relationships between the slake-durability index and Schmidt rebound hardness and P-wave velocity are shown in Figure 8. As presented in Table 10, correlation coefficients obtained from the regression analyses range from 0.50 to 0.97. The samples of sandstone have better correlations than the other samples. The least correlation belongs to the samples of the conglomerate. Relations between Id10 in natural water with pH=7, HS and Vp are direct linear in all of the samples. The validity of the obtained equations is characterized by correlations between experimental and calculated values of HS and Vp (Fig. 9). For comparison of the results, a 1:1 relationship (y=x) has been plotted in these figures. It is clear that correlation lines match the line of y=x, which confirms the validity of the equations.
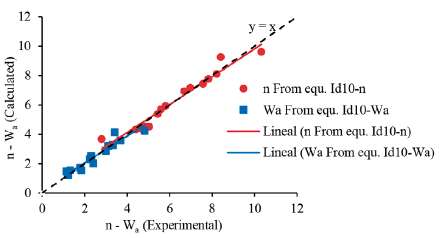
Figure 8 Correlations between the slake-durability index and a) Schmidt hardness rebound, b) P-wave velocity for the rocks
Table 10 Empirical equations between the slake-durability index, Schmidt rebound hardness and P-wave velocity of the rocks
| Sample | R2 | Equation | x - y |
|---|---|---|---|
| SS | R2 = 0.97 | HS = 3.978 Id10 - 339.490 | Id10 - HS |
| R2 = 0.82 | Vp = 456.750 Id10 - 38609.000 | Id10 - Vp | |
| LS | R2 = 0.78 | HS = 14.088 Id10 - 1321.600 | Id10 - HS |
| R2 = 0.91 | Vp = 1068.800 Id10 - 97749.000 | Id10 - Vp | |
| TS | R2 = 0.73 | HS = 4.277 Id10 - 384.740 | Id10 - HS |
| R2 = 0.87 | Vp = 1023.000 Id10 - 93285.000 | Id10 - Vp | |
| CS | R2 = 0.50 | HS = 2.104 Id10 - 168.730 | Id10 - HS |
| R2 = 0.68 | Vp = 189.860 Id10 - 13936.000 | Id10 - Vp |
Correlations between the slake-durability index and mechanical properties
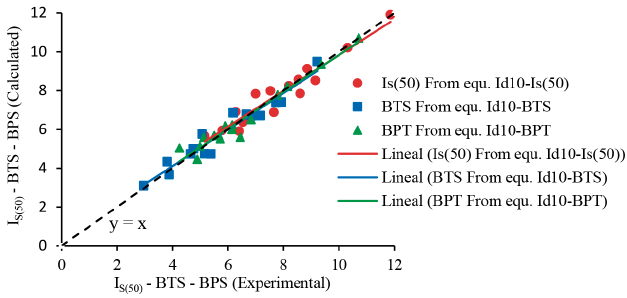
Relationships between the slake-durability index and mechanical properties including uniaxial compressive strength, point load index, Brazilian tensile strength, and block punch strength were performed by regression analyses. Figure 10 shows relationships between Id10 in natural water with pH=7 and the properties. The equations extracted from these relations are direct linear and outlined in Table 11. This means that slake-durability index increases with increasing rock strength in all samples. Moreover, strong correlation coefficients were found between Id10 and the mechanical properties in the range of 0.46 to 1.00. The samples of limestone have better correlations than the other samples. The best and least correlations belong to the samples of limestone and travertine, respectively. The relationships between experimental results and calculated UCS values based on Id10 for all tested rock samples are shown in Figure 11. For comparison of the results, a 1:1 relationship (y=x) has been plotted in this figure. The correlation line shows that the equations are reliable. Also, the relationships between experimental results and calculated values of IS(50), BTS and BpS based on Id10 are shown in Figure 12. It is clear that the three lines match the line of x=y, which confirms the validity of these equations.
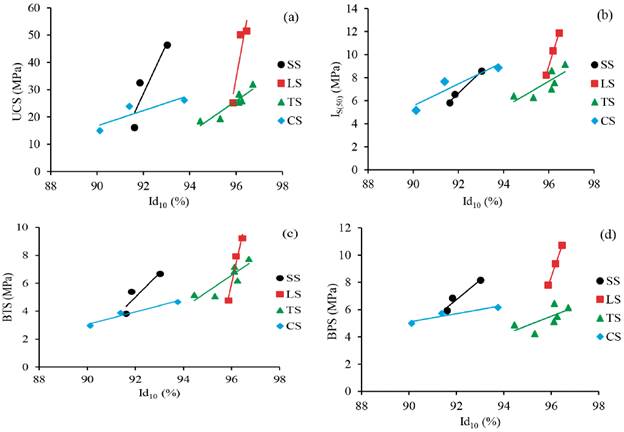
Figure 10 Correlations between the slake-durability index and a) uniaxial compressive strength, b) point load index, c) Brazilian tensile strength, d) Block punch test for the rocks
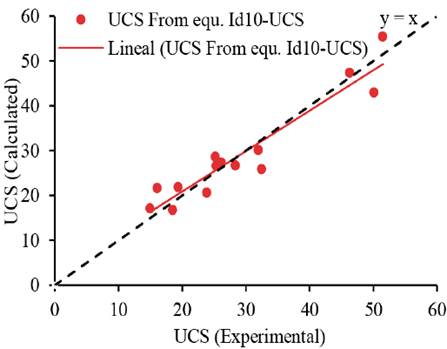
Figure 11 Correlations between experimental and calculated values of uniaxial compressive strength (UCS) for the rocks
Table 11 Empirical equations between the slake-durability index and mechanical properties of the rocks
| Sample | R2 | Equation | x - y |
|---|---|---|---|
| SS | R2 = 0.83 | UCS = 18.252 Id10 - 1650.600 | Id10 - UCS |
| R2 = 0.99 | IS(50) = 1.870 Id10 - 165.360 | Id10 - IS(50) | |
| R2 = 0.83 | BTS = 1.723 Id10 - 153.520 | Id10 - BTS | |
| R2 = 0.93 | Bps = 1.435 Id10 - 125.310 | Id10 - Bps | |
| LS | R2 = 0.82 | UCS = 46.24 Id10 - 4404.800 | Id10 - UCS |
| R2 = 0.99 | IS(50) = 6.323 Id10 - 598.030 | Id10 - IS(50) | |
| R2 = 0.96 | BTS = 7.7520 Id10 - 738.250 | Id10 - BTS | |
| R2 = 1.00 | Bps = 5.052 Id10 - 476.600 | Id10 - Bps | |
| TS | R2 = 0.86 | UCS = 5.898 Id10 - 539.600 | Id10 - UCS |
| R2 = 0.64 | IS(50) = 1.149 Id10 - 102.620 | Id10 - IS(50) | |
| R2 = 0.76 | BTS = 1.166 Id10 - 105.330 | Id10 - BTS | |
| R2 = 0.46 | Bps = 0.679 Id10 - 59.663 | Id10 - Bps | |
| CS | R2 = 0.77 | UCS = 2.802 Id10 - 235.470 | Id10 - UCS |
| R2 = 0.87 | IS(50) = 0.952 Id10 - 80.084 | Id10 - IS(50) | |
| R2 = 0.95 | BTS = 0.447 Id10 - 37.186 | Id10 - BTS | |
| R2 = 0.90 | Bps = 0.304 Id10 - 22.231 | Id10 - Bps |
Conclusion
In this study, an attempt has been made to investigate the durability properties and geotechnical characteristics of the selected rock samples and correlated slake-durability index to physical, dynamic, and mechanical properties of the rocks. These rocks are dominantly composed of calcite and quartz and they are classified as weak to strong rocks based on UCS. Slake-durability test was carried out up to ten cycles in natural water with pH=7 and sulfuric acid solutions with pH of 5.5 and 4. The decreasing rate of the slake-durability index in initial cycles was higher than the other cycles. This means specimen weight losses were increased with decreasing water pH from 7 to 4. There were found linear relationships between the slake-durability index and different physical properties, with various correlation coefficients. Inverse linear equations exist between Id and porosity and water absorption but direct linear equations were found between the slake-durability index and dry and saturated densities. Correlations between the slake-durability index with Schmidt rebound hardness and p-wave velocity were direct linear. Correlations between the slake-durability index and the mechanical properties including uniaxial compressive, point load, Brazilian tensile, and block punch strengths have shown that the values of the slake-durability index have directly linear relations with the parameters.

