SciELO - Scientific Electronic Library Online

 
vol.13 issue25Hydrogen Production and Purification by Bioethanol Steam Reforming and Preferential Oxidation of CO author indexsubject indexarticles search
Home Pagealphabetic serial listing  

Services on Demand

Journal

Article

Indicators

Related links

  • On index processCited by Google
  • Have no similar articlesSimilars in SciELO
  • On index processSimilars in Google

Share


Tecciencia

Print version ISSN 1909-3667

Tecciencia vol.13 no.25 Bogotá July/Dec. 2018  Epub June 20, 2019

https://doi.org/10.18180/tecciencia.2018.25.8 

Articles

Comparative Analysis of the Weibull Model and Observed Wind Data in the City of Floridablanca, Colombia

Análisis Comparativo del Modelo de Weibull y Datos Observados del Viento en la Ciudad de Floridablanca, Colombia

Emil Hernández Arroyo1  * 

Edwin Córdoba Tuta1 

Gabriel García Sánchez1 

1 Ingeniería Mecánica, Universidad Pontificia Bolivariana, Bucaramanga, Colombia.


Abstract

The main objective of this article is to evaluate the wind resource in the city of Floridablanca, Colombia. In Colombia, the supply of electrical energy comes mainly from hydroelectric mega-power stations, presenting generation problems in times of drought. The wind resource is an adequate alternative to diversify the electricity supply in the country. To analyze the characteristics of the wind, recorded measurements were carried out, every 15 minutes at a height of 30 m, throughout the year 2016, at a meteorological station located in Floridablanca, Colombia. In this study we present a statistical analysis of the wind characteristics in Floridablanca, Colombia, we applied a Weibull distribution of two parameters to model the wind speed and thus determine the wind potential. The average annual speed was 0.72 m/s with a standard deviation of 0.61 m/s. The monthly Weibull scale parameter varied from 0.52 m/s to 0.91 m/s, the monthly parameter varied from 0.98 to 1.37. The highest power density observed was 0.35 w/m2 in the months of February and August, the monthly average power density was 0.23 w/m2 which indicates a very poor wind potential considering that they are considered good wind potentials greater than 500 w/m2. This study contributes to evaluate the wind potential of Floridablanca, Colombia, and can be used, methodologically, to quantify the wind potential with possibilities of generating electric power in any part of the country.

Keywords: Wind Potential; Weibull Parameter; Statistical Analysis; Frequency Distribution

Resumen

El principal objetivo de este artículo es evaluar el recurso eólico en la ciudad de Floridablanca, Colombia. En Colombia el suministro de energía eléctrica proviene fundamentalmente de las Megacentrales hidráulicas, presentando problemas de generación en épocas de sequía. El recurso eólico es una adecuada alternativa para diversificar el suministro de electricidad en el país. Para analizar las características del viento se llevaron a cabo mediciones registradas, cada 15 minutos a 30 m de altura, durante todo el año 2016, en una estación meteorológica ubicada en Floridablanca, Colombia. En este estudio se presenta un análisis estadístico de las características del viento en Floridablanca, Colombia, se aplicó una distribución de Weibull de dos parámetros para modelar la velocidad del viento y así determinar el potencial eólico. La velocidad promedio anual fue 0.72 m/s con una desviación estándar de 0.61 m/s. El parámetro de escala de Weibull mensual varió desde 0.52 m/s a 0.91 m/ s, el parámetro de forma mensual varió desde 0.98 a 1.37. La mayor densidad de potencia observada fue de 0.35 w/m2 en los meses de febrero y agosto, la densidad de potencia promedio mensual fue 0.23 w/m2 lo que indica un potencial eólico muy pobre teniendo en cuenta que se consideran buenos potenciales eólicos mayores a 500 w/m2. Este estudio contribuye a evaluar el potencial eólico de Floridablanca, Colombia, y se puede usar, metodológicamente, para cuantificar el potencial eólico con posibilidades de generar potencia eléctrica en cualquier parte del país.

Palabras clave: Potencial Eólico; Parámetros de Weibull; Análisis Estadístico; Distribución de Frecuencia

1. Introduction

With the accelerated development of the global economy and the energy dependence on fossil fuels, concerns have been generated since they are not renewable energy sources [1]. Wind energy is being widely implemented worldwide due to its non-polluting characteristics [2].

Numerous investigations have been carried out in relation to the statistical analysis of wind characteristics. Xiangyun Qing [3], performed a statistical analysis of the characteristics of wind energy in Santiago Island, Cape Verde. The study presents an analysis of wind power and speed data in 2014, using a Weibull distribution of two parameters to model the wind speed and determine the wind potential in Santiago Island, Cape Verde. The average annual wind speed was 8.57 m/s with a standard deviation of 3.29 m/s. The average annual power density obtained was 560.94 W/m2 showing that Santiago Island has a good wind potential.

Chaurasiya P., Ahmed S., Warudkar V. [4], performed a comparative analysis of the weibull parameters using measurement techniques with meteorological towers (Met Mast) and remote measurement techniques SODAR (Sound Detection and Ranging) and LIDAR (Light Detection and Ranging), obtaining an acceptable level of equivalence between both measurement techniques. Previous studies show an excellent agreement and high correlation between the measurements of remote instruments (SODAR & LIDAR) and meteorological towers (Met Mast) [5] [6] [7] [8] [9] [10] [12] [13].

Hernández Q., Espinosa F., Saldaría R., Rivera C. [14], made an evaluation of the wind potential for the generation of electric power in the state of Veracruz, Mexico. This study was carried out in 16 anemometric stations at 50 m height, obtaining an annual average, in the wind speed in some regions, of 5.45 m/s and the study indicates that installing a wind turbine for each studied area, electric power is supplied to the network of 10694 MWh/year.

Wind speed is the most important parameter in the design and study of wind energy conversion systems [15] [16] [17] [18] [19] [20]. Akpinar E. K. and Akpinar S. [15], conducted a study of hourly wind speed data, in Keban-Elazig, Turkey, to derive the probability density function (PDF) and identify distribution parameters.

They applied two probabilistic models, Weibull and Rayleigh, to study the wind potential of the place. One conclusion of the study is that the Weibull distribution gave better estimates, in power density, than the Rayleigh distribution.

In practice, it is very important to describe the variation of the wind speed to optimize the designs of the systems and thus have lower costs in the generation of energy [15].

The main objective of this study is to perform a statistical analysis of the wind speed data in Floridablanca, Colombia, in order to predict the resulting energy in a wind system. To measure evaporative heat condensation is to quantify the volume of distillate and multiply by the evaporation latent heat [7].

2. Methodology

2.1 Weibull probability density function

The Weibull distribution is the most commonly applied model to represent the distribution of wind speed because of its simplicity and ability to assume characteristics of different distributions [3]. The probability density function [PDF] of the Weibull distribution is given by:

Where f (v) is the probability of observing a wind speed v, k is the Weibull shape parameter without dimensions and c represents the Weibull scale parameter in units of wind speed.

2.2 Accumulated distribution of Weibull

The Weibull cumulative distribution function [CDF] is defined by:

2.3 Calculation of Weibull parameters with the graphic method

The Weibull parameters can be calculated using the graphical method [21] [22] [23], applying the natural logarithm function on both sides of the Eq. 2 and obtaining.

Considering:

The linear equation is obtained:

If a linear regression analysis is performed, k is the slope and:

2.4 Average speed with the Weibull model

The average wind speed v m can be calculated using the Weibull parameters estimated according to:

Where Γ(x) is the gamma function of x.

The gamma function can be obtained by means of data approximation [24] [25], with a polynomial regression function, represented by:

2.5 Standard deviation with the Weibull model

The standard deviation of the wind speed can be calculated with:

3. Results and Discussion

3.1 Analysis of experimental wind speed

In this study, wind speed data were recorded in Floridablanca, Colombia, in 2016. Based on this data, the wind speed was processed using the SPSS software (Statistical Package for Social Science). SPSS is a computer statistical program widely used in social and applied sciences, in addition to market research companies. The original name corresponded to the acronym of Statistical Package for the Social Sciences (SPSS), reflecting the orientation to its original market (social sciences).

The power density [Pd] of the wind that flows at a speed [v], through the blades of a wind turbine that sweeps an area A, increases with the cube of the speed according to:

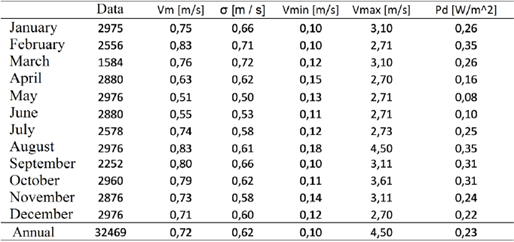
Where p is the air density with an approximate value of 1.225 kg/m3. In Table 1 it is observed that the highest wind speed occurs in the month of August with a value of 4.5 m/s and a power density of 0.35 w/m2 which is a very low wind potential. Throughout the year, the average monthly speed is low with values between 0.51 and 0.83 m/s for the month of May and August respectively.

Table 1 Observed values of wind characteristics and wind potential are presented such as: average speed, standard deviation, minimum speed, maximum speed and power density [Pd = Power/Area] respectively. 

3.2 Analysis of wind speed with the Weibull distribution

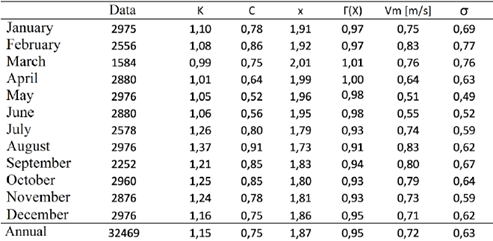
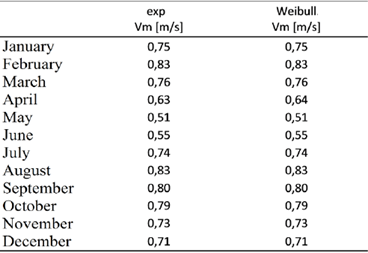
The average speed estimated by the Weibull model (see Table 2) is very close to the experimental data, only in the month of April it presents a variation of 0.01 m/s with a value of 0.63 m/s for the experimental data and of 0.64 m/s for the Weibull model (see Table 3).

Table 2 Characteristics of wind speed with the Weibull model. 

Table 3 Comparison of average monthly speed. 

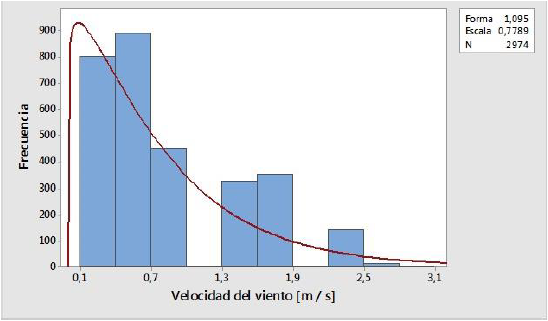
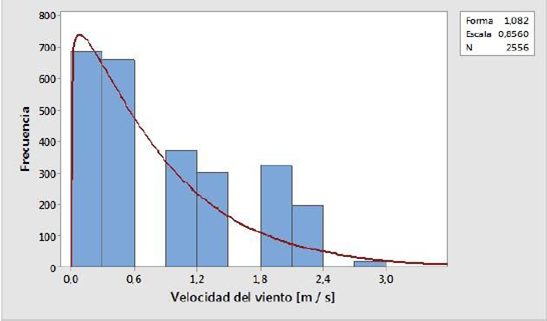
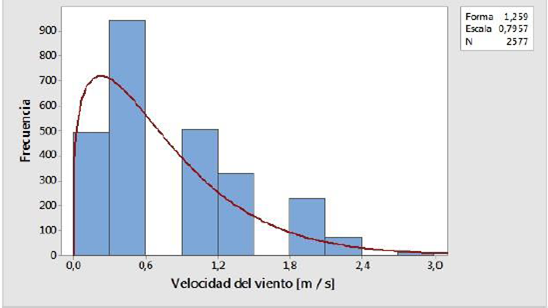
Figures 1, 2 and 3 show the distributions of the wind speed in the months of January, February and July respectively of the year 2016 in the city of Floridablanca, Colombia. It is important to note that the Weibull model is a good approximation to the distribution of wind speed in different months because the trend in frequency values is followed.

Figure 1 Distribution of wind speed in the month of January with Weibull approximation. 

Figure 2 Distribution of wind speed in February with Weibull approximation. 

Figure 3 Distribution of wind speed in the month of July with Weibull approximation. 

The monthly analysis also shows that most of the time (70% of the data in the month of January) the speed is less than 1 m/s.

4. Conclusions

In the present study, the wind speed data measured every fifteen minutes in Floridablanca, Colombia, were analyzed statistically. The data have allowed to determine the distribution of wind speed and power density on a monthly basis.

The meteorological station located in Floridablanca, Colombia, has very poor wind speed characteristics if it is intended to generate electricity. This is evidenced by the low values of power density for the all year.

The average value of the annual power density is 0.23 W/m2. Therefore, this site is not suitable, at any level, for electric power generation applications based on wind energy.

The Weibull distribution is a good approximation as a probability density distribution for the whole year with a correlation coefficient AD = 0.79.

References

1. Mark ZJ, Delucchi A: Providing all global energy with wind, water, and solar power, Part I: Technologies, energy resources, quantities and areas of infrastructure, and materials. Energy Policy 2011, 39:1154-1169. [ Links ]

2. Haralambos S. Bagiorgas, Mihalakakou Giouli, Shafiqur Relman, Luai M. Al-Hadhrami, Weibull parameters estimation using four different methods and most energy carrying wind speed analysis, Int. J. Green Energy 8 (6) (2011) 529-554. [ Links ]

3. Qing X, Statistical analysis of wind energy characteristics in Santiago Island, Cape Verde, Renewable Energy (2017), doi: 10.1016/j.renene.2017.08.077. [ Links ]

4. Chaurasiya P, Ahmed S, Warudkar V, Comparativeanalysis of weibull parameters for wind data measured from met-mast and remote sensing techniques, Renewable Energy 115 (2018) 1153-1165. [ Links ]

5. Vogt S, Thomas P, SODAR- A useful remote sounder to measure wind and turbulence, J. Wind Eng. Ind. Aerodynamics 54/55 (1995) 163-172. [ Links ]

6. Barthelmie R, Folkerts I, Ormel F, Sanderhoff P, Eecen P, Stobbe O, Nielsen N, Offshore wind turbine wakes measured by Sodar, J. Atmos. Ocean. Technol. 20 (2002) 466-477. [ Links ]

7. Seguro J, Lambert T, Modern estimation of the parameters of the Weibull wind speed distribution for wind energy analysis. J. Wind Eng. Ind. Aerodynamics 85 (2000) 75-84. [ Links ]

8. Deaves D, Lines I, On the fitting of low mean wind speed data to the Weibull distribution, J. Wind Eng. Ind. Aerodynamics 66 (3) (1997) 169-178. [ Links ]

9. Smith A, Harris M, Coffey S, Mikkelsen T, Jorgensen E, Mann J, Regis D, Wind lidar evaluation at the Danish wind test site in Hovsore, Wind Energy 9 (2006) 87-93. [ Links ]

10. Justus C, Hargraves W, Mikhail A, Graber D, Methods for estimating wind speed frequency distribution, J. Appl. Meteorol. 17 (1977) 350-353. [ Links ]

11. Lang S, Mckeogh, LIDAR and SODAR measurements of wind speed and direction in upland terrain for wind energy purposes, Remote Sens. 3 (9) (2011 Aug 25) 1871-1901. [ Links ]

12. Pena A, Hasager B, Gryning S, Courtney M, Loannis A, Mikkelsen T, Offshore wind profiling using light detection and ranging measurements, Wind Energy 12 (2009) 105-124. [ Links ]

13. Kumer V, Reuder J, Furevik B, A comparison of LIDAR and radiosonde wind measurements, Energy Procedia 53 (2014) 214-220. [ Links ]

14. Hernández Q, Espinosa F, Saldaña R, Rivera C. Evaluación del potencial eólico para la generación de energía eléctrica energía eléctrica en el estado de Veracruz, México, Dyna 171 (2012) 215-221. [ Links ]

15. Akpinar E K, Akpinar S. A statistical analysis of wind speed data used in installation of wind energy conversion systems. Energy Conversion and Management 2005, 46:515-532. [ Links ]

16. Carta J A, Ramirez P, Velázquez S. A review of wind speed probability distributions used in wind energy analysis Case studies in the Canary Islands. Renewable and Sustainable Energy Reviews 2009, 13:933-955. [ Links ]

17. Boudia S M, Guerri O. Investigation of wind power potential at Oran, northwest of Algeria. Energy Conversion and Management 2015, 101:644-657. [ Links ]

18. Kõse R. An evaluation of wind energy potential as a power generation source in Kütahya, Turkey. Energy Conv Mgmt 2003;45:1631-41. [ Links ]

19. Celik A N. A statistical analysis of wind power density based on the Weibull and Rayleigh models at the southern region of Turkey. Renew Energy 2003;29:593-604. [ Links ]

20. Celik A N. Weibull representative compressed wind speed data for energy and performance calculations of wind energy systems. Energy Conv Mgmt 2003;44:3057-72. [ Links ]

21. Chang Tian Pau, Performance comparison of six numerical methods in estimating Weibull parameters for wind energy application, Appl. Energy 88 (2011) 272-282. [ Links ]

22. Arslan Talha, Y.M. Bulut, A.A. Yavuz, Comparative study of numerical methods for determining Weibull parameters for wind energy potential, Renew. Sustain. Energy Rev. 40 (2014) 820-825. [ Links ]

23. Tatiane C. Carneiro, Sofia P. Melo, Paulo C.M. Carvalho, Arthur Plinio de S. Braga, Particle Swarm Optimization method for estimation of Weibull parameters: a case study for the Brazilian northeast region, Renew. Energy 86 (2016) 751-759. [ Links ]

24. Weisser D, A wind energy analysis of Grenada: an estimation using the 'Weibull' density function, Renew. Energy 28 (2003) 1803-1812. [ Links ]

25. Odo F. C, Akubue G. U, Comparative assessment of three models for estimating Weibull parameters for wind energy applications in Nigerian location, Int. J. Energy Sci. 2 (1) (2012) 22-25. [ Links ]

How to cite: Arevalo J. D., Martinez, A., Vargas, J., Cordoba, L. F., Hydrogen Production and Purification by Bioethanol Steam Reforming and Preferential Oxidation of CO, TECCIENCIA, Vol. 13 No. 25, 55-64, 2018. DOI: http://dx.doi.org/10.18180/tecciencia.2018.25.7

Received: July 25, 2018; Accepted: September 10, 2018; other: September 30, 2018

* Corresponding Author. E-mail: jdarevaloa@unal.edu.co

Creative Commons License This is an open-access article distributed under the terms of the Creative Commons Attribution License