


 English (pdf)
 Article in xml format
 Article references
 Send this article by e-mail
 Cited by SciELO
  Cited by Google
  Similars in
SciELO
Similars in
SciELO  Similars in Google
 Permalink
INTRODUCTION
Thermal levels intervene partially and, in some cases totally, in the development of several crops (Kukal and Irmak, 2018; Shivers et al., 2019). Phenology studies the beginning and ending dates of different phases of plant development by recording them in chronological order and making these observations in many places over several years to obtain reliable data (Salazar-Gutierrez et al., 2013; Parra-Coronado et al., 2015). It is important to record quantitative data related to development such as size, weight, volume, chemical composition, and obtained yield (Woznicki et al., 2019).
According to Quintero (n.d.), phenological research establishes useful conclusions since it estimates the probable dates of development, subperiods and occurrence of biological changes. It is important to know the beginning and end of phenological stages because they are indicators of crop development, elucidate the adaptation of species in certain conditions, and inform decision on which practices can be carried out (Parra-Coronado et al., 2015).
Generally, calendar time is the most widely used for the prediction of crop growth and development. Several models have been proposed to improve the interpretation of calendar time, which describes the effect of temperature on phenological development (Parra-Coronado et al., 2015). The more recognized and used methods include the accumulation of mean daily temperature, generally found above the base temperature for each phenological stage, known as thermal time or growing degree days (GDD), heat units or physiological time (Parra-Coronado et al., 2015). It is defined as the amount of degree days needed to finish a phenological phase (Dar et al., 2018). Plants have specific temperature requirements for each phenological stage (Piao et al., 2019).
According to Parra-Coronado et al. (2015), there are different methods to calculate GDD but the most widely used in agricultural and phenological research is calculating it as the sum of the difference between mean temperature and Tb, where the mean temperature is calculated as the mean of daily minimum and maximum temperatures (Lizaso et al., 2018). The GDD method is the most accurate method for describing development because it is independent of environmental conditions and calendar time (Salazar-Gutierrez et al., 2013; Parra-Coronado et al., 2015). For the determination of GDD, it is essential to determine the critical temperature or base temperature (Tb), below which there will be no phenological development, and, therefore, plant metabolic processes cease (Parra-Coronado et al., 2015; Wozniki et al., 2016). The accuracy in the use of thermal time to predict the date of appearance of different phenological stages depends partially on the accuracy with which the base temperature is determined (Salazar-Gutierrez et al., 2013; Parra-Coronado et al., 2015).
For Parra-Coronado et al. (2015), the base temperature is different for each stage of development, albeit sometimes similar between any given period. Several statistical methods can be used to estimate the Tb in GDD, such as: least standard deviation (SD), least SD in days, least variance (VAR), least coefficient of variation (CV) and linear regression using the regression coefficient and x-intercept methods. Statistically, the base temperature results in the lowest variance of GDD (thermal or physiological time) accumulation, which is a measure of the heat that has accumulated over time (Salazar-Gutierrez et al., 2013; Parra-Coronado et al., 2015; Akbar, 2019). Accumulated temperature is now recognized by different authors as the principle factor influencing phenology variation; phenological development becomes faster as temperatures increase, which implies that the growing period will be shorter (Dugalic et al., 2018). Various research has shown that the GDD accumulated to reach different phenological stages differs from cultivar to cultivar (Dar et al., 2018).
Different authors have estimated thermal accumulation requirements, taking into account the base temperature (Tb) needed to reach different phenological stages in crops such as wheat (Salazar-Gutierrez et al., 2013), peach (Pinzón-Sandoval et al., 2021, 2022), plum (Shivers et al., 2019), apple (Cepeda et al., 2021), feijoa (Parra-Coronado et al., 2015), uchuva (Syropoulou et al., 2022), lulo (Criollo-Escobar et al., 2020), grafted tomato (Ramírez-Jiménez et al., 2021) and quinoa (Anchico-Jojoa et al., 2021).
The plum is a promising crops for the Department of Boyaca and for the municipality of Nuevo Colon, with production areas between 1,800 and 2,300 m a.s.l. (González, 2021). The fruit is currently used to produce sweets, preserves, and pulp, and new markets are expected, both nationally and internationally.
The objective of this study was to determine the base temperature of the phenological period between fruit set and fruit at harvest for ‘Horvin’ plums (Prunus salicina Lindl.), as well as to determine the thermal or physiological time (GDD) for this period.
MATERIALS AND METHODS
Localization and characterization of the study areas
This study was conducted in four zones in the municipality of Nuevo Colon, Boyaca, Colombia. The study zones had rootstocks of peach trees grafted with Horvin variety plum scions (Prunus salicina Lindl.), planted in different years. Ten trees were taken each from two rows per location, for a total of 80 trees for the study. The evaluations were carried out in two consecutive harvests. The locations are described in table 1.
Table 1. Location of the studies.
| Locality | Altitude (m) | Latitude | Longitude | RH (%) | Maximum temperature (°C) | Minimum temperature (°C) |
|---|---|---|---|---|---|---|
| Locality 1 | 2,449 | 5º21'25.61” N | 73º27'41.51” O | 64.5 | 28.7 | 7.3 |
| Locality 2 | 2,285 | 5º20'32.79” N | 73º27'47.41” O | 68.3 | 29.1 | 8.2 |
| Locality 3 | 2,215 | 5º20'21.33” N | 73º27'49.32” O | 70.2 | 29.2 | 9.3 |
| Locality 4 | 2,195 | 5º20'17.56” N | 73º27'53.85” O | 73.8 | 30.7 | 9.5 |
The municipality of Nuevo Colon is characterized by a humid cold climate, B2d B1 with the Thornthwaite classification, with a mean temperature between months of 8°C and between the coldest and warmest months of 22°C. The relative humidity is high, reaching a maximum of 87% and a minimum of 35% at higher altitudes. Precipitation in this zone is monomodal, with mean annual precipitation values of 907.2 mm, concentrated in the months of April to July (González, 2021).
The first part of this study consisted of determining the base temperature (Tb) for the phenological period between fruit set and harvest for the ‘Horvin’ plum. The second part of the study estimated the duration in growing degree days (GDD) of the phenological period, used to determine more precisely the harvest date in different productive periods. Fruit set and harvest dates (actual harvest day) were recorded, as well as daily meteorological data (relative humidity, temperature, precipitation), including maximum and minimum temperatures (ºC), for each location.
Fruit set and harvest occurrence dates were obtained from the four locations in the Department of Boyaca, Colombia (Tab. 2) in 2015 and 2016.
Table 2. Record dates for the phenological stage of fruit set and harvest for plum variety Horvin in the municipality of Nuevo Colon (Boyaca).
| Stage | Locality 1 (2,449 m a.s.l.) | Locality 2 (2,285 m a.s.l.) | Locality 3 (2,215 m a.s.l.) | Locality 4 (2,195 m a.s.l.) |
|---|---|---|---|---|
| Fruit set (harvest 1) | September 10 - 2015 | September 12 - 2015 | September 3 - 2015 | September 12 - 2015 |
| Fruit harvest (harvest 1) | December 1 - 2015 | December 6 - 2015 | November 18 - 2015 | December 2 - 2015 |
| Fruit set (harvest 2) | April 8 - 2016 | April 11 - 2016 | March 8 - 2016 | April 16 - 2016 |
| Fruit harvest (harvest 2) | June 26 - 2016 | July 21 - 2016 | May 18 - 2016 | July 6 - 2016 |
The date of appearance of fruit set was 17 d after observing the fruit budbreak. Temperature and relative humidity records were taken every 10 min, with an Extech thermo-hygrometer (RTH 10) (Extech Instruments, Woburn, MA), with a storage capacity of up to 16,000 relative humidity and 16,000 temperature data, with the measurement scales of 0 to 100 %RH and -40 to +70°C. Precipitation data were obtained with 50 mm capacity Tildenet® rain gauges (Buckingham, UK).
Base temperature estimation (Tb)
Tb was estimated for a phenological stage in plums, from fruit set to harvest. To estimate Tb, the methodology reported by Parra-Coronado et al. (2015) was used, which consists of using statistical methods, where the minimum variation of the coefficient of variation and variance or standard deviation of the accumulated heat quantities (GDD) during the phenological stage were determined, using a temperature range of 0 to 12°C. Tb is the temperature at which the minimum variation of the statistical parameter is obtained using the Solver tool for Excel®, with a second-degree regression model. Solver is a tool used to solve linear programming problems, which executes the first estimation with values assigned to the initial parameters of the equation, decreasing, or increasing the value until the minimum of the sum of the squares of the standard deviations is found (Parra-Coronado et al., 2015).
Thermal time estimation (GDD)
Thermal time or growing degree days (GDD) combines time and temperature in the development of any living organism, where temperature increases, and the duration of cycles generally decreases. Thermal time is expressed as the number of heat units required to complete a development process (Parra-Coronado et al., 2015) and is used to predict the ripening date of deciduous fruits (Shivers et al., 2019). According to several authors, physiological time remains relatively constant, even if the temperature and number of days to go from one phenological stage to another vary, with GDD being the simplest model that considers the effect of temperature on development (Parra-Coronado et al., 2015; Du Plessis et al., 2020).
A degree day is accumulated when the mean daily temperature is one degree above Tb for a 24-h period (Parra-Coronado et al., 2015). The experiment phase started when fruit set became visible at each location and for each crop.
To estimate GDD, the methodology of Parra-Coronado et al. (2015) was used, which consists of summing the difference between the mean daily temperatures recorded during the phenological period and the base temperature (Tb), for which equations 1, 2, 3 and 4 were used.
Where, TT was the thermal time (ºCd) accumulated during the n days until the fruit set to harvest stage appears, Ti mean daily temperature (ºC) for day i and Tb the base temperature (ºC). The GDDs for TT accumulation were calculated using the following:
Where, Tmax was the maximum temperature (ºC) for day i, and Tmin was the minimum temperature (ºC) for day i.
With the estimated Tb, the thermal time (GDD) required to go from fruit set to harvest was obtained for each crop and for each location, which were averaged.
RESULTS AND DISCUSSION
During the harvests in locality 1, a mean temperature of 16.41ºC, mean relative humidity of 63.65% and total accumulated precipitation of 468.11 mm were recorded. At location 2, a mean temperature of 18.45ºC, a mean relative humidity of 68.05% and a total accumulated precipitation of 164.65 mm were recorded. At location 3, the mean temperature was 19.81ºC, mean relative humidity was 70.00%, and total accumulated precipitation was 204.71 mm. At location 4, a mean temperature of 20.21ºC, a mean relative humidity of 72.27% and a total accumulated precipitation of 192.65 mm were recorded (Tab. 3).
Table 3. Climatic conditions of the localities from fruit set to harvest ‘Horvin’ plum.
| Locality | Altitude (m a.s.l.) | Mean temperature (°C) | Mean relative humidity (%) | Accumulated precipitation (mm) |
|---|---|---|---|---|
| Harvest 1 | ||||
| Locality 1 | 2,449 | 16.7 | 64.5 | 44.41 |
| Locality 2 | 2,285 | 18.54 | 68.3 | 25.50 |
| Locality 3 | 2,215 | 20.5 | 70.2 | 29.50 |
| Locality 4 | 2,195 | 21.34 | 73.8 | 39.50 |
| Harvest 2 | ||||
| Locality 1 | 2,449 | 16.12 | 62.8 | 293.20 |
| Locality 2 | 2,285 | 18.36 | 67.8 | 303.80 |
| Locality 3 | 2,215 | 19.11 | 69.8 | 379.92 |
| Locality 4 | 2,195 | 19.07 | 70.74 | 345.80 |
Base temperature estimation (Tb)
The values for variance and standard deviation were similar: 2.91°C (R 2=1) and 2.90°C (R 2=0.98); the coefficient of variation was 1.6°C (R 2=0.96), with which the data that best fit the statistical method of variance with Tb=2.9 for the four locations were determined (Fig. 1, 2 and 3).
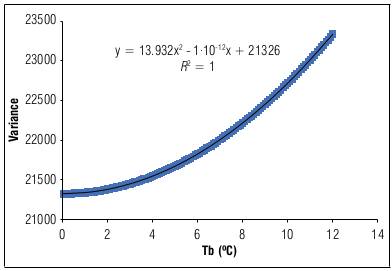
Figure 1. Base temperature (Tb) from fruit set to ripe plum fruit estimated with statistical variance method, from the calculated heat quantities (GDD).
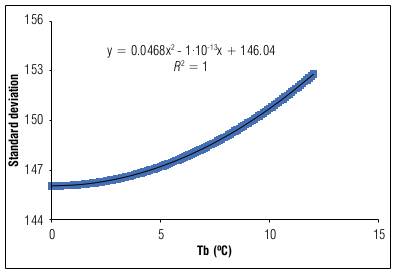
Figure 2. Base temperature (Tb) from fruit set to ripe plum fruit estimated with statistical method standard deviation, from the calculated heat quantities (GDD).
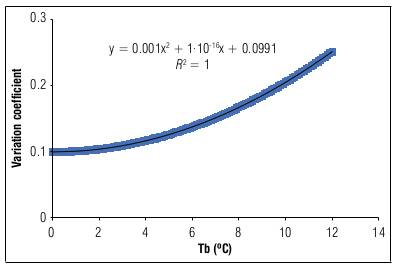
Figure 3. Base temperature (Tb) from fruit set to ripe plum fruit estimated with statistical methods coefficient of variation of calculated heat quantities (GDD).
Considering the Tb for the period from fruit set to fruit harvest, the plum crop requires a mean of 1,528.4 GDD, but the time to reach harvest varied by locality. However, the differences were not significant between localities; a variation of approximately 1 to 3 d was found (Tab. 4). Locality 1 had a duration of 79.5±1.0 d, while locality 2 had 79 d with a probability of being delayed or advanced from 1 to 6 d. Locality 3 had a duration of 82 d with a probability of being delayed or advanced from 2 to 3 d, and locality 4 had the same duration.
Table 4. Thermal time (GDD) and calendar time (days) for the phenological period between fruit set and harvest.
| Tb (ºC) | Thermal time (ºC d±SD) | Calendar time (d) | ||||||
|---|---|---|---|---|---|---|---|---|
| Locality 1 (2449 m a.s.l.) | Locality 2 (2,285 m a.s.l.) | Locality 3 (2,215 m a.s.l.) | Locality 4 (2,195 m a.s.l.) | Locality 1 (2,449 m a.s.l.) | Locality 2 (2,285 m a.s.l.) | Locality 3 (2,215 m a.s.l.) | Locality 4 (2,195 m a.s.l.) | |
| 2.9 | 1,382.1±4.5 | 1,382.8±13.4 | 1,622.0±21.3 | 1,726.8±2.8 | 79.5±1.0 | 79.0±6.0 | 82.0±2.5 | 82.0±0.0 |
DISCUSSION
The behavior of precipitation between the zones observed in each harvest or study period can be related to environmental conditions such as evapotranspiration, temperature, solar radiation, and soil moisture retention, as suggested by Salazar-Gutierrez et al. (2013), Du Plessis et al. (2020), and Pinzón-Sandoval et al. (2022), which indicated that climatic conditions play a fundamental role in the timing of development.
According to the recorded temperatures in the observed zones, the lower the altitude, the higher the temperature (location 4) as expected (Tab. 1), as compared to the higher the altitude, the lower the temperature (location 1). This behavior is consistent with Quintero (2012), Dugalic et al. (2014), Fischer et al. (2022) and Trbic et al. (2022).
The Tb values found in plums followed the same trend as feijoa in studies conducted by other authors, such as Parra-Coronado (2014). Plum, at this stage of the crop (fruit set), is more susceptible to low temperatures than fruit harvest, as evidenced in the field with the loss of part of the newly formed fruits of the plant, as observed in the municipality of Nuevo Colon. In December and January, low temperatures or frosts predominant in this area, as stated by Pinzón-Sandoval et al. (2022) (Tab. 1) who indicated that fruit trees, in this case deciduous trees, do not tolerate frost in the reproductive stage, and that, when this phenomenon occurs, there is fruit abortion and fruit burn although they are more tolerant in the fruit set stage than in other physiological periods, such as harvest or anthesis (see maximum and minimum temperature in Tab. 1).
It is important to keep in mind that, for different phenological stages, different Tb values should be used, as suggested by some authors: 7ºC, Pinzón-Sandoval et al. (2021), for peaches and plums, and 10º, Manganaris and Crisoto (2020).
The results show that the base temperature is important in all phenological stages of the crop to establishing growth and development models and their respective simulation since, according to this research, the use of a single value is not convenient.
Thermal time estimation (GDD)
There were significant variations of the thermal time in the observation areas. The implementation of the GDD calendar takes this variation and explains the fruit maturity stage, especially when observations from different years are studied and compared (Du Plessis et al., 2020; Salazar-Gutierrez et al., 2013; Ma et al., 2022).
As can be observed in table 4, locality 1 was at a higher altitude (2,449 m a.s.l), and its development time was 79.5 d, very similar to locality 2 (2,285 m a.s.l.), whose development occurred in 79.0 d. The same happened with observation zones 3 and 4 (2,215 and 2,195 m a.s.l.), which developed during 82 d. This agrees with the study conducted by Shivers et al. (2019), who found that, in regions at higher altitude, it is more convenient to have plum crops because the phenological periods are shorter, according to calendar days.
Additionally, the altitude of each locality, growth rates and thermal time varied. Although there were no large variations in day-to-day temperature at each location, there were large differences in temperatures from one location to another during the study period. The use of thermal time, as a unit of measurement at a given location and at a given time, interprets different phenological stages and, in turn, differences in maturity stages (Woznicki et al., 2019).
CONCLUSIONS
According to several authors, Tb and GDD values are not the same in all phenological periods. In the fruit set phase in the studied plum crops, the potential Tb is 2.9, where a mean of 1528.2 GDD and 81 days are required to get from fruit set to harvest. These parameters had a high coefficient of determination.
Knowing the base temperature is of great importance for good management in plum cultivation since good agricultural practices can be carried out more effectively to help predetermine the appropriate time to harvest.

