


 English (pdf)
 Article in xml format
 Article references
 Send this article by e-mail
 Cited by SciELO
  Cited by Google
  Similars in
SciELO
Similars in
SciELO  Similars in Google
 Permalink
I. Introduction
In recent years, the development of CORS (Continuously Operation Reference Stations) networks has significantly increased in many countries globally, serving high-precision surveying and other purposes. Early and large-scale CORS networks were established in some countries, such as the GEONET network with over 1300 CORS stations in Japan (Cibeira Urtiaga et al., 2022; Sagiya, 2004), the CMONOC network with over 260 CORS stations in China (Wu et al., 2018), the NOAA CORS Network with nearly 1800 CORS station in United States (Damiani & Freeman, 2019). Initially, the CORS networks were widely used in surveying and mapping. Later, the CORS networks were applied in numerous research fields, including high-precision positioning, ionosphere studies, troposphere monitoring, tectonic plate monitoring, and others. The typical applications of CORS data can be listed. In the study of sea level change, Snay (Snay et al., 2007) (Janssen et al., 2013; Snay et al., 2007) used the vertical displacement variations of the CORS stations located near tide gauge stations along the coast to determine the "absolute" sea level change with respect to the International Terrestrial Reference Frame (ITRF). In the tropospheric study, based on the relationship between the troposphere and the delay of GNSS (Global Navigation Satellite System) signals received by CORS stations, CORS station data is one of the very few reliable tools for providing continuous and precise condition about atmospheric information (Yang et al., 2020), this information is used to derive values for local atmospheric variables, which aids in weather prediction and weather monitoring (Yuan et al., 2012). In the ionospheric study, the multi-frequency GNSS measurements of the CORS station network provide valuable data for developing the wide-area ionospheric models to model and mitigate local ionospheric effects, and monitor regional ionospheric activity in detail (Choi et al., 2012).
CORS is widely and effectively used for high accuracy real-time displacement monitoring, such as construction deformation monitoring (Xiao et al., 2019; Yu et al., 2016) and landslide monitoring (Bellone et al., 2016; Cong Khai et al., 2020; Zhao et al., 2021). It offers real-time dynamic analysis, including frequency and magnitude. This means the CORS network has an advantage in the accuracy, frequency, and timeliness compared to traditional displacement monitoring techniques (Kun & Yong, 2007).
The study of crustal displacement is the most typical application of CORS networks. Based on CORS data measuring 24/24h, the motion of the Earth's crust can be recorded through changes in its coordinates over time, allowing for the determination of crustal motion. The parameters of crustal motion, such as displacement velocity, seasonal displacement and displacement due to earthquakes, are crucial for tectonic models in tectonic activity research and forecasting (D. T. Tran, 2013). Myoung (2015) analyzed GNSS data of 72 CORS stations observed between 2010 and 2012 to assess the effect of the 11 March 2011 Tohoku earthquake on South Korea. The results showed that the Earth's crust over South Korea underwent heterogeneous crustal deformation from the Tohoku earthquake, with a maximum displacement of 55.5 mm, a minimum of 9.2 mm, and an average of22.42 mm. Sella (2002) simultaneously used GPS Global Positioning System) data from the CORS network during the period of 1993 to 2000 and data from a distributed stations worldwide to establish a global recent velocity model that quantifies the motion of 19 tectonic plates and continental blocks during that time. For determining the crustal deformation in western Himalaya, Sharma (2021) analyzed GNSS data from 4 local CORS stations in combining with 6 IGS stations and determined annual crustal motion of 19.18 mm near the Southern Tibetan Detachment, 18.72 mm near the Main Central Thrust, 11.93 mm near the Main Boundary Thrust and 11.53 mm near the Himalayan Frontal Thrust. This study also highlights the use of GPS data in identify a possible counter-clockwise rotational motion of the Indian Plate. Furthermore, Kall et al. (2021) determined the new velocity model of Estonia by processing the position time series of 10 CORS stations and 12 GNSS campaign stations. The resulting model, called EST2020VEL, has an accuracy of less than ±0.5mm/year.
In Vietnam, the CORS stations were installed and put into use in the late 2010s for surveying and mapping purposes. At the first, private surveying companies primarily installed and operated these CORS station. Currently, there are almost 400 CORS stations installed throughout Vietnam. Since 2012, the Department of Surveying, Mapping, and Geographical Information has establish the national CORS network, known as VNGEONET, and has taken over its operation. After 4 years, the VNGEONET network was completed with 55 CORS stations that cover the entire country.
On the other hand, Vietnam faces faults in its land due to being located in the Sunda tectonic block, and the Indian plate's pressure on the Eurasian plate causing complicated Earth's crust displacements and deformations. Studies on tectonic displacement in Vietnam are limited until GPS become more widespread. For example, there have been studies on the tectonic displacement of active faults in northem Vietnam, such as the Lai Chau - Dien Bien, Son La, and Red River faults, using repeated GPS measurements (Cong Duong et al., 2006; D. T. Tran et al., 2013). However, the small relative displacements on these faults and the limited duration of repeated GPS measurement hinder the ability to provide reliable information.
Recently, based on the development of continuous GNSS technology for measuring tectonic displacement and deformation in Vietnam, some researchers have applied this technology to determine the crustal displacement on Vietnamese territory. Minh et al. (2014) used continuous GPS data from 8 years (2005-2013) collected from 5 sites in Vietnam and 20 sites in South-East Asia to determine the velocity of the Earth's crust in Vietnam and South-East Asia. The results showed that the velocity vectors in ITRF2005 were a south-east direction with magnitudes ranging from 31 to 36 mm/year. The authors confirmed the good quality of continuous GPS data in Vietnam, providing reliable information on crustal displacement. In fact, there are not many studies on the application of CORS networks in determining crustal displacement in Vietnam due to the limited data. Nguyen (2021) utilized GNSS data from 7 continuously measured CORS stations from 2016 to 2018 to determine the displacement velocity in Vietnam. The results indicated that the velocity field ranged from -9.9 to -13.1 mm/year in the north direction and from 26.9 to 32.8mm/year in the east direction. However, the authors acknowledge that the GNSS data used during the 2016 to 2018 period in Vietnam was not ideal for determining tectonic velocity. Tran et al. (2021) processed the GNSS position time series of 4 CORS stations in Vietnam from 2015 to 2019 using a synthetic mathematical model including velocity, jump, seasonal motion, and post-seismic deformation. The authors found that the velocity field of these CORS stations ranges from 29 to 41mm/year in the South-East direction in the ITRF 2014, with an accuracy of ± 0.3 mm/year.
In this paper, we analyze the continuous GNSS data within three years, from 2018 to 2021, of the network of 55 CORS stations distributed across Vietnam to determine the velocity field of the Earth's crust displacement in Vietnam. The process consists of 3 main steps: (1) processing continuous GNSS data using free online PPP (Precise Point Positioning) services to calculate the daily position of CORS stations, (2) converting the geocentric coordinates to topographic coordinates of daily position time series in the ITRF2014, and (3) processing the daily position time series by a synthetic mathematical model to determine the velocity of CORS stations. The observation data of CORS is processed by free online PPP services, which becomes robust, convenient, and fast due to the use of advanced hardware systems and optimized software. The coordinates obtained from the online PPP services fully meet the requirement for studying Earth's crust displacement.
2. Study area and data
Tuong Anh Science and Technology Equipment Joint Stock Company (TAST) is a leading provider of surveying technology services and specializes in building and developing CORS stations in Vietnam. In the early 2010s, TAST built a CORS network that covered the entire country, consisting of over than 100 stations. Currently, TAST's CORS network is being continuously expanded. During its operation, some of CORS stations have undergone changes to their names/codes and locations, some have been affected by power outages, and others have had their antennas replaced or changed. As a result, the continuous measurement data of these CORS stations includes interruptions and jumps in the position time series.
In addition to providing surveying and mapping services, TAST also shares the GNSS data of the CORS network available for scientific purposes, specifically, this data has been used for previous studies such as Nguyen (Nguyen et al., 2021) and Tran (D. T. Tran et al., 2021).
All CORS stations of TAST's CORS network are equipped with Trimble NetR9 GNSS reference receivers and TRM 41249.00 antennas. The GNSS observation data of these stations is logged in the T02 format. These CORS stations continuously observe 24/7 with a sampling rate of 15 seconds and the data is stored on the server system on a daily basis, in the T02 format. Tuong Anh further processes the data in T02 format for real-time positioning. In this study, we used the GNSS data in T02 format to determine the absolute coordinates of all CORS stations, using the PPP method to estimate the Earth's crust displacement across the mainland Vietnam.
Initially, the TAST's CORS network was developed primarily for surveying and mapping services, so its CORS stations were built on existing tall structures such as high roofs, columns, and buildings with three to four floors. Figure 1 illustrates the location of 55 CORS stations used in the study and a typical CORS station (THOA station). The picture of THOA station shows that the antenna is installed on a pole securely attached to a cement pole on top of the roof.

In this study, we analyzed 604 Gigabytes (Gb) of continuous GNSS observation data collected from January 2018 to July 2021 of 55 CORS stations of TAST's CORS network. These stations are evenly distributed throughout Vietnam and are built on sturdy structures. They operate without interruption and remain unchanged during the period of observation.
3. Theoretical background
3.1 PPP online processing services
PPP is an absolute positioning technique that requires the availability of precise reference satellite orbit and clock products using a network of GNSS reference stations distributed worldwide (Ocalan et al., 2016). The PPP algorithm uses as input both code and phase observations from a dual-frequency receiver. These are then combined with precise satellite orbits/clocks and with additional very accurate error models to calculate precise receiver coordinates and clocks.
According to Kouba & Héroux (2001), the ionospheric-free combinations of dual-frequency GNSS pseudo-range (P) and carrier-phase observations (<t>) are related to user position, clock, troposphere, and ambiguity parameters according to the following simplified observation equations:
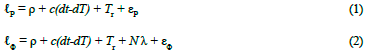
where: ℓP is the ionosphere-free combination of L1 and L2 pseudo-ranges,
ℓΦ is the ionosphere-free combination of L1 and L2 carrier phases,
dt is the station receiver clock offset from GPS time,
dT is the satellite clock offset from GPS time,
c is the vacuum speed of light,
T r is the signal path delay due to the neutral atmosphere (primarily the troposphere),
λ is the carrier, or carrier-combination, wavelength,
N is the non-integer ambiguity of the carrier-phase ionosphere-free combination,
εP, εΦ are the relevant measurement noise components, including multipath.
ρ is the geometrical range computed as a function of satellite (X, Y, Z) and station (x, y, z) coordinates, calculated by:

The observation equations (1) and (2) from all visible satellites are processed together by adjustment and filtering algorithms that solve the different unknowns, such as the station coordinates, the receiver clock, the Zenith Tropospheric Delay (ZTD), and the initial phase ambiguities. The accuracy of estimated coordinates is denpendent on the used mathematical model in PPP software, as well as the quality and content observation file.
Traditionally, commercial PPP software such as GIPSY (GPS Inferred Positioning System) (https://gipsy-oasisjpl.nasa.gov/index.php?page=home) developed by the Jet Propulsion Laboratory (JPL) and Bernese (http://www. bernese.unibe.ch/) developed by Astronomical and the Physical Institutes of the University of Bern, Switzerland are used to process the GNSS data. However, there are two disadvantages to using the traditional PPP method. Firstly, users must pay a fee to purchase the software license. Secondly, a highly configurable computer system is required for software installation.
In recent years, internet-based online GNSS processing services have become popular due to several advantages such as unlimited use, free of charge, time-saving without the need for processing software, and access to the service's powerful computer system. With the PPP service, GNSS data is uploaded to a specified internet site, and the station coordinates can be obtained within a few minutes later with millimeter-level accuracy (Ebner & Featherstone, 2008; Guo, 2015). Currently, there are numerous online processing services available, such as AUSPOS (Geoscience Australia), CSRS-PPP (Natural Resource Canada), OPUS (U.S. National Geodetic Survey), SCOUT (Scripps Orbit and Permanent Array Center, and APPS (Jet Propulsion Laboratory), magic GNSS (GMV Aerospace and Defense Company), etc. Table 1 provides essential information and features of 3 popular online GNSS processing services.
Table 1 Main features of 3 popular online GNSS services
| Online GNSS processing services | Organization | Web base | Latest version (Mars 2022) | Input file | Limitations of upload file | Satellites | Precise satellite products |
|---|---|---|---|---|---|---|---|
| APPS | Jet Propulsion Laboratory (JPL) | http://apps.gdgps.net/ | GIPSY 6.4 | RINEX | file by file | GPS | JPL |
| GAPS | University of New Brunswick (UNB) | http://gaps.gge. unb.ca/ | GAPS 5.2.0 | RINEX | file by file | GPS, Galileo, BeiDou | IGS |
| CSRS-PPP | Natural Resources Canada (NRCan) | https://webapp.geod.nrcan.gc.ca/geod/tools-outils/ppp.php?locale=en | CSRS-PPP 3.50.2 | RINEX | multiple files (<300Mb) | GPS, GLONASS | IGS |
Online PPP processing services offer post-processing position solutions of GNSS observations data files and send them to the users via the Internet. The precise position is estimated from the PPP service to the ITRF. The estimated coordinates of a single station are calculated from either kinematic or static observations utilizing precise GNSS orbits and clocks. The online PPP processing service is user-friendly and provides the best position solution based on available GNSS observation. The following steps, shown in figure 2, are required to process raw data:
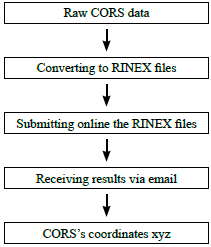
As the first step, the continuous measurement data of CORS stations is converted to the RINEX (Receiver Independent Exchange Format) using the free software Convert to RINEX is available at https://geospatial.trimble.com/trimble-rinex-converter. These RINEX files are then uploaded to the PPP service's website. The results of the online PPP processing are sent to the registered email. In this study, the CSRS-PPP service was selected because it has several advantages compared to other online PPP processing services, including a simple and user-friendly interface, a large submitted file size capacity of up to 300 Megabytes (Mb), fast processing speed of approximately 5 minutes, and millimeter-level accuracy in estimated coordinates.
As a note that, the continuous observation data of CORS stations is usually processed daily for monitoring Earth's crust displacement. This means that the coordinates of those CORS stations from the PPP online service are obtained on a daily basis. These daily coordinates for each station are then separated into a daily position time series.
3.2. Conversion from geocentric coordinates to topocentric coordinates
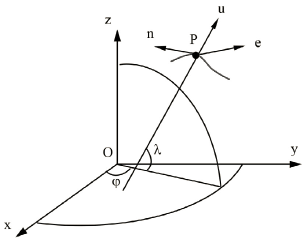
The online PPP processing services provide a positioning solution in the ITRF. The ITRF is defined as an ECEF (Earth Centered Earth Fixed) system with 3 coordinate components of x, y and z. To monitor the displacement of Earth's crust, the CORS coordinates need to be transformed from their geocentric ITRF system to their corresponding local topocentric system. This is represented by east (e), north (n), and up (u) components, as shown in Figure 3. This representation is physically meaningful because it separates the horizontal component (e, n) from vertical component (u).
The common equations can be written as follows (D. T. Tran et al., 2022):
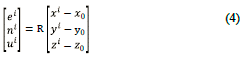
Where: (x i , y i , z i ) are the estimated coordinates in the ITRF, and (e i , n i , u i ) are the coordinates in the local topocentric system of station i, R is the rotation matrix presented by:
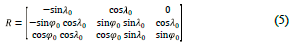
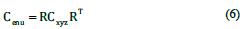
And (x 0 , y 0 , z 0) and (φ0, λ0) are the coordinates of reference point. The variance-covariance matrix is transformed as:
3.3 Synthetic mathematical model for crustal displacement
The CORS location is changed by land surface displacement due to geotectonic activities, periodic movement due to changes of groundwater levels, and geo-tidal effects. These influences are evident in the position time series of the CORS station.
A study by Tran et al. (2021) on the displacement model of daily GNSS position time series of the monitoring points in the area of Vietnam area shown that the most suitable model is a synthetic mathematical model consisting of a linear trend, a seasonal term (includes annual and semi-annual periodic motions) and jumps (caused by seismic activity, antenna change, etc.). This model is represented by equation (7) for east, north, and up component of each station.
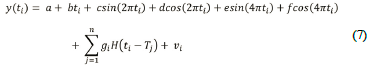
Where: t i is the time of the series positions in a decimal year,
a is the initial position at time reference,
b is the velocity,
c, d, and e, f are harmonic components of annual motion and semi-annual motion, respectively,
g j is the magnitude of jumps at a time T j (n is the number of jumps).
Heaviside function H (ti − Tj) = 0 if t i < Tj and H (ti − Tj) = 1 if ti ≥ Tj, and v i is the residuals.
Using equation (8), we calculate the velocity for the east component (denoted as v e ), the north component (denoted as v n ), and the up component (denoted as v u ), we then calculate the station’s horizontal velocity v 2D :

To estimate the accurate of the time series, we employ repeatability, a measure of the dispersion of positions. Repeatability can be calculated for baselines and positions. The position repeatability is defined as the weighted root mean square (wrms) of the residuals of positions around their average position (Nocquet, 2011):
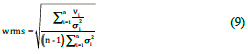
Where:n is the number of positions in the time series,
σi is the variance of position y(t i )..
4. Proposed methodology for crustal displacement based on CORS data
The procedure for processing CORS data to determine crustal displacement in TAST's network is as follows:
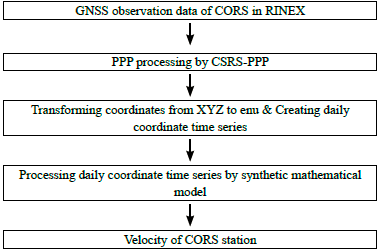
The process involves 3 main steps:
Step 1: Processing observation data using CSRS-PPP service to obtain daily coordinates of CORS stations in ITRF2014.
Step 2: Converting the coordinates from geocentric coordinates (x, y, z) to topographic coordinates (east, north, up) in the ITRF2014, and creating daily coordinate time series for each CORS stations in the east, north, and up components.
Step 3: Processing daily coordinate time series using the synthetic mathematical model. This involves solving for the harmonic components of annual motion and semi-annual motion, jumps (if any), and determining the displacement velocity of the CORS station.
In step 1, approximately 604Gb of GNSS observation data in T02 format is converted to RINEX format using the Convert to RINEX software. The resulting *.o files are compressed into zip files of less than 300Mb and submited to the CSRS-PPP via its web-based service. This step is time consuming, taking up to nearly 4 days. However, the PPP processing by CSRS-PPP online service is efficient and fast, taking only about 5 minutes after submitting each RINEX file. This highlights the efficiency and capability of the CSRS-PPP online service.
The results received from the CSRS-PPP service after PPP processing include:
SUM file: Contains the parameters and the results of the PPP processing.
POS file: Contains the positioning information for each epoch processed.
CSV file: A comma-separated format text file containing the positioning and clock information for each epoch processed.
TRO file: Contains dry and wet zenith path delay and tropospheric gradient for each epoch processed.
CLK file: A RINEXCLOCK format file containing the receiver clock offset and the clock offset sigma (95%) for each epoch processed.
The daily coordinates (x, y, z) in the ITRF2014 of the CORS station are found in the *.SUM file. A total of 48573 *.SUM files of the TAST's CORS network have been processed, with a capacity of 592Mb.
In step 2, authors developed make_mbfile_sumfile.py using the Python programming language (https://www.python.org/). This program allows read coordinates (x, y, z) and their corresponding covariance - covariance matrix from *.SUM files, converts them to topographic coordinates (east, north, up) using Formulas 4 and 5, and then writes them in the mb_file format, the Gamit coordinate time series format (http://www-gpsg.mit.edu/~tah/GGMatlab/). The program make_mbfile_sumfile.py automatically and efficiently processed all 48573 *.SUM files in just about 10 minutes.
In step 3, authors developed the GNSS position time series processing program named pygpsts.py (D. T. Tran et al., 2021). This program enables automatic or manual processing of position time series in mb_file format. In automatic mode, it automatically detects and removes outliers, detects jumps, and calculates the velocity, the harmonic components of annual motion and semi-annual motion, the magnitude of jumps (if any), and post-seismic displacement in the position time series, using equation(6). The automatic processing of time series of 55 CORS stations took approximately 10 minutes. However, some CORS stations with complex time series could not be processed automatically, especially when outliers or/and jumps could not be eliminated. An example of this is the AMKG station, where the estimated displacement velocity had poor accuracy. In this case, we performed manual processing using pygps_ts.py program to improve the accuracy of the estimated displacement parameters. The results of this step are presented in the next section.
5. Result and discussion
By using the proposed methodology for processing GNSS observation data of TAST's CORS network, the final result, which is the displacement velocity of the CORS stations, is obtained. The processing result quality is evaluated through the standard deviation of the estimated velocity, the repeatability histogram, and the best fit line of the CORS station.
Figure 5 is the repeatablility histogram of 55 CORS stations. The histogram shows that 95% of the stations have repeatability lower than 2.7 mm on the east component and 2.5 mm on the north component, demonstrating very high accuracy. However, the repeatability on the vertical (up) component is poor with 95% of the stations having repeatability lower than 9.4 mm, making it unsuitable for studying vertical displacement. The wrms values of this study are lower than those of several studies in Vietnam such as Minh et al., 2014 and Nguyen et al., 2021 demostrating the potential of this approach in monitoring crustal displacement monitoring using CORS.
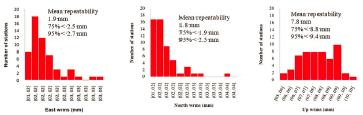
Figure 6 illustrates the typical processing cases of 2 CORS stations in TAST's CORS network, DAMI and LSON. Figure 6 shows the position time series of DAMI, which includes a trendline, seasonal periodic motions, and outliers (represented by blue circles that deviate from the series). These outliers must be removed priori to estimate the position time series (T. D. Tran et al., 2016). The processing results in Figure 6a detect and remove the outliers, resulting in the best fit line (shown as a red line). Figure 6b shows the residual time series with positions close to the zero line and a small wrms value of 1.5 mm in the both north and east component, and 4.5 mm in the up component, which is a good result. Figure 6c shows the position time series of LSON which includes a jump at 2021.216, in addition to outliers, trendline, and seasonal periodic motions. The processing results estimate the best fit line, correcting the jump, as shown by the red linr in the figure 6. The residual time series in the Figure 6d has a small wrms value of 1.4 mm, 1.5 mm, and 4.1 mm in the north, east, and up components, respectively.
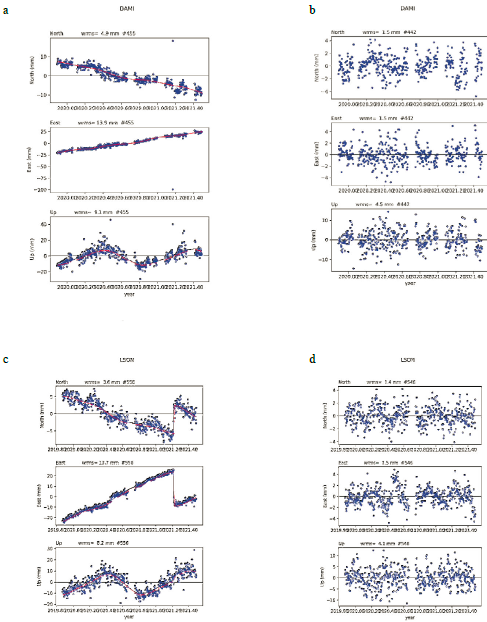
Figure 6 Processing the position time series of 2 typical CORS stations Figures (a) and (c) display the position time series of DAMI and LSON stations, represented by blue dots, with the estimated model shown as a red line. Figures (b) and (d) display the residuals time series of DAMI and LSON stations, with outliers, trend, and seasonal motion removed.
Table 2 shows the displacement velocity in the ITRF2014 of TAST's CORS network and its accuracy. The horizontal velocity of the stations ranges from 25.3 mm/year (CTHO) to 42.6mm/year (BTIN), with accuracy ranging from ±0.1 to ±1.0 mm/year. The vertical velocity of the stations ranges from -51.4mm/year (CTHO) to 33.7mm/year (TAMI), with the accuracy ranging from ±0.3 to ±2.6mm/year. This study focuses only on the horizontal velocity of the CORS stations. Figure 4 presents the horizontal velocity field of TAST's CORS network.
Table 2 Velocity and its standard deviation in ITRF2014
| No | Station | Velocity (mm/year) | Standard deviation of velocity (mm/year) | ||||||
|---|---|---|---|---|---|---|---|---|---|
| East | North | Up | 2D | East | North | Up | 2D | ||
| 1 | AMKG | 29.8 | -10.9 | -11.6 | 31.7 | 0.3 | 0.4 | 1.5 | 0.5 |
| 2 | BD61 | 25.9 | -7.5 | -8.7 | 27.0 | 0.3 | 0.2 | 1.0 | 0.4 |
| 3 | BGIA | 32.6 | -10.3 | 9.2 | 34.2 | 0.1 | 0.1 | 0.6 | 0.2 |
| 4 | BKAN | 32.4 | -10.1 | 4.2 | 33.9 | 0.2 | 0.1 | 0.7 | 0.2 |
| 5 | BLIU | 35.4 | -10.4 | -44.9 | 36.9 | 0.1 | 0.1 | 0.5 | 0.2 |
| 6 | BLOC | 27.2 | -10.6 | 3.3 | 29.2 | 0.1 | 0.1 | 0.4 | 0.1 |
| 7 | BTIN | 41.9 | -7.5 | 1.5 | 42.6 | 0.4 | 0.4 | 1.5 | 0.5 |
| 8 | BTRE | 25.5 | -11.3 | -12.4 | 27.9 | 0.1 | 0.1 | 0.3 | 0.1 |
| 9 | BUGI | 29.3 | -9.0 | -1.8 | 30.7 | 0.1 | 0.1 | 0.8 | 0.2 |
| 10 | CMAU | 28.5 | -6.1 | -11.2 | 29.1 | 0.1 | 0.1 | 0.4 | 0.1 |
| 11 | CNTV | 32.6 | -6.5 | -19.7 | 33.2 | 0.1 | 0.1 | 0.3 | 0.1 |
| 12 | CTHO | 23.4 | -9.7 | -51.4 | 25.3 | 0.1 | 0.1 | 0.4 | 0.1 |
| 13 | CUJU | 27.2 | -11.2 | -0.8 | 29.4 | 0.2 | 0.2 | 1.1 | 0.3 |
| 14 | DAKN | 26.1 | -9.6 | 3.7 | 27.8 | 0.3 | 0.2 | 0.9 | 0.3 |
| 15 | DAMI | 28.6 | -10.2 | 3.8 | 30.4 | 0.2 | 0.2 | 0.7 | 0.3 |
| 16 | DGBL | 25.4 | -12.8 | -21.5 | 28.4 | 0.2 | 0.4 | 1.0 | 0.5 |
| 17 | DHOI | 30.4 | -11.2 | 7.0 | 32.4 | 0.2 | 0.2 | 0.7 | 0.2 |
| 18 | DIBI | 29.8 | -8.8 | 29.1 | 31.1 | 0.3 | 0.3 | 1.2 | 0.4 |
| 19 | DILI | 38.3 | -8.4 | 27.9 | 39.2 | 0.7 | 0.6 | 1.5 | 0.9 |
| 20 | DKN2 | 32.4 | -6.7 | -9.0 | 33.1 | 0.6 | 0.5 | 2.4 | 0.7 |
| 21 | DQAN | 29.9 | -10.1 | 0.4 | 31.6 | 0.2 | 0.1 | 0.6 | 0.2 |
| 22 | DXOA | 25.8 | -6.9 | -6.0 | 26.7 | 0.1 | 0.1 | 0.4 | 0.1 |
| 23 | EAHL | 26.6 | -7.6 | 20.5 | 27.7 | 0.6 | 0.5 | 1.6 | 0.8 |
| 24 | EAKA | 29.3 | -8.0 | -1.6 | 30.4 | 0.3 | 0.4 | 1.4 | 0.5 |
| 25 | GOCO | 28.1 | -11.7 | -8.7 | 30.4 | 0.1 | 0.1 | 0.3 | 0.1 |
| 26 | HALO | 33.2 | -9.7 | 3.1 | 34.6 | 0.1 | 0.1 | 0.7 | 0.2 |
| 27 | HATI | 32.3 | -9.2 | 32.7 | 33.6 | 0.5 | 0.5 | 1.9 | 0.7 |
| 28 | HD34 | 36.0 | -12.0 | -4.9 | 37.9 | 0.1 | 0.1 | 0.4 | 0.1 |
| 29 | HNOI | 31.5 | -8.3 | -0.1 | 32.6 | 0.2 | 0.2 | 0.7 | 0.2 |
| 30 | HUE_ | 30.9 | -9.1 | 25.6 | 32.2 | 0.3 | 0.3 | 1.5 | 0.4 |
| 31 | HYEN | 31.4 | -12.3 | 1.0 | 33.7 | 0.1 | 0.2 | 0.7 | 0.2 |
| 32 | LOCN | 27.1 | -4.1 | -9.8 | 27.4 | 0.6 | 0.8 | 1.5 | 1.0 |
| 33 | LSON | 36.7 | -8.8 | -1.1 | 37.7 | 0.2 | 0.2 | 0.8 | 0.3 |
| 34 | LTHU | 29.9 | -12.5 | -7.0 | 32.4 | 0.4 | 0.3 | 1.9 | 0.5 |
| 35 | NADI | 30.0 | -8.1 | -10.7 | 31.1 | 0.1 | 0.1 | 0.3 | 0.1 |
| 36 | NHOA | 24.6 | -13.4 | -4.5 | 28.0 | 0.2 | 0.2 | 0.8 | 0.3 |
| 37 | PLEI | 29.4 | -9.3 | -3.9 | 30.8 | 0.2 | 0.2 | 1.0 | 0.3 |
| 38 | PQOC | 25.3 | -8.8 | 0.2 | 26.8 | 0.1 | 0.1 | 0.5 | 0.1 |
| 39 | PRAN | 28.2 | -9.4 | -1.0 | 29.7 | 0.1 | 0.1 | 0.4 | 0.1 |
| 40 | PTHO | 33.6 | -9.1 | 9.2 | 34.8 | 0.1 | 0.1 | 0.7 | 0.2 |
| 41 | QNAM | 27.2 | -6.9 | 23.6 | 28.1 | 0.3 | 0.3 | 1.5 | 0.4 |
| 42 | QNGI | 32.0 | -13.3 | -2.4 | 34.7 | 0.1 | 0.1 | 0.3 | 0.2 |
| 43 | RGIA | 24.4 | -8.4 | 5.1 | 25.8 | 0.1 | 0.1 | 0.5 | 0.1 |
| 44 | SOLA | 33.0 | -10.1 | -14.7 | 34.5 | 0.4 | 0.4 | 1.6 | 0.5 |
| 45 | TAMI | 27.7 | -11.0 | 33.7 | 29.8 | 0.8 | 0.6 | 2.6 | 1.0 |
| 46 | TAN2 | 27.2 | -10.2 | 16.0 | 29.0 | 0.4 | 0.4 | 1.5 | 0.5 |
| 47 | THOA | 25.4 | 1.9 | 12.6 | 25.5 | 0.6 | 0.6 | 1.1 | 0.8 |
| 48 | TN20 | 31.7 | -8.8 | 3.8 | 32.9 | 0.1 | 0.1 | 0.4 | 0.1 |
| 49 | TQAN | 31.7 | -9.6 | 5.5 | 33.1 | 0.2 | 0.2 | 0.8 | 0.2 |
| 50 | TUGI | 30.4 | -4.3 | 5.2 | 30.7 | 0.5 | 0.5 | 1.9 | 0.7 |
| 51 | TUYF | 26.8 | -7.7 | -0.6 | 27.9 | 0.2 | 0.2 | 0.9 | 0.3 |
| 52 | VFUC | 32.1 | -10.1 | 6.9 | 33.7 | 0.1 | 0.1 | 0.3 | 0.1 |
| 53 | VINH | 32.3 | -9.7 | 9.2 | 33.7 | 0.1 | 0.1 | 0.5 | 0.1 |
| 54 | VTAU | 28.6 | -10.6 | -2.6 | 30.5 | 0.1 | 0.1 | 0.3 | 0.1 |
| 55 | XMOC | 25.5 | -11.2 | -3.4 | 27.9 | 0.1 | 0.1 | 0.4 | 0.1 |
Figure 7 shows that all CORS stations are moving towards the southeast direction with relatively uniform velocities, varying from 25.3 mm/year at the CTHO station to 42.6 mm/year at the BTIN station. This indicates that the Earth's crust surface in Vietnam is moving in the southeast direction according to ITRF2014.
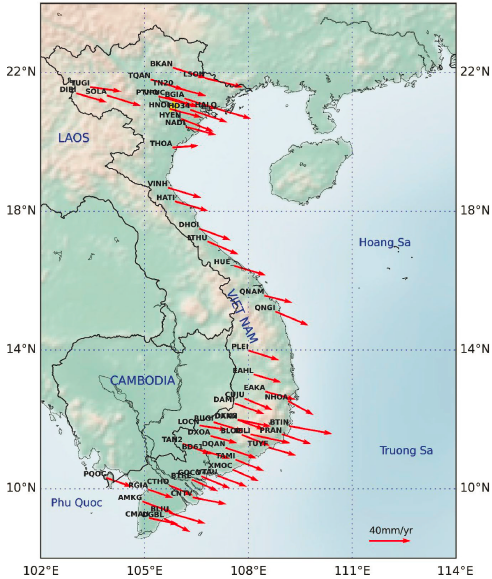
This study's velocity field was compared with previous studies, including determining the Earth's crust displacement in Vietnam through repeated GPS measurements (D. T. Tran et al., 2013), continuous GPS data (Minh et al., 2014), and CORS stations (Nguyen et al., 2021; D. T. Tran et al., 2021). It was found to be consistent with these studies, demonstrating the reliability of our methodology and the suitability of GNSS data of the TAST's CORS network for crustal displacement studies in Vietnam.
6. Conclusions
In this study, authors processed GNSS data collected from January 2018 to July 2021 from 55 CORS stations in the TAST's CORS network located throughout Vietnam to determine the crustal displacement. Our methodology involved processing the data with the CSRS-PPP service, which allows for efficient processing and high accuracy in position determination. The displacement model is applied to accurately estimate the velocity of the position time series.
The results of the study on the TAST's CORS network indicate that the horizontal accuracy is high, with 95% of the stations having a repeatability of less than 2.7 mm and 2.5 mm for the east and north components, respectively. On the other hand, the vertical accuracy is lower, with a repeatability of 9.4 mm for 95% of the stations. Therefore, the vertical displacement of the Earth's crust was not considered in this study. It was found that the horizontal velocity field of all CORS stations is uniform in both magnitude and direction, ranging from 25.3 to 42.6 mm/year with an accuracy from ±0.1 to ±1.0 mm/year in the south-east direction according to ITRF2014. This horizontal velocity field is in line with previous studies. The study also confirms that the stability and accuracy of GNSS data from the TAST's CORS network for analyzing crustal displacement.

