


 Inglés (pdf)
 Articulo en XML
 Referencias del artículo
 Enviar articulo por email
 Citado por SciELO
  Citado por Google
  Similares en
SciELO
Similares en
SciELO  Similares en Google
 Permalink
Durum wheat (Triticum durum Desf.) is the most important staple crop in Algeria. Annually, it is cultivated over 1.2 million ha with an average production of 2.2 million t in the last decade (MADRP-DSASI, 2017). It is mainly grown under rainfed conditions where its productivity is profoundly affected by abiotic stresses. In national wheat breeding programs, improving yield taking into account adaptation to environmental variation is a primary aim after the foreseeable effects of climate change, which will accentuate the action of abiotic stresses in the conditions of southern Mediterranean countries (Annicchiarico et al., 2005; Rabti et al., 2020; Xynias et al., 2020). Under these limiting conditions of growth, where water scarcity is highly frequent, it is necessary to select adapted plant material that possesses high-yield qualities. In this context, several researchers such as Slafer et al. (2005), Oulmi et al. (2017) and Fellahi et al. (2020) suggested to look for genotypic variation, including the response of genotypes to abiotic such as, water deficit and end-of-season heat stress. Although genetic improvement has been responsible for 50% of yield increase under relatively less favorable conditions (Reynolds and Tuberosa, 2008), adaptation appears as a necessary characteristic to stabilize the crop production (Fellahi et al., 2018; Sallam et al., 2019). In this context, duration of the vegetative growth cycle, plant height and above-ground biomass have proven their significant direct effects on the yield potential achievement.
Breeding cereals for yield potential via the classical approach is based on crosses between complementary parental lines and the follow-up of hundreds or even thousands of segregant derived lines, to identify the most suitable for specific environments (Martin and Geraldi, 2002). This approach resulted in improved yield performance, particularly in favorable environments, using the grain yield as a direct selection criterion. However, it is time consuming and expensive in addition to the complexity of the genetic system that controls grain yield. Breeders are actually looking for other selection assistance methods more effective and easier to handle. Indeed, it is very interesting that the indirect selection method rapidly and efficiently identifies the best genotypes after the screening a sufficiently large number of segregating lines (Fellahi et al., 2018; 2020). Applying the morphological and/or physiological traits as selection criteria is an interesting approach that attracts the attention of breeders and physiologists (Bennett et al., 2011; Mühleisen et al., 2013; Ben-Amar et al., 2020). Limitation of indirect selection lies by the fact that the relationship between these morpho-physiological characteristics and yield is sometimes weak, complex and depends on the genetic background and the environment (Oulmi et al., 2014; Haddad et al., 2016). The existence of sufficient variability of physiological responses of the plant to abiotic stresses is necessary for the breeder to make any progress in improving tolerance. The main goals of the study were to study the phenotypic variability within F3 and F4 filial generations, analyze the association between grain yield and yield-related traits, and to identify traits that have the most direct and indirect effects on grain yield. These traits will be used as criteria of selection that can lead to the improvement of durum wheat yield under water-limited conditions.
MATERIALS AND METHODS
This study was conducted at the Agricultural Experimental Station of the Technical Field Crops Institute (ITGC-AES) in Setif (Eastern Algeria) 36°15'N, 5°87'E at 1081 masl, during two successive cropping seasons, 2010/11 and 2011/12. It focused on evaluation of F3 and F4 populations of durum wheat generated from three crosses made between Ofanto, Mohammed Ben Bachir (MBB), Waha and Mrb5 varieties.
The plant material consisted of the four parents, F3 and F4 breeding lines and a control cultivar Boussalem, which were planted in November, each in two rows of 5 m long, 0.2 m apart. The plant material was set up in an augmented design, parents and control were replicated four times while the 330 F3 and 174 F4 breeding lines were not replicated. The seeding rate was 200 seeds m-2. All cultural practices (soil management, fertilization, …etc.) followed for the durum wheat growing, from sowing to harvest, were those practiced by the ITGC-AES as described by Chennafi et al. (2011a).
The measurements were made on the duration of the vegetative phase (DVP, days), plant height (PHT, cm), above-ground biomass (BIO, g m-2), number of spikes (NS, m-2), number of grains (NG, m-2) and grain yield (GY, g m-2).
The straw yield (Str.Y, g m-2) was determined by the difference between the BIO and GY. Harvest index (HI, %) was estimated as the ratio of GY and BIO. The economic yield (Econ.Y, m-2) was calculated according to Annicchiarico et al. (2005) by using the equation (1):

Where: GY is the grain yield and Str.Y is the straw yield. The economic assessment was simply expressed in terms of grain-equivalent value (Annicchiarico and Pecetti, 2003).
The measured variables were analyzed using descriptive statistics to obtain means, extreme values, variances and frequencies. The relationships between measured variables were studied by analyzing the phenotypic correlation coefficients. The variables that determine GY and BIO were derived by stepway regression and path analysis (Fellahi et al., 2013a). The coefficients of phenotypic (CVp) and genotypic (CVg) variation were calculated by using the equations (2) and (3) proposed by Acquaah (2007):


Where: σ²p and σ²g are the phenotypic and genotypic variances, respectively. σ²p was calculated based on the phenotypic values of the traits measured in the F3 and F4 lines and σ²g was calculated as the difference σ²p - σ²e in which σ²e was obtained from the values of the traits measured in the replicated parents and control cultivar.  is the mean of the measured trait.
Broad-sense heritability (h²bs) is calculated according to the equation (4) by Acquaah (2007).

Where: σ²g and σ²p are, respectively, the genotypic and phenotypic variances.
Descriptive statistical analyzes were done by using CropStat 7.2.3 software (IRRI, 2009), PAST a Paleontological statistics software package (Hammer et al., 2001) was used to estimate the correlation coefficients, while LazStats (Miller, 2013) was employed to run the path analysis and stepwise regression. The least significant difference was calculated at 5% level (Lsd5%) based on the residual variance for all the variables measured in the parental lines that are repeated.
RESULTS AND DISCUSSION
Variability and heritability of the traits of the F3 and F4 generations
The means, minimum and maximum values, genotypic and environmental variances, broad-sense heritability, phenotypic and genotypic correlation coefficients of the measured variables are given in Table 1. For BIO and Str.Y produced at maturity, the mean values of the F3 generation ranged widely from minima of 202.0 g m-2 and 108.0 g m-2 to maxima of 860.0 g m-2 and 608.9 g m-2, around general mean estimates of 398.6 g m-2 and 265.4 g m-2, respectively. This information showed that there was sufficient genetic variability to justify selection for improvement in the durum wheat genotypes studied. Candidate lines for selection with high biomass and straw are located in the right fraction of the distribution curves of BIO and Str.Y. Fellahi et al. (2013a) and Hannachi et al. (2013) also reported that considerable progress in wheat breeding program could be achieved by exploiting these traits in semi-arid environment. In this research study, lines selected within wheat populations could induce a significant genetic gain since this selection concerns individuals that perform better phenotypically (and therefore, genetically) than the rest of the F3 lines (Fellahi et al., 2020). In F4 generation, the characteristic values of BIO and Str.Y produced at maturity took relatively lower values than those recorded in F3 generation ranging from minima of 159.7 g m-2, 97 g m-2, up to maxima of 521.7 g m-2 and 328.7 g m-2 with overall means of 319.0 g m-2, 203.3 g m-2, respectively. Compared to F3 breeding lines, means of F4 generation were reduced by 20.0 and 23.4% for BIO and Str.Y, respectively. Similarly, the minimum values were reduced by 20.9 and 10.2%, while the maximum values were reduced by 39.3 and 46.0% in the same order. The decrease of phenotypic variability of BIO and Str.Y in F4 could be explained by the fact that the F3 generation was subjected to a visual selection that resulted in the elimination of undesirable individuals considering some important traits such as diseases, excessive height, dwarfism, lardivity and threshing. Other studies have reported that segregation of breeding generations may fluctuate in performance from year to year (Ahmad et al., 2018). According to Brown and Caligari (2008), environmental variation is always unpredictable and the highest yielding progeny lines derived from F2 and F3 generations may at the some point fail to produce the highest yielding segregants.
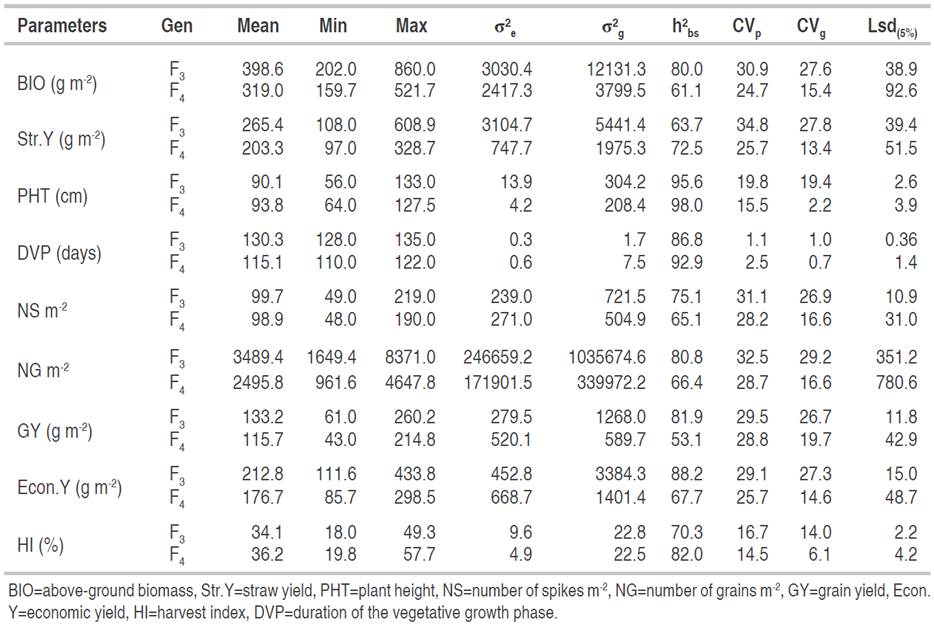
PHT in F3 populations ranged from 56.0 to 133.0 cm, with a general mean of 90.1 cm. Close values in F4 were found, varying from 64.0 to 93.8 cm with a mean of 127.5 cm. A 7 days range (128.0 to 135.0 days) of the duration of the vegetative growth phase was observed in the F3 population with a general mean of 130.3 days. This amplitude suggests the possibility of removing part of the plant cycle of the crop subjected to the terminal drought and heat stress. In such a situation, the elimination of subsequent breeding lines on the basis of their DVP estimates during the early segregating generations before selection for yield performance is justified as indicated by Mekhlouf et al. (2006) and Mansouri et al. (2018). In F4, the duration of the vegetative growth phase varied from 110.0 to 122.0 days with a general mean of 115.1 days. DVP distribution values of F4 had a greater amplitude than that observed in F3 populations, indicating that the selection pressure applied in F3 did not seem to affect the variability of this trait, as for BIO and Str.Y. Compared to F3 generation, the F4 generation showed a substantial change in the mean position of this characteristic suggesting a shortening of the duration of this phase compared to that of the F3 generation. This acceleration of development rate which induced a reduction in the DVP of 15 days between F3 and F4 generations might suggest more intense effect of drought, and especially heat stress during the second year of the experiment. Also, the reduced number of breeding lines in F4 compared to F3 generation due to selection pressure might reflect on the average of DVP since late lines were discarded. It is well known in the literature that early headed wheat genotypes under rainfed south Mediterranean environment are more productive and early generation selection based on DVP as an indirect selection criterion to improve GY is commonly used by wheat breeders (Haddad et al., 2021). Under the same environmental conditions of the present study, Rabti et al. (2020) evaluated 58 durum wheat genotypes grown in Algeria and noted that recent varieties produced a higher yield 7.05 days earlier, on average, than landraces. The variation in NS per square meter is rather wide, ranging from 49.0 to 219.0 spikes m-2, with a general mean of 99.7 spikes m-2 in F3 generation. These values remain much lower than those usually observed in the region where this experiment was conducted. Values of this characteristic varied in the F4 generation from 48.0 to 190.0 spikes m-2, with an overall mean of 98.9 spikes m-2. NG per unit area varied from 1649.4 to 8371.0 grains m-2 in F3 and from 961.6 to 4647.8 grains m-2 in F4 with an average estimated of 3489.4 and 2495.8 grains m-2, respectively. The same pattern was observed for GY in which lower performances were recorded for F4 when compared to F3 populations (115.7 vs. 133.2 g m-2). GY ranged between 61.0 and 260.2 g m-2 in F3 and between 43.0 and 214.8 g m-2 in F4 filial generation. These results suggest that the environment was less favorable to the expression of this characteristic for F4 than for F3. Amein and Atta (2016) also revealed that the magnitude of phenotypic and genotypic variances was decreased through generations (F2, F3 and F4) when analyzing the variability and relative response to selection in bread wheat crossing over three seasons. Ahmad et al. (2018) also found that segregants lost their superiority in F4 generation. According to Mather and Jinks (1971), superiority of F2 and F3 segregants are mainly due to additive × additive and dominant × dominant interactions. Bernardo (2003) stated that early generation selection in different self-pollinated crops, including small grains, is sometimes effective and sometimes ineffective. This selection approach is expected to be effective partly because these species have only low levels of dominance gene action. In the current study, the decreasing trend of the generations of selfed means suggests that the genes are preponderantly dominant or epistatic (Salmi et al., 2019). According to Brown and Caligari (2008), genotype × environment interaction also affects the segregating performance throughout the breeding stages due to uncontrollable environmental conditions from one year to next year. The Econ.Y ranged, for F3 populations, from a minimum of 111.6 to a maximum of 433.8 g m-2, with a general mean of 212.8 g m-2. Values of this trait were lower in F4 generation varying from 85.7 to 298.5 g m-2 with an average of 176.7 g m-2. HI was, on average, higher for F4 as compared to F3 populations (34.1% vs. 36.2%). The range varied from 18.0 to 49.3 for F3 and from 19.8 to 57.5% for F4 generation. In autogamous species as wheat, breeders often discard inferior segregants in an early selfing generation so that more resources can be devoted to further testing and selection of the most promising lines (Bernardo, 2003). These results revealed that the selection applied in F3, in which elimination of low performance segregants were carried out, reduced the range of variability for Econ.Y and HI but increased, on average, HI mean value of the F4 populations. Donmez et al. (2001) indicated that the improvement in the yield of wheat varieties released from 1873 to 1995 was associated with increase in harvest index and biomass. Likewise, Haddad et al. (2021) investigated the performance of a set of 16 durum wheat varieties, released during the past 67-years, under rainfed conditions of the eastern high plateaus of Algeria and concluded that high yielding varieties headed early, exhibiting high spike weight, number of spikes, number of kernels m-² as well as increased Econ.Y.
This hypothesis of variability is supported by the values of the phenotypic (CVp) and genotypic (CVg) coefficients of variability. In F3, a high CVp was observed along with high CVg estimates for BIO, Str.Y, NS, NG, Econ.Y and GY and at a lesser degree PHT. These findings suggest the presence of great variability for these traits, which implies that genotype contributed more than the environment in their expression and selection based on phenotypic values is feasible. Similar finding was obtained by Mansouri et al. (2018) and Salmi et al. (2019). Intermediate values for HI comprised between 10.0 and 20.0%, and low values for the duration of the vegetative growth phase were also recorded. In F4, the CVp estimates were high (above 20%) for almost all the traits except for PHT and DVP. CVg were medium for BIO, Str.Y, NS, NG, Econ.Y and GY and HI. The lowest CVg were recorded for PHT and DVP, indicating the difficulty of improvement these traits through selection. The rather large difference between the CVp and CVg values for some traits is due to the greater contribution of the environmental variance to the phenotypic variability. The above statement is fully supported by Gerema (2020) who observed moderate and low CVp and CVg for plant height and days to maturity, respectively. The CVp and CVg values observed were much higher in F3 when compared to their respective estimates in F4 generation, except for CVp and DVP. This result proves that the pedigree selection applied on F3 generation negatively impacted the variability on F4. Practically, the increase in homozygosity in advanced generations results in a decrease in the observed variability. Because the CVp is a combination of additive and environmental variances, any increase observed in CVp value in next generation may be due to environmental factors, not strictly due to additive or dominant gene action (Amein and Atta 2016; Ahmad et al., 2018).
The broad-sense heritability in F3 ranged from 63.7% for Str.Y to 95.6% for PHT. These values, calculated in a single generation, were quite high, suggesting that these parameters were less affected by the environmental factors and/or under the control of additive genetic effects where an early selection in F3 should lead to a rapid genetic improvement of the plant material. In F4, broad-sense heritability estimates were high (>60%) for all traits, except for GY. The difference in heritability values observed between F3 and those of F4 could be attributed to the influence of environment on the expression of traits in both populations with a better contribution of the genotype to the phenotype expression within each generation. Wiggins (2012) attributed the different estimates of heritability between generations to the large genotype × environment interaction and to differences in the way the equations calculated heritability.
Correlations of the F3 and F4 generation traits
The phenotypic correlation coefficients between the variables measured in the F3 and F4 generations are given in Table 2. Regarding F3 generation, the BIO significantly correlated to Str.Y (r=0.973), NS (r=0.829), NG (r=0.755), GY (r=0.843) and Econ.Y (r=0.971). However, no significant correlations of BIO with the DVP were indicated. These results suggest that selection of BIO should be effective and lead to appreciable improvements, in the positive sense, in at least five traits (Str.Y, NS, NG, GY and Econ.Y). This selection, based on BIO, is expected to result in a lesser improvement in PHT and HI.
Table 2 Phenotypic correlation coefficients (only significant correlations at 5% probability level are displayed) between F3 generation (n=330, below the diagonal) and the F4 generation (n=174, above the diagonal).
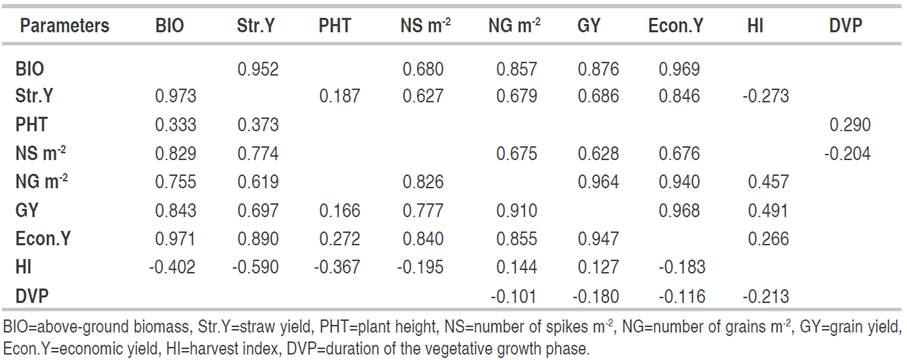
Str.Y exhibited significant correlations with PHT (r=0.373), NS (r=0.774), NG (r=0.619), GY (r=0.697) and Econ.Y (r=0.890). Straw-based selection induced indirect improvement in PHT, NS, NG, Econ.Y and GY and decreased in HI. GY had fairly strong correlations with the BIO (r=0.843), NG (r=0.910) and Econ.Y (r=0.968). Its correlations with Str.Y produced (r=0.697) and NS (r=0.777) were less strong. However, it had weak associations with PHT (r=0.166), HI (r=0.127) and DVP (r=-0.180). The analysis of these correlations indicates that GY-based selection leads to improvements in BIO, Econ.Y, and NG. It is well known in the literature that GY is polygenic complex trait, its measurement is subject to errors that makes the direct selection on the basis of this character less effective due also to the presence of genotype × environment interactions, which leads to a change in the ranking order of genotype performances from one environment to another and from generation to generation (Meziani et al., 2011; Bendjamaa et al., 2014; Haddad et al., 2016; Fellahi et al., 2018, Mansouri et al., 2018; Fellahi et al., 2020; Rabti et al., 2020).
The Econ.Y showed quite strong correlations with the BIO (r=0.971), Str.Y (r=0.890), NS (r=0.840), NG (r=0.855) and GY (r=0.947). Correlations with PHT (r=0.272), HI (r=-0.183) and DVP(r=-0.160) were rather low. Str.Y is strongly influenced by the environmental variations and selection on the basis of this trait is less efficient. Therefore, it can only be used as an indirect selection criterion if its correlation with GY is high (Joshi et al., 2019). Under the conditions in which the experience was carried out, the cereal-livestock farming system is largely adopted; thus, varieties with high Str.Y without penalty on GY are sought (Annicchiarico et al., 2005; Chennafi et al., 2011b; Benider et al., 2017). This is not always the case under constraining conditions, such as those that characterize the eastern high plateaus of Algeria where water stress causes variation in the decrease of BIO and/or HI (Haddad et al., 2016; Rabti et al., 2020). NS was significantly correlated with BIO (r=-0.829), Str.Y (r=-0.774), NG (r=0.826), GY (r=0.777) and Econ.Y (r=0.840). The correlation of this trait with HI (r=-0.195) was rather negative and low. The measurement of NS is relatively less laborious and time consuming than those of the variables discussed above. As a visual selection criterion, NS is widely used by experienced wheat breeders in the field to rank segregating populations. Fellahi et al. (2015) illustrated that any increase in NS improved both BIO and GY. HI had positive associations with NG (r=0.144) and GY (r=0.127). Correlations with the other traits, including BIO, Str.Y, PHT and NS, Econ.Y were negatives. These results indicate that, within the F3 generation, HI-based selection significantly improved the HI itself and NG in a short genetic background. NG, GY and Econ.Y, in addition to the high correlations between them (r=0.910, r=0.855, r=0.947), they also exhibited very high relationships with BIO (r=0.755, r=0.843, r=0.971), Str.Y (r=0.619, r=0.697, r=0.890) and NS (r=0.826, r=0.777, r=0.840). These results indicate that BIO, Str.Y and NS positively influenced both grain yield and Econ.Y as well as NG produced per unit area. It was observed that DVP had the least influence on the other traits measured, probably because this characteristic had low genetic variability within the plant material studied as previously indicated by the CVp and CVg. Overall, the analysis of the correlations between the measured variables of the F3 generation suggests that the traits influencing GY, NG and Econ.Y were BIO and NS. These characters are taken into consideration when screening this generation to improve the traits of interest, either individually or as a combination of characters as an index. Mekhlouf and Bouzerzour (2005) analyzed the efficiency of direct and indirect early selection based on grain yield-related traits in two durum wheat populations. According to their findings, the multitraits selection based on BIO and HI was as efficient as direct selection based on GY itself. They concluded also that indirect selection based on BIO and NS was more efficient than indirect selection based on NG.
The phenotypic correlation coefficients in F4 confirmed what it was discussed in F3. The six traits. BIO, Str.Y, NS, NG, GY and Econ.Y had very high correlations between them. Relationships of HI, DVP and PHT with the other traits were weak or insignificant. The findings of this study are in line with the work of researchers previously reported. Terrile et al. (2017) and Boussakouran et al. (2021) pointed out that the best GY in semi-arid areas are the result of the genetic ability to produce more spikes per unit area associated with good spikes fertility. Slafer et al. (2005) as well as Fellahi et al. (2017) mentioned that the contribution to NS was more pronounced than that from NG which is formed in a more favorable period. In contrast, Bányai et al. (2020) reported that mean grain weight played an important role in determining GY in semi-arid environments. Bensemane et al. (2011) and Meziani et al. (2011) reported that the improvement of NS was a cause of the increase in GY of new varieties, as the changes in this plant material for NG were due more to NS produced. Of the nine variables measured in this study, only BIO and GY are of great interest in selection for the targeted region.
Direct and indirect effects intra generation
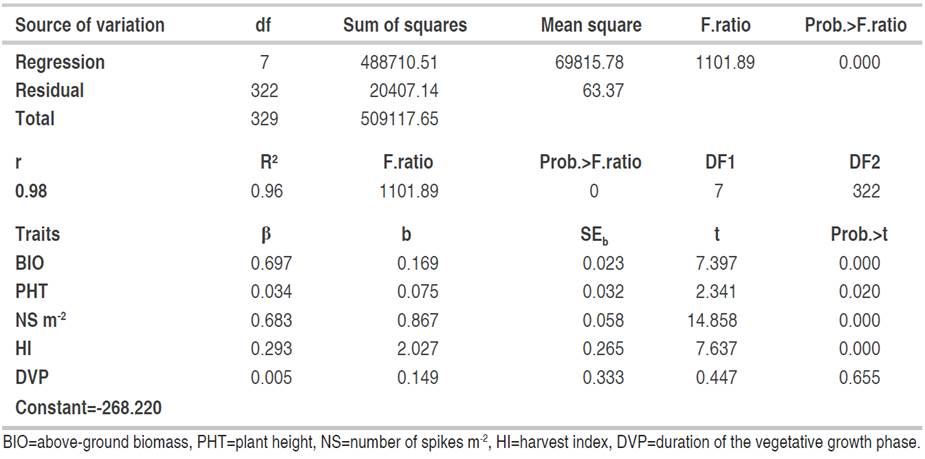
Determinants of grain yield in F3. The multiple regressions including five traits significantly explained the variation of the GY of the F3 generation GY with a coefficient of determination of 96% (Table 3). The analysis of the partial regression coefficients indicated that among the five traits included in the model, the contribution of DVP was not significant (P>0.05) to the explanation of GY variation of the F3 generation as indicated by the partial regression coefficient (b=0.149) of DVP on GY (Table 3). On the other hand, the retained model showed the significant contribution of the three yield related components, namely Str.Y, PHT and HI on the GY.
The direct and indirect effects of the determinant variables of GY in the F3 generation are given in Table 4. The results indicate that the most important direct effects come from the BIO produced (0.697), followed by NS (0.683) and HI (0.293). BIO, in addition to its important direct effect, acted indirectly through NS (0.528) and HI (-0.173). These results are in agreement with the findings of Hannachi et al. (2013) and Mekaoussi et al. (2021) who pointed out that BIO, HI, spike fertility and NS are the most yield determinants traits in the wheat breeding program in eastern semi-arid areas of Algeria. PHT acted indirectly via Str.Y (0.148) and HI (-0.108). In addition to its positive direct effect, the number of spikes acted indirectly via BIO (0.307). Harvest had negative indirect effects on grain yield via BIO (-0.234) and NS (-0.133) even though its direct effect on grain yield was positive. These results indicate that, apart from the DVP, which does not seem to have an effect on the expression of GY of the F3 generation, PHT, Str.Y and HI played an important role, directly and/or indirectly, in grain yield determination. Mekaoussi et al. (2021) found positive direct effect of HI on GY and negative indirect effects through BIO and NS. The same authors also showed that PHT exhibited sizeable indirect effects, positive via NS and negative via NG. In a previous study by Fellahi et al. (2013a), it was demonstrated that the highest positive indirect effects on yield were observed for Str.Y followed by NS per plant and thousand kernel weight (TKW) via BIO.
Table 4 Direct (diagonal) and indirect effects of the determinants of grain yield of the F3 generation (n=330).
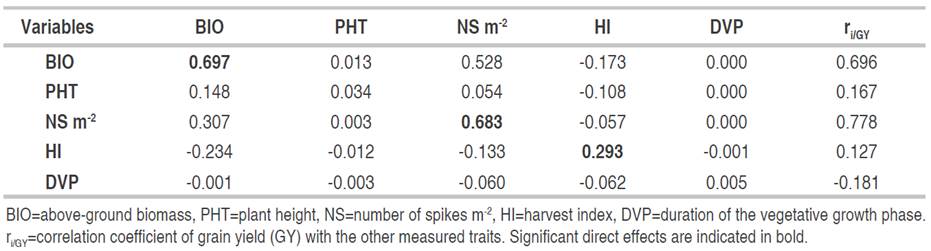
GY appears to be more complex and as the result of direct and indirect effects of several traits including NS, PHT, HI and Str.Y. These results suggest that indirect single-trait selection to improve yield may not be effective, as well as direct selection, because of the large number of variables that determine this trait. Selection-based index appears to be more effective. Indeed, according to Menad et al. (2011), the selection of GY is effective only if the environmental conditions that allowed the achievement of a given GY, are repeated regularly. In this context, Baye et al. (2020) showed that the direct effects of yield components on GY are positive. This indicates that if the means of the components not taken as selection criteria are kept constant, the yield can be improved by increasing the component used as a selection criterion. However, according to Benmahammed et al. (2010), it is practically difficult to control the variation of the components not taken into account in the selection process, following the presence of the genotype × environment interaction. Indeed, according to Fellahi et al. (2018), the selection-based index appears, theoretically and practically, more efficient, given that it offers the possibility of evaluating the role of characters, individually or combined to each other, in randomly matched genetic backgrounds. Fellahi et al. (2013b) reported that the different methods used (correlations, step way regression, path analysis, selection index and principal component analysis) to identify selection criteria, indicate that NS, NG and TKW as determinants of GY. This finding is consistent with the results of this study.
Determinants of grain yield in F4. The multiple regressions including five traits significantly explained the variation of GY of the F4 generation with a coefficient of determination of 99% (Table 5). The analysis of the partial regression coefficient indicated that among the five variables included in this model, PHT did not contribute significantly to the modification of grain yield variation. The partial regression coefficient did not significantly differ from zero (Table 5). The imported model showed that BIO, DVP, NS and HI significantly affected the GY formation (Table 5).
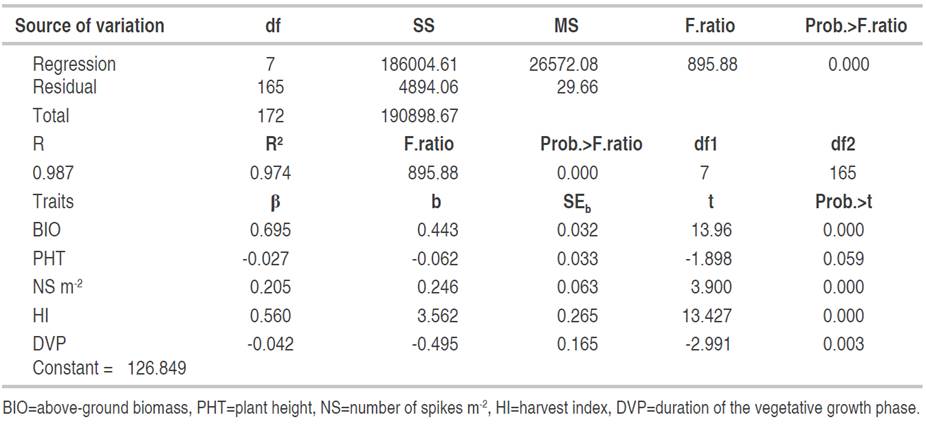
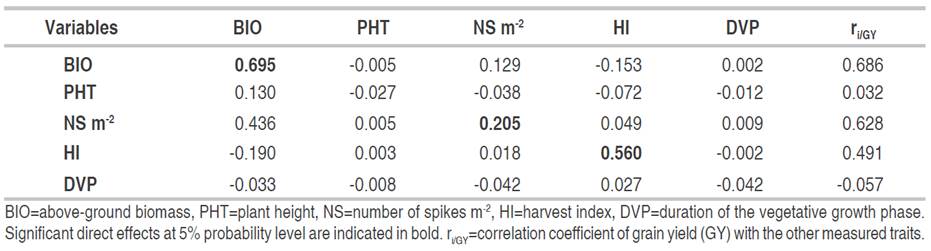
The direct and indirect effects of the F4 generation variables are given in Table 6. The highest direct effects on GY were obtained from the BIO (0.695), HI (0.560) and NS (0.205). BIO also affected GY via NS (0.129) and HI (-0.153). NS acted indirectly via BIO (0.436). HI (-0.190) and PHT (0.130) also contributed indirectly via BIO on yield formation with negative and positive indirect effects, respectively.
Table 6 Direct (diagonal) and indirect effects of the determinants of grain yield of the F4 generation (n=174).
As in F3, the results suggest that in F4, indirect single-trait selection to improve yield may not be effective due to the large number of variables determining this trait. Index selection is likely to be more effective. When using path analysis, Fellahi et al. (2013a) attributed an important role to BIO and HI as indirect criteria for improving GY of an incomplete diallel of bread wheat. These authors reported direct effect values of 1.051 and 0.364 for these two variables, respectively. Hannachi et al. (2013) reported in a half diallel cross of durum wheat that GY was significantly and positively related to BIO, Str.Y and HI. The stepwise regression analysis filtered only BIO and HI as determinants of GY. Mecha et al. (2017) reported positive and significant direct effects of BIO (1.14) and HI (0.780) on GY. These authors suggested taking into account the variation of these variables during selection to improve the yield of bread wheat. The results of this study are also consistent with those of Dabi et al. (2016) who reported significant and positive direct effects of BIO and HI on wheat GY. These authors recommended that the constitution of genetic backgrounds, the choice of parents to be crossed and selection method to increase the yield must be based on these two characteristics.
CONCLUSIONS
Selection can only be effective when significant genetic variability exists in breeding nurseries. In this study, sufficient genetic variability was observed for most of measured variables as indicated by the phenotypic and genotypic coefficients of variability that were found to be high in magnitude both in F3 and F4 generations. These results demonstrated the existence of candidate lines for selection, considering both desired senses of selection (increase or decrease of the traits of interest). Grain yield showed significant and positive correlations with all the traits measured except PHT and HI in F4. Moreover, these results showed that BIO, HI and NS had the highest direct effects associated with significant and positive correlations with GY. These did not change significantly their effects over generations. The true relationship between these traits and GY suggests that selection based on high BIO, NS and HI together is recommended as selection method for further GY improvement in future generations of this breeding program.

