SciELO - Scientific Electronic Library Online

 
vol.17 número3Actividad insecticida y fitotóxica del aceite esencial de Eryngium foetidum L. colombianoEvaluación del control de Burkholderia glumae en el cultivo de arroz (Oryza sativa), FEDEARROZ 67, utilizando nanopartículas de plata (AgNPs) bajo condiciones de invernadero índice de autoresíndice de materiabúsqueda de artículos
Home Pagelista alfabética de revistas  

Servicios Personalizados

Revista

Articulo

Indicadores

Links relacionados

  • En proceso de indezaciónCitado por Google
  • No hay articulos similaresSimilares en SciELO
  • En proceso de indezaciónSimilares en Google

Compartir


Revista Colombiana de Ciencias Hortícolas

versión impresa ISSN 2011-2173

rev.colomb.cienc.hortic. vol.17 no.3 Bogotá sep./dic. 2023  Epub 18-Abr-2024

https://doi.org/10.17584/rcch.2023v17i3.16120 

Section of other species

Selection and evaluation of gene-edited knockout mutants of AtAAP2 and AtCRF4 homologs of rice for agronomic nitrogen use efficiency (ANUE)

Selección y evaluación de mutantes knockout genéticamente editados de homólogos de AtAAP2 y AtCRF4 de arroz para la eficiencia agronómica del uso del nitrógeno (ANUE)

KENTARO WAKATABI1  2  4 
http://orcid.org/0009-0009-0266-9991

MICHAEL GOMEZ SELVARAJ2 
http://orcid.org/0000-0003-2394-0399

DIEGO ALEXANDER GUZMÁN-PRADA2 
http://orcid.org/0009-0009-0420-3917

JUAN BOSCO CUÁSQUER2 
http://orcid.org/0000-0002-7977-883X

KARINA LÓPEZ-LÓPEZ1 
http://orcid.org/0000-0003-3623-4725

MASAKI ENDO3 
http://orcid.org/0000-0002-9199-181X

MANABU ISHITANI2 
http://orcid.org/0000-0002-6950-4018

1 Universidad Nacional de Colombia, Facultad de Ciencias Agropecuarias, Palmira (Colombia).

2 Centro Internacional de Agricultura Tropical, Cali (Colombia).

3 National Agriculture and Food Research Organization, Institute of Agrobiological Sciences, Tsukuba (Japan).


ABSTRACT

Nitrogen (N) is essential for amino acid synthesis in rice production, but its excessive use poses an environmental concern. This research aimed to improve rice agronomic nitrogen use efficiency (ANUE) by knockout (KO) of rice homologs of the two selected genes from Arabidopsis thaliana: AtAAP2, an amino acid permease involved in N transportation in shoots, and AtCRF4, a transcription factor participating in N uptake in roots. The homologs of these genes in rice were identified based on amino acid sequence similarity and knocked out using CRISPR/Cas9 mediated gene editing (GE). The AAP2-KO and CRF4-KO lines were subjected to agronomic evaluations with three N doses: 100% (180 kg ha-1), 50% (90 kg ha-1), and 0% (0 kg ha-1) and showed a 130-175% increase in dry biomass weight and a 183-313% increase in panicle number compared to wild type (WT) in the first experiment. These lines also had slower leaf senescence, the so-called “stay-green” trait, indicating the KO effect of target genes in N metabolism. However, neither AAP2-KO nor CRF4-KO showed better yield or ANUE than WT. This study demonstrated the usefulness of GE technology in gene evaluation and highlighted the effects of AtAAP2 and AtCRF4 genes in the plant N cycle.

Additional key words: amino acid permease 2 (AAP2); cytokinin response factor 4 (CRF4); Oryza sativa L.; remote sensing

RESUMEN

El nitrógeno (N) es esencial para la síntesis de aminoácidos en la producción de arroz, pero su uso excesivo plantea una preocupación ambiental. Esta investigación tuvo como objetivo mejorar la eficiencia agronómica del uso del nitrógeno (ANUE) en el arroz mediante “knockout (KO)” de homólogos en arroz de los dos genes seleccionados de Arabidopsis thaliana: AtAAP2, una permeasa de aminoácidos involucrada en el transporte de N en los brotes, y AtCRF4, un factor de transcripción que participa en la absorción de N en las raíces. Los homólogos de estos genes en el arroz se identificaron por la similitud de la secuencia de aminoácidos y se desactivaron mediante la edición genética (GE) mediada por CRISPR/Cas9. Las líneas AAP2-KO y CRF4-KO fueron sometidas a evaluaciones agronómicas con tres dosis de N: 100% (180 kg ha-1), 50% (90 kg ha-1) y 0% (0 kg ha-1) y mostraron un aumento de 130-175% en peso de biomasa seca y un aumento de 183-313% en número de panículas en comparación con el control (WT) en el primer experimento. Estas líneas también tenían una senescencia foliar más lenta, el denominado rasgo de "permanecer verde", lo que indica el efecto de desactivación de genes del objetivo en el metabolismo del N. Sin embargo, ni AAP2-KO ni CRF4-KO mostraron mejor rendimiento o ANUE que WT. Este estudio demostró la utilidad de la tecnología de edición genética en la evaluación de genes y destacó los efectos de los genes AtAAP2 y AtCRF4 en el ciclo del N de la planta.

Palabras clave adicionales: aminoácido permeasa 2 (AAP2); factor de respuesta de citoquinina 4 (CRF4); Oryza sativa L.; sensores remotos

INTRODUCTION

Rice is a vital crop, providing over 21% of global caloric needs (Fitzgerald et al., 2009). The "Green Revolution" in the 20th century significantly increased rice productivity through the breeding of new cultivars and the application of nitrogen (N) fertilizer (Pingali, 2012). However, excessive N use has negative environmental impacts, including greenhouse gas (GHG) emissions (Martínez-Dalmau et al., 2021). Improving rice nitrogen use efficiency (NUE) is crucial to reduce N fertilizer application and mitigating environmental consequences.

Strategies for enhancing NUE include agronomic approaches like site-specific nutrient management (SSNM) and alternate wetting and drying (AWD) (Mofijul et al., 2016; Chivenge et al., 2021), as well as genetic approaches targeting N-related genes (Sonoda et al., 2003; Hu et al., 2015). Advances in sequencing and genomic tools facilitated the introduction of molecular breeding techniques such as masker-assisted selection (MAS), genetically modified organisms (GMOs), and gene editing (GE) (Collard et al., 2008; Wang and Han, 2022). Currently, clustered regularly interspaced short palindromic repeats and Cas9 nuclease (CRISPR/Cas9) system has become a widely used GE technology for its simple structure and flexible applicability (Zhang et al., 2019).

Previous studies in Arabidopsis thaliana have shown that knockout (KO) mutation of AtAAP2 function decreased seed protein levels (Zhang et al., 2010), but enhanced N allocation and improved the amino acid level in leaves, leading to higher photosynthesis efficiency, carbon fixation ability, and seed yields (Perchlik and Tegeder, 2018). AtCRF4 is a transcription factor (TF) involved in N uptake and assimilation in A. thaliana, engaged in N signaling in shoots and roots (Brooks et al., 2019). Over-expression mutants of AtCRF4 showed decreased N uptake, root biomass, primary root length, and lateral root number, due to inhibition of SNZ and CDF1, two TFs that are involved in N uptake and their expression is controlled by CRF4 (Varala et al., 2018). Therefore, inhibiting AtCRF4 expression could enhance N uptake efficiency by increasing SNZ and CDF1 expressions, which may increase NRT2.1 expression - another key nitrate transporter.

This research aimed to improve rice agronomic NUE (ANUE) by knocking out rice homologs of AtAAP2 and AtCRF4 using CRISPR/Cas9 and evaluating agronomic performance in the field.

MATERIALS AND METHODS

Creation of the KO rice lines by gene editing

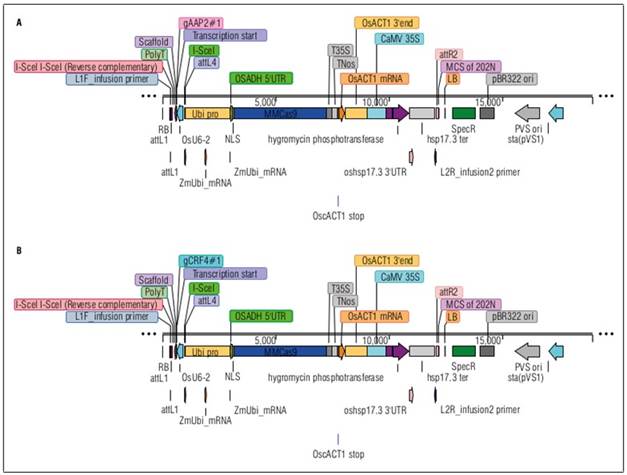
The AAP2-KO and CRF4-KO rice lines were created in the National Agriculture and Food Research Organization (NARO) in Japan by identifying their homologs through bioinformatic research. Their homologs in rice were identified by BLAST search on RAP-DB (https://rapdb.dna.affrc.go.jp/) and SALAD Database (https://salad.dna.affrc.go.jp/salad/) based on the amino acid sequences of the candidate genes on TAIR (https://www.arabidopsis.org/) for A. thaliana. 4 AtAAP2 homologs (LOC4324999, LOC4327987, LOC4336246, LOC4338844) and 1 AtCRF4 homolog (LOC4326729) with certain expression level were identified in rice genome. The target sequences for the gRNA of target genes were selected based on the exon regions and PAM sequence locations, and CRISPR/Cas9 binary vectors with guide RNA (gRNA) were designed for each target gene (Fig. 1).

Figure 1. Vector designs for AtAAP2 homolog (A), and AtCRF4 homolog (B) in rice. 

Agrobacterium tumefasiens competent cell EHA105 was transformed with the plasmids (binary vectors) through electroporation. The transformed Agrobacterium was cultured and selected on solid LB medium with hygromycin. Surviving colonies were stored as glycerol stock. Rice callus induction was achieved on solid N6D medium, followed by infection with transformed Agrobacterium on solid AB medium and co-cultivation on solid 2N6AS medium. After infection, rice calli were sterilized, transferred to N6D medium with hygromycin and meropenem for selection. From those survived calli, DNA samples were extracted to detect candidate calli for regeneration. The selected calli were transferred onto ReIII regeneration medium with meropenem. Regenerated plants were transplanted onto a hormone-free medium, and their DNA was analyzed via PCR and capillary electrophoresis for KO confirmation. Both AAP2-KO and CRF4-KO lines were successfully obtained, and T1 and T2 seeds were sent to the International Center for Tropical Agriculture (CIAT) in Palmira, Valle del Cauca, Colombia for evaluation of agronomic parameters and ANUE. The experimental lines were put in genotyping before the seed shipment (Suppl. Tab. 1).

Design of confined paddy field experiments

A paddy field experiment was conducted at CIAT, following the field design and management from (Selvaraj et al., 2017). To induce soil N depletion, three cycles of maize cultivation without fertilizer application were performed in previous seasons and soil samples were taken from each pool for analysis before transplanting. The experimental field had a split-plot design with three replicates. 14 lines including control were selected for the field experiment based on the mutagenesis location and types (Tab. 1). Seeds were sown on June 24, 2022, and transplanted on July 15 (21 days after sowing, DAS) with 20 cm gaps between plants and 25 cm gaps between rows. Statistical analysis was carried out on seven randomly selected plants per plot after the harvest on October 18 (118 DAS).

Table 1. Rice lines for the field experiment. 

No. Line name Description
1 AAP2-25-1-4 AAP2-KO
2 AAP2-30-8-1 AAP2-KO
3 AAP2-30-8-4 AAP2-KO
4 AAP2-30-8-10 AAP2-KO
5 CRF4-14-2 CRF4-KO
6 CRF4-22-2 CRF4-KO
7 CRF4-25-1 CRF4-KO
8 AAP2-25-1-3(2)-Pl-2 AAP2-KO segregant
9 AAP2-30-8-1-Pl-1 AAP2-KO segregant
10 AAP2-30-8-4-Pl-1 AAP2-KO segregant
11 CRF4-14-2-Pl-1 CRF4-KO segregant
12 CRF4-22-2-Pl-1 CRF4-KO segregant
13 CRF4-25-1-Pl-1 CRF4-KO segregant
14 WT Nipponbare Control

Nitrogen fertilizer was applied in the following treatments: (i) N 0% pool (N0%) received 0 kg ha-1, (ii) N 50% pool (N50%) received 90 kg ha-1, and (iii) N 100% pool (N100%) received 180 kg ha-1. The rate of 180 kg ha-1 for N100% was based on the farmers' practice in Colombia (Berrío et al., 2002). Actual N fertilizer weights were adjusted accordingly. In N100%, urea was applied in three splits, while N50% received half the amount following the same application regime as N100%. Other nutrients were applied as basal fertilizer at the standard rate in Colombia.

For statistical analysis and ANUE calculation, seven randomly selected plants from each plot were harvested. Eight agronomic parameters were examined: plant height (PH), stem number (SN), panicle number (PN), panicle length (PL), filled grain weight (FG), empty grain weight (EG), dry biomass weight (DB), and 1,000-grain weight (1000GW).

ANUE calculation

ANUE is an NUE index calculated using yields (kg ha-1) from the N-applied and non-fertilized control fields. It assesses the yield contribution of the N application by comparing it to the control. ANUE range is typically 10-30 kg kg-1, with a value of 25 or higher indicating efficient management or low soil N supply (Congreves et al., 2021). The ANUE formula (Eq. 1) is derived from (Craswell and Godwin, 1984)

Agronomic NUE=Grain yieldF-Grain yieldCApplied N fertilizerkg kg -1[/p] (1)

where, F = fertilized crop, C = unfertilized control.

NDVI and NDRE analysis

Plant monitoring by vegetation indices (VIs) was carried out during the paddy field experiment based on the protocols by Selvaraj et al. (2020). Normalized difference vegetation index (NDVI) and normalized difference red-edge (NDRE) were the VIs used to measure plant health and density. NDVI uses the near-infrared (NIR) and red (RED) spectral bands to measure greenness, while NDRE employs the red edge (REDGE) spectral band provided by MicaSense (Boiarskii and Hasegawa, 2019). A drone DJI MATRICE 600 and a multispectral camera MicaSense Altum (MicaSense, Seattle, Washington, USA) were used to take aerial pictures. Ground control points (GCPs) were installed for georeferencing, and QGIS (https://www.qgis.org) was used to designate the regions of interest (ROIs) in the aerial pictures. The vegetation indices were extracted on CIAT Pheno-i (http://pheno-i.ciat.cgiar.org). Statistical analysis on NDVI and NDRE was conducted at 60 DAS (heading), 70 DAS (flowering), 81 DAS (milky-grain), and 88 DAS (grain-filling).

The formulas for NDVI (Eq. 2) and NDRE (Eq. 3) are as follows (Tucker, 1979; Barnes et al., 2000).

NDVI=NIR-REDNIR+RED[/p] (2)

NDRE=NIR-REDGENIR+REDGE[/p] (3)

Statistical analysis

The statistical analyses were carried out on Statistical Analysis System SAS 9.4 (SAS Institute Inc., Cary, NC, USA). The mixed model was employed for the analysis of the field experiments, assuming N treatment, genotype, and interactions of N treatment and genotype as fixed effects, and the blocks as random effects. Duncan’s multiple range test was used to detect significant effects in the variation on the agronomic parameters and ANUE between all experimental lines. Meanwhile, Dunnett's test was used for NDVI and NDRE analysis to compare the extracted VI values between WT and KO lines at P = 0.05 in both tests.

Inserted marker hpt cassette analysis

Leaf samples were collected during the field experiment at CIAT for genomic DNA extraction to detect the remaining CRISPR/Cas9 cassette by PCR for hpt gene, the selection marker used in this study. Seven plants were randomly selected from each line in block 1 of N100% on September 1st, 2022 and their flag leaves were collected. Genomic DNA from the samples was extracted based on the protocol by Risterucci et al. (2000) and modified by M. Lorieux in 2002. The dissolved genomic DNA of each sample was stored at -20°C until genetic analysis by PCR. To detect hpt gene, primers HPT-F3 (5´-AGT-TCG-ACA-GCG-TCT-CCG-ACC-TGA-3´) and HPT-R1 (5´-TGC-CGT-CAA-CCA-AGC-TCT-GAT-AGA-GT-3´) were used, which amplify a 792 bp fragment. The PCR mix contained 2X GoTaq Master MIX (Promega, Madison, WI, USA), 0.5 μL of genomic DNA, and 0.25 μM each HPT-F3 / HPT-R1 primer. The conditions of the thermocycler were: 98°C for 3 min, 35 cycles of 98 °C for 15 s and 68°C for 1 min were repeated. PCR products were checked on 1.2% agarose gel with SYBR Safe DNA Stain (Thermo Fisher Scientific Inc., Waltham, MA, USA).

RESULTS AND DISCUSSION

Field experiment of the KO lines in a paddy field for agronomic traits and ANUE

The soil analysis before the transplanting showed the average soil pH was 8.48 and the average POXC content was 11.81 g kg-1 which is low. The average NH4 + and NO3 - contents were 7.711 and 5.944 mg kg-1, respectively.

In the field experiment, visually noticeable phenotypic differences were observed between WT and KO lines. The KO lines, whether AAP2-KO or CRF4-KO, exhibited shorter plant height, a greater stem number, and greener color during the grain-filling stage (Fig. 2).

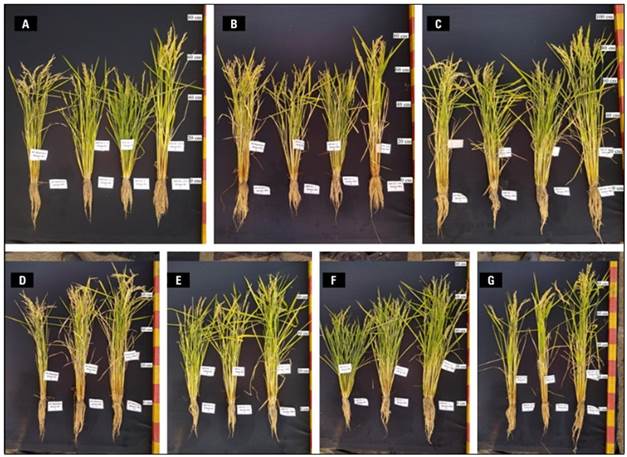
Figure 2. Rice plants from the second paddy field experiment on October 1st (99 DAS) by N treatment; from left to right: WT, AAP2-25-1-4, CRF4-22-2 (Original GE line), and CRF4-22-2-Pl-1 (segregant line) in 0% N pool (N0%) (A), 50% N pool (N50%) (B), and 100% N pool (N100%) (C). By genotypes, WT (D), AAP2-25-1-4 (E), CRF4-22-2 (F), and CRF4-22-2-Pl-1 (G), from left to right: N0%, N50%, and N100% in each picture. 

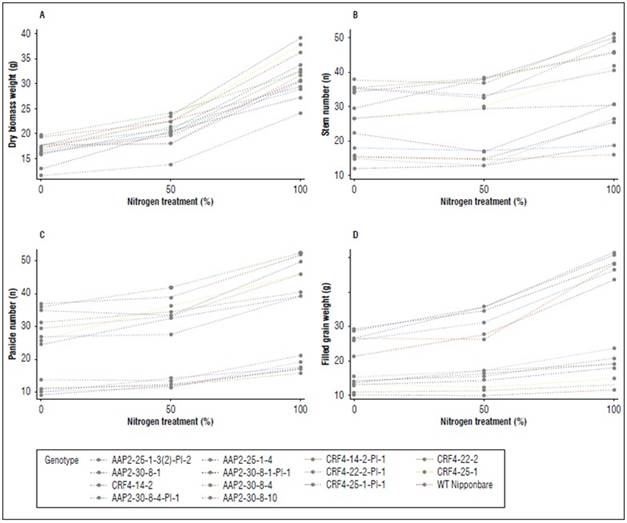
Significant differences were observed between genotypes (G), N levels, and G x N interactions in FG, EG, PH, SN, PN, and DB. PL did not show any G x N interaction (Suppl. Tab. 2). KO lines generally displayed increased EG, SN, PN, and DB, along with reduced FG, 1000GW, PH, and PL (Fig. 3). The ranges of SN, PN, and DB in AAP2-KO and CRF4-KO lines were 118-228%, 183-313%, and 130-175% compared to WT, respectively (Suppl. Tab. 2). The AAP2-KO segregant and CRF4-KO segregant lines exhibited different tendencies, with generally higher 1000GW, PH, and DB, and lower SN compared to WT (Suppl. Tab. 2). Most lines responded well to N applications in terms of DB, SN, PN, and FG, however, WT and the segregant lines were more sensitive to N application compared to the original AAP2-KO and CRF4-KO lines (Suppl. Fig. 1).

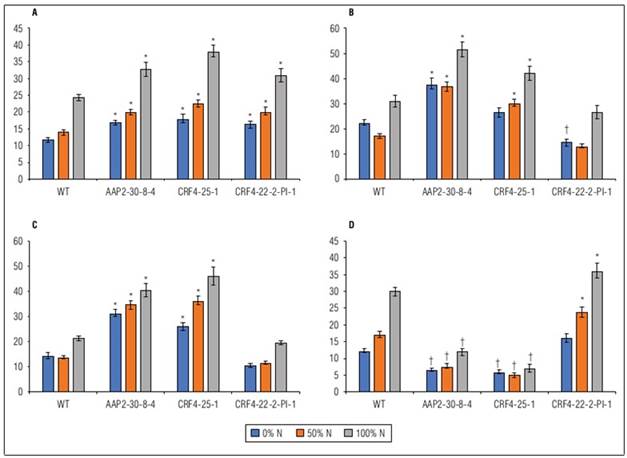
Figure 3. Means of WT, AAP2-30-8-4, CRF4-25-1, and CRF4-22-2-Pl-1 on dry biomass weight g/plant (A), stem number (B), panicle number (C), and filled grain weight g/plant (D) under different N application regimes in the second field experiment. Values are means±SE of 21 plants. * indicates a significantly higher value and † indicates a significantly lower value at P<0.05. 

ANUE of the KO lines in the field experiment

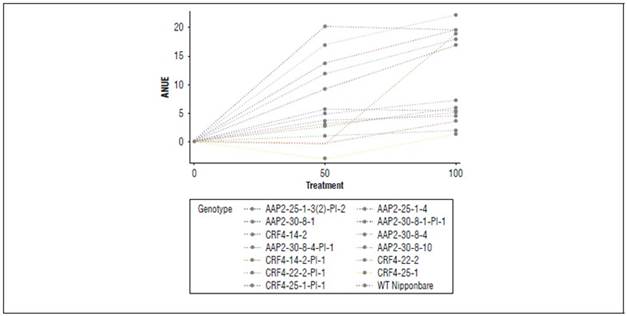
ANUE was calculated after collecting agronomic parameter data. Significant differences were observed in genotypes, N application rates, and G x N interactions in ANUE (Tab. 2). All the original AAP2-KO and CRF4-KO lines exhibited significantly lower ANUE than WT, regardless of N application rates. The segregant lines, such as CRF4-22-2-Pl-1 at N50% and N100% and CRF4-25-1-Pl-1 at N50%, demonstrated higher ANUE than WT, although these were not significant. Overall, the field experiment showed a superior increase of ANUE in WT and the segregant lines with increasing N application, meanwhile, the reaction to N application was weaker in the KO lines (Suppl. Fig. 2).

Table 2. Agronomic nitrogen use efficiency (ANUE) calculated from the field experiment. 

Genotype Treatment Agronomic nitrogen use efficiency (ANUE)
WT Nipponbare 50% 13.85±2.78
WT Nipponbare 100% 19.57±1.25
AAP2-25-1-4 50% 3.10±0.11†
AAP2-25-1-4 100% 4.99±1.02†
AAP2-30-8-1 50% 5.68±2.91†
AAP2-30-8-1 100% 5.27±0.61†
AAP2-30-8-4 50% 2.60±2.47†
AAP2-30-8-4 100% 5.92±1.23†
AAP2-30-8-10 50% 4.81±0.14†
AAP2-30-8-10 100% 7.16±0.12†
CRF4-14-2 50% -0.33±1.49†
CRF4-14-2 100% 3.63±0.32†
CRF4-22-2 50% 0.90±0.64†
CRF4-22-2 100% 1.91±2.54†
CRF4-25-1 50% -3.17±1.38†
CRF4-25-1 100% 1.26±0.39†
AAP2-25-1-3(2)-Pl-2 50% 3.76±0.77†
AAP2-25-1-3(2)-Pl-2 100% 4.42±0.39†
AAP2-30-8-1-Pl-1 50% 9.20±2.08
AAP2-30-8-1-Pl-1 100% 16.86±3.92
AAP2-30-8-4-Pl-1 50% 11.85±2.13
AAP2-30-8-4-Pl-1 100% 17.96±3.47
CRF4-14-2-Pl-1 50% -0.53±2.83†
CRF4-14-2-Pl-1 100% 19.02±3.91
CRF4-22-2-Pl-1 50% 16.96±3.13
CRF4-22-2-Pl-1 100% 22.23±3.42
CRF4-25-1-Pl-1 50% 20.21±12.12
CRF4-25-1-Pl-1 100% 19.51±0.21
Genotype (G) **
N level (N) **
G x N **
CV % 63.57
Mean 5.57

Values are means ± standard error (SE) from 21 plants. * significantly higher than wild type (WT) (P<0.05), ** significantly higher than WT (P<0.01), † significantly lower than WT (P<0.05).

NDVI and NDRE analysis in the field experiments

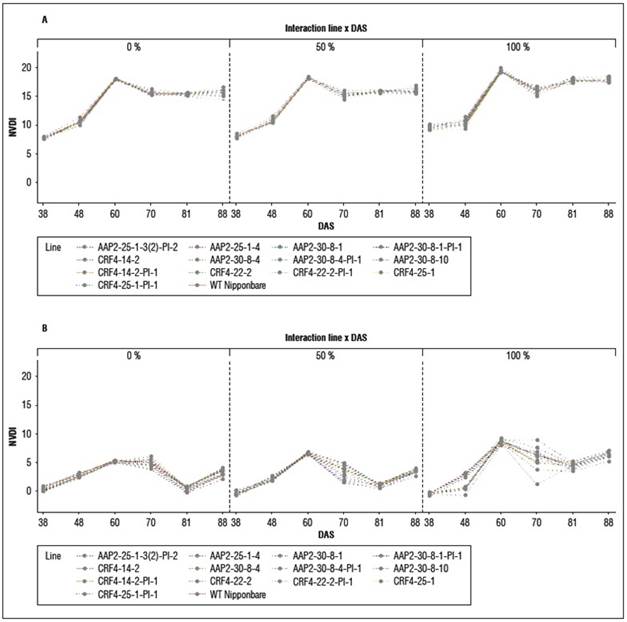
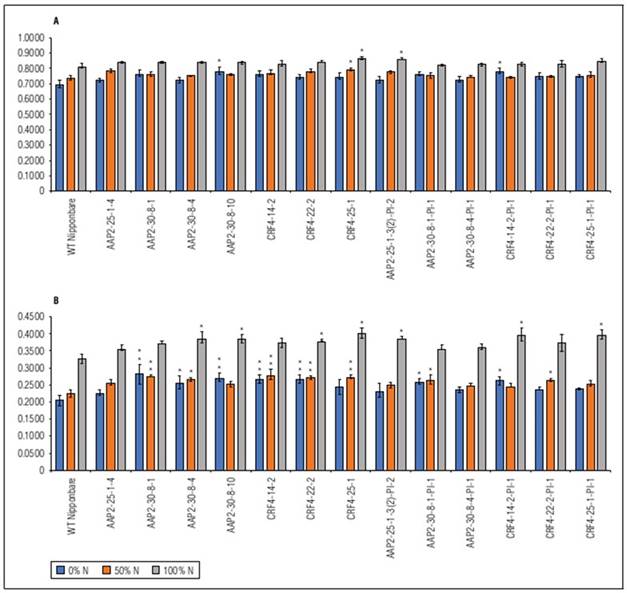
There were no significant differences in NDVI and NDRE values between genotypes at 60 DAS, 70 DAS, and 81 DAS, except for some plots at 60 DAS and 81 DAS (Suppl. Tab. 3; Suppl. Tab. 4). However, NDRE detected more differences at 88 DAS, with 11 lines of KO and KO-segregated lines exhibiting higher NDRE values than WT under different N conditions (Fig. 4). The dynamics of NDVI were similar between genotypes and N levels, while in NDRE, the dynamics between N levels were more distinct (Suppl. Fig. 3), and differences between genotypes were evident at certain time points. These findings align with the visual observations in the field, indicating that AAP2-KO and CRF4-KO lines retained their greenness for a longer duration compared to WT, particularly after flowering and grain filling.

Figure 4. Normalized Difference Vegetation Index (NDVI) (A) and Normalized Difference Red Edge (NDRE) (B) values at 88 DAS. Values are means ±SE from three blocks. * and ** indicate a significantly higher value at P<0.05 and P<0.01, respectively. 

Genetic analysis of CRISPR/Cas9 cassette

The existence of the hpt between original AAP2-KO lines varied, and all the original CRF4-KO lines possessed it as confirmed in the previous genotyping before the seed shipment (Fig. 5). Regarding the CRF4-KO segregant lines, the hpt gene was detected from six of the seven samples in CRF4-14-2-Pl-1 and CRF4-25-1-Pl-1, and all seven samples in CRF4-22-2-Pl-1. However, among the AAP2-KO segregant lines, AAP2-30-8-1-Pl-1, AAP2-30-8-4-Pl-1, and AAP2-25-1-3(2)-Pl-2 had the hpt gene in four, two, and three of the collected seven samples, respectively.

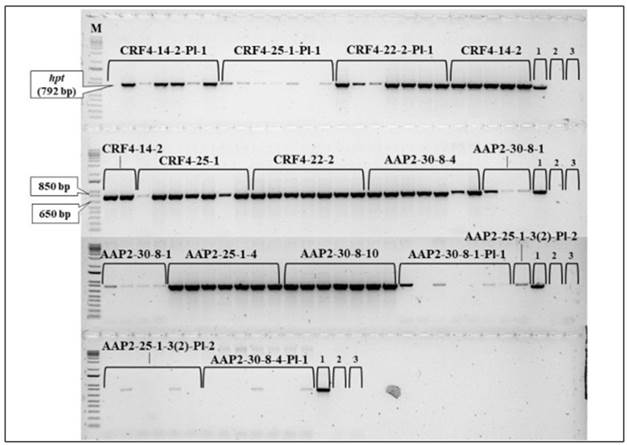
Figure 5.  hpt detection by PCR between the rice lines in the field experiment. 1.2 % agarose gel with SYBR Safe DNA Stain (Thermo Fisher Scientific). The numbers in the figure indicate: 1, plasmid with hpt (positive control); 2, WT Nipponbare (negative control); 3, distilled water (control negative). M: 1Kb PLUS DNA Ladder (Invitrogen), 0.5 ug uL -1 . 

Knockout of AtAAP2 and AtCRF4 homologs delayed senescence of rice plant

In our study, we used CRISPR/Cas9 to knock out the homologs of two selected A. thaliana genes in rice. The AAP2-KO and CRF4-KO lines exhibited prolonged greenness during the grain-filling stage, as indicated by NDVI and NDRE analysis (Fig. 4). This "stay-green" phenotype may contribute to increased biomass or yield (Borrell et al., 2001). However, the impact of “stay-green” is still debated in previous studies, with both positive (Borrell et al., 2000; Fu et al., 2009) and negative (Cha et al., 2002; Zang et al., 2022) effects reported. The AAP2-KO and CRF4-KO lines may possess a type B or C stay-green phenotype (Thomas and Howarth, 2000), as they showed similar VI dynamics to the wild type during vegetative growth but higher NDVI or NDRE values later on (Suppl. Tab. 3; Suppl. Tab. 4). The knockout of AtAAP2 and AtCRF4 homologs likely affected the N pathways in the rice plants, as senescence involves chlorophyll degradation and N remobilization (Zang et al., 2022).

One possible explanation for the observed features in the KO lines is that the knockout of the target gene(s) disrupted the translocation of N and photosynthetic products from the source to sink tissues. Another hypothesis suggests that the phenotypic features in CRF4-KO lines may be due to interactions between NRT2.1 and other nitrate transporters. AtCRF4 regulates the expression of the high-affinity nitrate transporter NRT2.1 (Varala et al., 2018), and previous studies have shown that OsNRT2.1 requires the partner protein OsNAR2.1 to enhance its N uptake activity (Feng et al., 2011). Altered N uptake was not observed when OsNRTs were overexpressed under the constitutive S35 promoter (Katayama et al., 2009). Transgenic lines of OsNRT2.1 with different promoters exhibited varying levels of agronomic nitrogen use efficiency (ANUE) and dry matter translocation to grains (Chen et al., 2016). The complete knockout of the AtCRF4 homolog in rice likely led to an abundant expression of nitrate transporters throughout the plant body due to the lack of the TF that represses their expression and might induce an overexpression-like condition. In a similar experiment, transgenic lines with OsNRT2.1 overexpression under a constitutive promoter displayed shorter plant height and lower yield (Chen et al., 2016), although not as extreme as observed in our CRF4-KO lines. These findings align with our observations.

The AAP2-KO and CRF4-KO lines did not exhibit improved ANUE compared to WT, likely due to lower yield and limited response to N application (Fig. 3; Tab. 2). The cause of this reduced yield is still uncertain. One possible explanation is that delayed senescence hindered N remobilization, leading to lower yield (Zang et al., 2022). Alternatively, lower seed setting rates could have inhibited shoot senescence by lacking the destination for N remobilization, as rice leaf senescence primarily occurs before plant death to facilitate nutrient transfer to seeds (Lee and Masclaux-Daubresse, 2021). Moreover, genetic variations among AAP2-KO genotypes might contribute to yield fluctuations and lower ANUE (Suppl. Tab. 1). The increased stem and panicle numbers in the KO lines could be related to the "stay-green" trait, which has been shown to positively correlate with fertile stem numbers (Luche et al., 2015). There is a study that observed similar trends with higher panicle numbers and shorter plant heights in stay-green lines (Sakuraba et al., 2015). Overexpressing the low-affinity nitrate transporter OsNPF7.2 also enhanced the tiller number and grain yield (Wang et al., 2018), suggesting interactions between stay-green trait, tiller number, and nitrate transporters in rice.

The observed phenotypic difference in the segregant lines might be due to the recovery of fertility as most of them showed normal or higher yield per plant than WT (Suppl. Tab. 2). However, detecting the genetic differences between the original KO and segregant lines can be challenging since they may be due to somaclonal or off-target mutations, although our gRNAs were designed to reduce the possibility of this unfavorable event (Miyao et al., 2012; Zhang et al., 2015). Detecting genetic mutations in non-target regions is usually more laborious than sequencing the target regions (Shillito et al., 2021).

CONCLUSION

Both AAP2-KO and CRF4-KO rice lines showed distinct phenotypic features from WT such as shorter plants, increased stem and panicle numbers, and dry biomass weight in the two field experiments. The KO lines also showed delayed leaf senescence; thus, it is evident that the KOs of the target genes affected the N cycles and pathways in rice plants. However, neither AAP2-KO nor CRF4-KO showed better yield or ANUE than WT. This study demonstrated the usefulness of GE technology in gene evaluation and highlighted the effects of AtAAP2 and AtCRF4 genes in the plant N cycle.

Acknowledgments

We would like to show our gratitude to Dr. Paul Chavarriga and Sandra Valdés for their help in the PCR analysis and to Franio Benavides and Blanca Cerón for their support in the field evaluation and data taking. This work was financially supported by the Ministry of Agriculture, Forestry and Fisheries (MAFF) of Japan as a part of the project “Development of Cultivation Management System to Reduce Greenhouse Gas Derived from Agriculture and its Crop Development.”

BIBLIOGRAPHIC REFERENCES

Barnes, E.M., T.R. Clarke, S.E. Richards, P.D. Colaizzi, J. Haberland, P. Waller, C. Choi, E. Riley, T. Thompson, R.J. Lascano, H. Li, and M.S. Moran. 2000. Coincident detection of crop water stress, nitrogen status, and canopy density using ground based multispectral data. In: Proc. 5th Int. Conf. Precision Agric. ASA-CSSA-SSSA, Madison WI. [ Links ]

Berrío, L.E., L.R. Sanint, F. Correa, and E. Tulande. 2002. Respuesta al uso de nitrógeno en variedades de arroz sembradas en Colombia, 1950-1999. Foro Arrocero Latinoam. 8(2), 22-23. http://ciat-library.ciat.cgiar.org/Articulos_CIAT/flar/respuesta.pdf Links ]

Boiarskii, B. and H. Hasegawa. 2019. Comparison of NDVI and NDRE indices to detect differences in vegetation and chlorophyll content. J. Mech. Continua Math. Sci. (Suppl. 4). Doi: 10.26782/jmcms.spl.4/2019.11.00003 [ Links ]

Borrell, A.K., G.L. Hammer, and A.C.L. Douglas. 2000. Does maintaining green leaf area in sorghum improve yield under drought? I. Leaf growth and senescence. Crop Sci. 40(4), 1026-1037. Doi: 10.2135/cropsci2000.4041026x [ Links ]

Borrell, A., G. Hammer, and E. Van Oosterom. 2001. Stay-green: a consequence of the balance between supply and demand for nitrogen during grain filling? Ann. Appl. Biol. 138(1), 91-95. Doi: 10.1111/j.1744-7348.2001.tb00088.x [ Links ]

Brooks, M.D., J. Cirrone, A.V. Pasquino, J.M. Alvarez, J. Swift, S. Mittal, C.-L. Juang, K. Varala, R.A. Gutiérrez, G. Krouk, D. Shasha, and G.M. Coruzzi. 2019. Network walking charts transcriptional dynamics of nitrogen signaling by integrating validated and predicted genome-wide interactions. Nat. Commun. 10, 1569. Doi: 10.1038/s41467-019-09522-1 [ Links ]

Cha, K.-W., Y.-J. Lee, H.-J. Koh, B.-M. Lee, Y.-W. Nam , and N.-C. Paek. 2002. Isolation, characterization, and mapping of the stay green mutant in rice. Theor. Appl. Genet. 104, 526-532. Doi: 10.1007/s001220100750 [ Links ]

Chen, J., Y. Zhang, Y. Tan, M. Zhang, L. Zhu, G. Xu, and X. Fan. 2016. Agronomic nitrogen-use efficiency of rice can be increased by driving OsNRT2.1 expression with the OsNAR2.1 promoter. Plant Biotechnol. J. 14(8), 1705-1715. Doi: 10.1111/pbi.12531 [ Links ]

Chivenge, P., S. Sharma, M.A. Bunquin, and J. Hellin. 2021. Improving nitrogen use efficiency-a key for sustainable rice production systems. Front. Sustain. Food Syst. 5, 737412. Doi: 10.3389/fsufs.2021.737412 [ Links ]

Collard, B.C.Y., C.M. Vera Cruz, K.L. McNally, P.S. Virk, and D.J. Mackill. 2008. Rice molecular breeding laboratories in the genomics era: current status and future considerations. Int. J. Plant Genomics 2008, 524847. Doi: 10.1155/2008/524847 [ Links ]

Congreves, K.A., O. Otchere, D. Ferland, S. Farzadfar, S. Williams, and M.M. Arcand. 2021. Nitrogen use efficiency definitions of today and tomorrow. Front. Plant Sci. 12, 637108. Doi: 10.3389/fpls.2021.637108 [ Links ]

Craswell, E.T. and D.C. Godwin. 1984. The efficiency of nitrogen fertilizers applied to cereals in different climates. Adv. Plant Nutr. 1, 1-55. [ Links ]

Feng, H., M. Yan, X. Fan, B. Li, Q. Shen, A.J. Miller, and G. Xu. 2011. Spatial expression and regulation of rice high-affinity nitrate transporters by nitrogen and carbon status. J. Exp. Bot. 62(7), 2319-2332. Doi: 10.1093/jxb/erq403 [ Links ]

Fitzgerald, M.A., S.R. McCouch, and R.D. Hall. 2009. Not just a grain of rice: the quest for quality. Trends Plant Sci. 14(3), 133-139. Doi: 10.1016/j.tplants.2008.12.004 [ Links ]

Fu, J.-D., Y.-F. Yan, and B.-W. Lee. 2009. Physiological characteristics of a functional stay-green rice “SNU-SG1” during grain-filling period. J. Crop Sci. Biotechnol. 12(1), 47-52. Doi: 10.1007/s12892-009-0078-8 [ Links ]

Hu, B., W. Wang, S. Ou, J. Tang, H. Li, R. Che, Z. Zhang, X. Chai, H. Wang, Y. Wang, C. Liang, L. Liu, Z. Piao, Q. Deng, K. Deng, C. Xu, Y. Liang, L. Zhang, L. Li, and C. Chu. 2015. Variation in NRT1.1B contributes to nitrate-use divergence between rice subspecies. Nat. Genet. 47(7), 834-838. Doi: 10.1038/ng.3337 [ Links ]

Katayama, H., M. Mori, Y. Kawamura, T. Tanaka, M. Mori, and H. Hasegawa. 2009. Production and characterization of transgenic rice plants carrying a high-affinity nitrate transporter gene (OsNRT2.1). Breed. Sci. 59(3), 237-243. Doi: 10.1270/jsbbs.59.237 [ Links ]

Lee, S. and C. Masclaux-Daubresse. 2021. Current understanding of leaf senescence in rice. Int. J. Mol. Sci. 22(9), 4515. Doi: 10.3390/ijms22094515 [ Links ]

Luche, H.S., J.A.G. Silva, L.C. Maia, and A.C. Oliveira. 2015. Stay-green: a potentiality in plant breeding. Cienc. Rural 45(10), 1755-1760. Doi: 10.1590/0103-8478cr20140662 [ Links ]

Martínez-Dalmau, J., J. Berbel, and R. Ordóñez-Fernández. 2021. Nitrogen fertilization. A review of the risks associated with the inefficiency of its use and policy responses. Sustainability 13(10), 5625. Doi: 10.3390/su13105625 [ Links ]

Miyao, A., M. Nakagome, T. Ohnuma, H. Yamagata, H. Kanamori, Y. Katayose, A. Takahashi, T. Matsumoto, and H. Hirochika. 2012. Molecular spectrum of somaclonal variation in regenerated rice revealed by whole-genome sequencing. Plant Cell Physiol. 53(1), 256-264. Doi: 10.1093/pcp/pcr172 [ Links ]

Mofijul, S.M., Y.K. Gaihre, A.L. Shah, U. Singh, M.I.U. Sarkar, M.A. Satter, J. Sanabria, and J.C. Biswas. 2016. Rice yields and nitrogen use efficiency with different fertilizers and water management under intensive lowland rice cropping systems in Bangladesh. Nutr. Cycl. Agroecosyst. 106(2), 143-156. Doi: 10.1007/s10705-016-9795-9 [ Links ]

Perchlik, M. and M. Tegeder. 2018. Leaf amino acid supply affects photosynthetic and plant nitrogen use efficiency under nitrogen stress. Plant Physiol. 178(1), 174-188. Doi: 10.1104/pp.18.00597 [ Links ]

Pingali, P.L. 2012. Green revolution: impacts, limits, and the path ahead. Proc. Natl. Acad. Sci. U.S.A. 109(31), 12302-12308. Doi: 10.1073/pnas.0912953109 [ Links ]

Risterucci, A.M., L. Grivet, J.A.K. N’Goran, I. Pieretti, M.H. Flament, and C. Lanaud. 2000. A high-density linkage map of Theobroma cacao L. Theor. Appl. Genet. 101, 948-955. Doi: 10.1007/s001220051566 [ Links ]

Sakuraba, Y., W. Piao, J.H. Lim, S.-H. Han, Y.-S. Kim, G. An, and N.-C. Paek. 2015. Rice ONAC106 inhibits leaf senescence and increases salt tolerance and tiller angle. Plant Cell Physiol. 56(12), 2325-2339. Doi: 10.1093/pcp/pcv144 [ Links ]

Selvaraj, M.G., M. Valderrama, D. Guzman, M. Valencia, H. Ruiz, and A. Acharjee. 2020. Machine learning for high-throughput field phenotyping and image processing provides insight into the association of above and below-ground traits in cassava (Manihot esculenta Crantz). Plant Methods 16, 87. Doi: 10.1186/s13007-020-00625-1 [ Links ]

Selvaraj, M.G., M.O. Valencia, S. Ogawa, Y. Lu, L. Wu, C. Downs, W. Skinner, Z. Lu, J.C. Kridl, M. Ishitani, and J. van Boxtel. 2017. Development and field performance of nitrogen use efficient rice lines for Africa. Plant Biotechnol. J. 15(6), 775-787. Doi: 10.1111/pbi.12675 [ Links ]

Shillito, R.D., S. Whitt, M. Ross, F. Ghavami, D. De Vleesschauwer, K. D’Halluin, A. Van Hoecke, and F. Meulewaeter. 2021. Detection of genome edits in plants-from editing to seed. In Vitro Cell. Dev. Biol.-Plant 57, 595-608. Doi: 10.1007/s11627-021-10214-z [ Links ]

Sonoda, Y., A. Ikeda, S. Saiki, N. Von Wirén, T. Yamaya, and J. Yamaguchi. 2003. Distinct expression and function of three ammonium transporter genes (OsAMT1;1-1;3) in rice. Plant Cell Physiol. 44(7), 726-734. Doi: 10.1093/pcp/pcg083 [ Links ]

Thomas, H. and C.J. Howarth. 2000. Five ways to stay green. J. Exp. Bot. 51(Suppl. 1), 329-337. Doi: 10.1093/jexbot/51.suppl_1.329 [ Links ]

Tucker, C.J. 1979. Red and photographic infrared linear combinations for monitoring vegetation. Remote Sens. Environ. 8(2), 127-150. Doi: 10.1016/0034-4257(79)90013-0 [ Links ]

Varala, K., A. Marshall-Colón, J. Cirrone, M.D. Brooks, A.V. Pasquino, S. Léran, S. Mittal, T.M. Rock, M.B. Edwards, G.J. Kim, S. Ruffel, W.R. McCombie, D. Shasha, and G.M. Coruzzi. 2018. Temporal transcriptional logic of dynamic regulatory networks underlying nitrogen signaling and use in plants. Proc. Natl. Acad. Sci. U.S.A. 115(25), 6494-6499. Doi: 10.1073/pnas.1721487115 [ Links ]

Wang, C. and B. Han. 2022. Twenty years of rice genomics research: from sequencing and functional genomics to quantitative genomics. Mol. Plant 15(4), 593-619. Doi: 10.1016/j.molp.2022.03.009 [ Links ]

Wang, J., K. Lu, H. Nie, Q. Zeng, B. Wu, J. Qian, and Z. Fang. 2018. Rice nitrate transporter OsNPF7.2 positively regulates tiller number and grain yield. Rice 11, 12. Doi: 10.1186/s12284-018-0205-6 [ Links ]

Zang, Y., Y. Yao, Z. Xu, B. Wang, Y. Mao, W. Wang, W. Zhang, H. Zhang, L. Liu, Z. Wang, G. Liang, J. Yang, Y. Zhou, and J. Gu. 2022. The relationships among “STAY-GREEN” trait, post-anthesis assimilate remobilization, and grain yield in rice (Oryza sativa L.). Int. J. Mol. Sci. 23(22), 13668. Doi: 10.3390/ijms232213668 [ Links ]

Zhang, L., Q. Tan, R. Lee, A. Trethewy, Y.-H. Lee, and M. Tegeder. 2010. Altered xylem-phloem transfer of amino acids affects metabolism and leads to increased seed yield and oil content in Arabidopsis. Plant Cell 22(11), 3603-3620. Doi: 10.1105/tpc.110.073833 [ Links ]

Zhang, X.-H., L.Y. Tee, X.-G. Wang, Q.-S. Huang, and S.-H. Yang. 2015. Off-target effects in CRISPR/Cas9-mediated genome engineering. Mol. Ther. Nucleic Acids 4, e264. Doi: 10.1038/mtna.2015.37 [ Links ]

Zhang, Y., K. Massel, I.D. Godwin, and C. Gao. 2019. Applications and potential of genome editing in crop improvement. Genome Biol. 20(1), 13. Doi: 10.1186/s13059-019-1622-6 [ Links ]

Appendix

Supplementary Table 1. Genotyping result of the KO lines. 

Line Plant No. hpt Chr. 1 Chr. 2 Chr. 4 Chr. 5
AAP2-25-1 1 + mono-allelic or bi-allelic* T insertion homo WT WT
2 WT+T insertion WT + T insertion
4 T insertion homo WT+T insertion
APP2-25-1-3(2) 1 + mono-allelic or bi-allelic 12 bp after the cleavage site* T insertion homo T insertion homo WT+T insertion
2 T insertion homo WT+T insertion
3 WT+T insertion WT+T insertion
4 WT+T insertion WT+T insertion
5 T insertion homo T insertion homo
APP2-25-1-4 1 + T insertion homo T insertion homo WT WT+T insertion
2 WT WT
3 WT 10 bp deletion+WT
4 WT WT+T insertion
APP2-30-8 1 + mono-allelic or bi-allelic* T insertion homo WT+T insertion WT+T insertion
2 T insertion homo WT
3 10 bp deletion + T insertion WT+T insertion
5 10 bp deletion + T insertion WT+T insertion
APP2-30-8-1 2 - T insertion homo T insertion homo T insertion homo WT
3 T insertion homo WT
4 10 bp deletion homo WT
5 T insertion homo WT
APP2-30-8-2 1 + T insertion homo T insertion homo 10 bp deletion homo WT+T insertion
2 T insertion homo WT+T insertion
3 T insertion homo WT+T insertion
4 10 bp deletion homo WT
5 10 bp deletion+ T insertion WT+T insertion
APP2-30-8-4 1 + mono-allelic or bi-allelic* T insertion homo 10 bp deletion homo T insertion homo
2 10 bp deletion homo T insertion homo
3 10 bp deletion homo T insertion homo
4 10 bp deletion homo T insertion homo
5 10 bp deletion homo WT+T insertion
APP2-30-8-5 1 + mono-allelic or bi-allelic* T insertion homo 10 bp deletion+ T insertion WT
2 T insertion homo WT
3 10 bp deletion+ T insertion WT
4 T insertion homo WT
5 10 bp deletion+ T insertion WT
APP2-30-8-8 1 - mono-allelic or bi-allelic* T insertion homo T insertion homo WT
2 T insertion homo WT
3 T insertion homo WT
4 T insertion homo WT
5 T insertion homo WT
APP2-30-8-10 1 - mono-allelic or bi-allelic* T insertion homo T insertion homo WT+T insertion
2 10 bp deletion + T insertion WT+T insertion
3 10 bp deletion homo WT+T insertion
4 10 bp deletion + T insertion WT+T insertion
5 T insertion homo WT+T insertion
CRF4-14-2   + A insertion homo      
CRF4-14-2-5   - A insertion homo      
CRF4-14-2-6   - A insertion homo      
CRF4-14-4   + A insertion homo      
CRF4-14-4-2   - A insertion homo      
CRF4-22-2   + A insertion homo      
CRF4-25-1   + A insertion homo      

* indicates mutation patterns are not determined. AtAAP2 homologs were found on chromosomes 1, 2, 4 and 5, meanwhile AtCRF4 homolog exists only on chromosome 1. Mutation types without a specific location in this table mean they occurred at the cleavage site of each target region. The genotyping of AtAAP2 homologs chr.1, 2 and AtCRF4 homolog chr.1 was carried out for one individual plant. Regarding the AtAAP2 homologs on chr. 4 and 5, the genotyping was carried out for a maximum of five plants. All the lines in this list were shipped to CIAT, but the lines in grey color were removed from the experimental list due to their performances during the seed quarantine and multiplication.

Supplementary Table 2. Summary of the statistical analysis of the agronomic parameters in the field experiment. The parameters are identical to Table 3.  

Genotype Treatment FG EG 1000 GW PH SN PN DB PL
Nipponbare_WT 0% 12.12 ± 0.56   0.46 ± 0.09   25.20 ± 0.35   65.52 ± 1.36   22.24 ± 1.22   14.05 ± 1.21   11.65 ± 0.63   15.08 ± 0.37  
50% 17.02 ± 0.86   0.45 ± 0.06   26.19 ± 0.18   70.67 ± 0.86   16.81 ± 0.81   13.38 ± 0.64   13.79 ± 0.67   16.17 ± 0.31  
100% 29.73 ± 1.15   1.01 ± 0.07   25.73 ± 0.32   83.05 ± 1.34   30.76 ± 2.32   21.05 ± 0.83   24.11 ± 1.01   17.90 ± 0.78  
AAP2-25-1-4 0% 5.80 ± 0.67 3.04 ± 0.32 * 20.93 ± 0.21 65.33 ± 1.04   34.33 ± 2.38 * 29.43 ± 1.98 * 17.05 ± 0.60 * 13.64 ± 0.34
50% 8.99 ± 1.12 5.15 ± 0.81 * 21.54 ± 0.07 72.95 ± 1.86   37.86 ± 2.16 * 33.29 ± 2.07 * 22.52 ± 1.45 * 14.92 ± 0.35
100% 10.30 ± 1.14 6.08 ± 0.50 * 21.78 ± 0.17 76.52 ± 1.06 45.81 ± 3.11 * 45.86 ± 3.34 * 29.41 ± 1.66 * 16.29 ± 0.33
AAP2-30-8-1 0% 5.59 ± 0.50 4.38 ± 0.30 * 22.87 ± 0.13 67.14 ± 1.81   29.52 ± 3.31 * 34.95 ± 2.55 * 17.89 ± 0.98 * 13.51 ± 0.23
50% 8.15 ± 1.27 3.82 ± 0.43 * 23.22 ± 0.18 63.76 ± 0.63 37.71 ± 1.92 * 33.33 ± 2.44 * 20.83 ± 1.27 * 14.20 ± 0.31
100% 10.33 ± 1.16 6.07 ± 0.44 * 22.35 ± 0.01 72.52 ± 1.45 50.14 ± 2.05 * 49.81 ± 2.75 * 33.74 ± 1.48 * 14.99 ± 0.23
AAP2-30-8-4 0% 6.34 ± 0.38 3.03 ± 0.25 * 22.07 ± 0.39 61.86 ± 0.71   37.76 ± 2.19 * 31.14 ± 1.46 * 16.62 ± 0.72 * 13.46 ± 0.38
50% 7.51 ± 0.70 3.39 ± 0.23 * 22.01 ± 0.14 62.33 ± 0.83 36.57 ± 1.73 * 34.43 ± 1.72 * 19.88 ± 0.89 * 14.10 ± 0.23
100% 11.67 ± 0.95 5.22 ± 0.31 * 22.84 ± 0.06 71.76 ± 1.08 51.33 ± 3.00 * 40.38 ± 2.66 * 32.72 ± 2.00 * 14.82 ± 0.28
AAP2-30-8-10 0% 7.54 ± 0.35 3.08 ± 0.27 * 22.46 ± 0.29 62.00 ± 0.97   35.57 ± 1.93 * 26.86 ± 1.57 * 17.77 ± 1.15 * 12.50 ± 0.31
50% 8.79 ± 0.49 3.38 ± 0.33 * 22.87 ± 0.19 65.19 ± 1.64 33.19 ± 1.42 * 27.57 ± 1.58 * 17.94 ± 0.86   13.49 ± 0.24
100% 13.99 ± 1.25 4.63 ± 0.32 * 22.74 ± 0.21 80.67 ± 2.61   40.62 ± 3.98 * 39.29 ± 1.69 * 30.51 ± 1.57 * 15.57 ± 0.27
CRF4-14-2 0% 3.25 ± 0.87 4.95 ± 0.39 * 23.53 ± 0.30 63.14 ± 0.97   35.05 ± 2.40 * 36.91 ± 2.94 * 19.30 ± 1.03 * 12.93 ± 0.37
50% 3.10 ± 0.74 5.46 ± 0.38 * 22.69 ± 0.51 68.33 ± 1.00   32.57 ± 1.84 * 38.86 ± 2.51 * 22.36 ± 1.38 * 13.66 ± 0.30
100% 4.34 ± 1.04 8.59 ± 0.44 * 22.37 ± 1.06 74.52 ± 0.82 48.91 ± 1.86 * 51.86 ± 2.38 * 36.31 ± 1.55 * 14.37 ± 0.25
CRF4-22-2 0% 3.80 ± 0.59 5.08 ± 0.34 * 21.43 ± 0.31 60.76 ± 0.94 35.48 ± 2.36 * 35.95 ± 1.50 * 19.63 ± 1.63 * 12.97 ± 0.24
50% 4.21 ± 0.65 6.58 ± 0.47 * 22.20 ± 0.15 67.19 ± 0.91   38.33 ± 2.49 * 41.91 ± 2.75 * 24.13 ± 1.48 * 13.81 ± 0.23
100% 5.52 ± 1.16 8.10 ± 0.66 * 21.67 ± 0.19 75.24 ± 1.19 46.19 ± 2.17 * 52.38 ± 3.62 * 32.32 ± 1.75 * 15.18 ± 0.38
CRF4-25-1 0% 5.85 ± 0.63 3.71 ± 0.35 * 21.66 ± 0.40 66.52 ± 1.52   26.24 ± 1.83   25.71 ± 1.52 * 17.80 ± 1.15 * 13.86 ± 0.38
50% 4.90 ± 0.70 5.47 ± 0.33 * 21.57 ± 0.11 72.81 ± 1.16   30.14 ± 1.37 * 36.19 ± 1.73 * 22.30 ± 0.91 * 14.35 ± 0.24
100% 6.98 ± 1.01 8.55 ± 0.52 * 21.72 ± 0.17 78.48 ± 1.09 41.95 ± 2.83 * 46.05 ± 3.67 * 37.87 ± 1.79 * 16.10 ± 0.44
AAP2-25-1-3(2)-Pl-2 0% 5.48 ± 0.41 3.95 ± 0.45 * 21.55 ± 0.58 70.43 ± 0.93 * 26.48 ± 1.68   24.57 ± 1.36 * 17.54 ± 0.96 * 14.90 ± 0.35  
50% 6.60 ± 0.60 4.84 ± 0.36 * 21.74 ± 0.26 75.24 ± 1.07 * 29.48 ± 1.85 * 32.48 ± 1.72 * 23.47 ± 1.02 * 15.29 ± 0.22  
100% 9.46 ± 0.79   6.87 ± 0.36 * 21.08 ± 0.53 89.52 ± 2.08 * 30.48 ± 3.11   39.33 ± 2.38 * 39.23 ± 1.13 * 17.14 ± 0.43  
AAP2-30-8-1-Pl-1 0% 18.43 ± 1.69 * 1.02 ± 0.25   27.17 ± 1.12 * 79.29 ± 1.75 * 15.38 ± 2.16 10.95 ± 1.04   16.20 ± 1.04 * 16.31 ± 0.43  
50% 22.57 ± 1.94 * 1.08 ± 0.15   27.94 ± 0.16 * 85.91 ± 1.09 * 14.76 ± 1.04   12.43 ± 0.53   19.60 ± 0.97 * 16.93 ± 0.28  
100% 33.60 ± 2.97   1.48 ± 0.14   28.08 ± 0.96 * 92.05 ± 1.17 * 25.62 ± 2.51 17.33 ± 1.29   30.69 ± 1.90 * 17.70 ± 0.46  
AAP2-30-8-4-Pl-1 0% 15.87 ± 1.20   0.80 ± 0.13   26.94 ± 0.31 * 75.33 ± 1.11 * 17.95 ± 1.22   10.00 ± 0.33   15.88 ± 1.06 * 15.27 ± 0.37  
50% 19.79 ± 1.36   1.88 ± 0.27 * 27.56 ± 0.56   82.62 ± 1.08 * 17.14 ± 1.59   14.33 ± 1.04   21.23 ± 1.66 * 17.62 ± 0.47 *
100% 32.04 ± 2.21   2.15 ± 0.31   27.40 ± 0.44 * 87.86 ± 2.04 * 18.71 ± 0.98 17.62 ± 0.96   28.89 ± 1.80 * 18.53 ± 0.32  
CRF4-14-2-Pl-1 0% 16.31 ± 1.18   1.20 ± 0.16   27.31 ± 0.40 * 76.76 ± 1.44 * 15.24 ± 1.28 11.19 ± 0.91   17.38 ± 1.39 * 15.63 ± 0.36  
50% 16.07 ± 1.25   1.46 ± 0.20   26.80 ± 0.28   80.67 ± 1.58 * 14.48 ± 1.07   11.99 ± 0.93   18.05 ± 0.94   16.32 ± 0.46  
100% 33.43 ± 3.10   2.19 ± 0.29   28.22 ± 0.08 * 98.29 ± 2.19 * 16.05 ± 1.02 15.76 ± 0.96   31.57 ± 1.71 * 18.34 ± 0.30  
CRF4-22-2-Pl-1 0% 15.96 ± 1.30   0.91 ± 0.13   27.35 ± 0.66 * 79.95 ± 1.02 * 14.76 ± 1.53 10.24 ± 0.78   16.07 ± 1.05 * 16.59 ± 0.44 *
50% 23.60 ± 1.47 * 1.37 ± 0.26   26.56 ± 0.49   88.38 ± 1.68 * 12.86 ± 0.77   11.33 ± 0.51   20.12 ± 1.09 * 18.28 ± 0.51 *
100% 35.97 ± 2.36 * 1.84 ± 0.26   27.96 ± 0.08 * 88.71 ± 2.38 * 26.43 ± 2.63   19.19 ± 0.84   30.73 ± 1.91 * 18.69 ± 0.34  
CRF4-25-1-Pl-1 0% 17.97 ± 1.93 * 0.66 ± 0.11   26.60 ± 0.70 * 79.91 ± 1.82 * 11.91 ± 1.10 9.19 ± 0.67   12.87 ± 1.07   15.90 ± 0.42  
50% 23.56 ± 1.66 * 1.71 ± 0.55   25.36 ± 0.40   83.86 ± 1.14 * 12.86 ± 0.81   11.95 ± 0.64   20.43 ± 1.62 * 17.33 ± 0.40  
100% 35.53 ± 2.14 * 1.85 ± 0.25   25.56 ± 0.44   96.71 ± 0.87 * 18.62 ± 0.90 17.10 ± 0.88   27.31 ± 1.22   18.30 ± 0.52  
Genotype (G)   **       **       **       **       **       **       **       **      
N Level (N)   **       **       ns       **       **       **       **       **      
G x N   **       **       ns       **       **       **       **       ns      
CV %   44.09 %     45.96 %     3.09 %     8.46 %     32.48 %     31.51 %     26.32 %     10.90 %    
Mean   14.00 g     3.50 g     24.16 g     75.71 cm     28.91       27.09       22.99 g     15.55 cm    

Values are mean±SE from 21 plants. * significantly higher than WT (P<0.05), ** significantly higher than WT (P<0.01), ns=not significant (P>0.05).

Supplementary Figure 1. Interactions between the lines and N treatments in the field experiment. (a) dry biomass weight (DB), (b) stem number (SN), (c) panicle number (PN), and (d) filled grain weight (FG). 

Supplementary Figure 2. Interactions between genotypes and N levels on ANUE in the field experiment. 

Supplementary Table 3. NDVI values in the field experiment. 

Genotype Treatment 60 DAS 70 DAS 81 DAS 88 DAS
WT Nipponbare 0% 0.8440 ± 0.0064   0.7295 ± 0.0202   0.7160 ± 0.0060   0.6924 ± 0.0246  
50% 0.8435 ± 0.0022   0.7247 ± 0.0112   0.7375 ± 0.0091   0.7333 ± 0.0125  
100% 0.8949 ± 0.0051   0.7466 ± 0.0454   0.8082 ± 0.0101   0.8090 ± 0.0129  
AAP2-25-1-4 0% 0.8459 ± 0.0033 ns 0.7441 ± 0.0120 ns 0.7218 ± 0.0056 ns 0.7173 ± 0.0107 ns
50% 0.8470 ± 0.0065 ns 0.7274 ± 0.0485 ns 0.7566 ± 0.0078 ns 0.7767 ± 0.0114 ns
100% 0.8857 ± 0.0101 ns 0.7556 ± 0.0600 ns 0.8244 ± 0.0130 ns 0.8355 ± 0.0042 ns
AAP2-30-8-1 0% 0.8325 ± 0.0025 ns 0.7390 ± 0.0291 ns 0.7330 ± 0.0072 ns 0.7610 ± 0.0227 ns
50% 0.8427 ± 0.0038 ns 0.7427 ± 0.0087 ns 0.7399 ± 0.0080 ns 0.7570 ± 0.0136 ns
100% 0.8822 ± 0.0072 ns 0.7680 ± 0.0099 ns 0.8216 ± 0.0097 ns 0.8290 ± 0.0031 ns
AAP2-30-8-4 0% 0.8414 ± 0.0036 ns 0.7180 ± 0.0326 ns 0.7322 ± 0.0089 ns 0.7166 ± 0.0201 ns
50% 0.8397 ± 0.0014 ns 0.7217 ± 0.0160 ns 0.7477 ± 0.0039 ns 0.7478 ± 0.0043 ns
100% 0.8916 ± 0.0080 ns 0.7534 ± 0.0343 ns 0.8252 ± 0.0068 ns 0.8337 ± 0.0056 ns
AAP2-30-8-10 0% 0.8342 ± 0.0040 ns 0.7302 ± 0.0390 ns 0.7372 ± 0.0028 * 0.7781 ± 0.0250 *
50% 0.8414 ± 0.0024 ns 0.7092 ± 0.0118 ns 0.7552 ± 0.0031 ns 0.7555 ± 0.0048 ns
100% 0.8823 ± 0.0059 ns 0.7871 ± 0.0045 ns 0.8146 ± 0.0050 ns 0.8317 ± 0.0098 ns
CRF4-14-2 0% 0.8303 ± 0.0017 * 0.7263 ± 0.0223 ns 0.7351 ± 0.0081 * 0.7576 ± 0.0195 ns
50% 0.8385 ± 0.0016 ns 0.6943 ± 0.0093 ns 0.7522 ± 0.0081 ns 0.7685 ± 0.0133 ns
100% 0.8828 ± 0.0045 ns 0.7443 ± 0.0297 ns 0.8094 ± 0.0033 ns 0.8258 ± 0.0156 ns
CRF4-22-2 0% 0.8363 ± 0.0017 ns 0.7675 ± 0.0269 ns 0.7336 ± 0.0022 ns 0.7390 ± 0.0125 ns
50% 0.8380 ± 0.0054 ns 0.7190 ± 0.0213 ns 0.7561 ± 0.0067 ns 0.7773 ± 0.0110 ns
100% 0.8838 ± 0.0059 ns 0.7624 ± 0.0339 ns 0.8256 ± 0.0053 ns 0.8391 ± 0.0067 ns
CRF4-25-1 0% 0.8382 ± 0.0039 ns 0.7463 ± 0.0205 ns 0.7341 ± 0.0117 ns 0.7423 ± 0.0224 ns
50% 0.8421 ± 0.0023 ns 0.7319 ± 0.0149 ns 0.7621 ± 0.0046 ns 0.7884 ± 0.0091 *
100% 0.8935 ± 0.0064 ns 0.7706 ± 0.0351 ns 0.8409 ± 0.0052 * 0.8592 ± 0.0083 *
AAP2-25-1-3(2)-Pl-2 0% 0.8356 ± 0.0034 ns 0.7532 ± 0.0339 ns 0.7239 ± 0.0079 ns 0.7218 ± 0.0217 ns
50% 0.8492 ± 0.0023 ns 0.7216 ± 0.0452 ns 0.7511 ± 0.0053 ns 0.7694 ± 0.0096 ns
100% 0.9149 ± 0.0101 ns 0.7523 ± 0.0145 ns 0.8490 ± 0.0069 ** 0.8545 ± 0.0039 *
AAP2-30-8-1-Pl-1 0% 0.8438 ± 0.0020 ns 0.7342 ± 0.0360 ns 0.7428 ± 0.0033 ** 0.7611 ± 0.0107 ns
50% 0.8496 ± 0.0016 ns 0.7556 ± 0.0154 ns 0.7618 ± 0.0071 ns 0.7450 ± 0.0163 ns
100% 0.8963 ± 0.0072 ns 0.7274 ± 0.0325 ns 0.8311 ± 0.0072 ns 0.8166 ± 0.0054 ns
AAP2-30-8-4-Pl-1 0% 0.8430 ± 0.0069 ns 0.7511 ± 0.0245 ns 0.7380 ± 0.0052 * 0.7234 ± 0.0195 ns
50% 0.8484 ± 0.0041 ns 0.7363 ± 0.0045 ns 0.7558 ± 0.0014 ns 0.7422 ± 0.0046 ns
100% 0.8920 ± 0.0025 ns 0.7140 ± 0.0122 ns 0.8318 ± 0.0031 ns 0.8194 ± 0.0062 ns
CRF4-14-2-Pl-1 0% 0.8347 ± 0.0018 ns 0.7318 ± 0.0336 ns 0.7453 ± 0.0080 ** 0.7787 ± 0.0163 *
50% 0.8439 ± 0.0023 ns 0.7155 ± 0.0098 ns 0.7498 ± 0.0080 ns 0.7371 ± 0.0067 ns
100% 0.8842 ± 0.0079 ns 0.7537 ± 0.0167 ns 0.8303 ± 0.0077 ns 0.8205 ± 0.0100 ns
CRF4-22-2-Pl-1 0% 0.8397 ± 0.0011 ns 0.7287 ± 0.0309 ns 0.7270 ± 0.0027 ns 0.7448 ± 0.0191 ns
50% 0.8580 ± 0.0023 ns 0.7410 ± 0.0145 ns 0.7572 ± 0.0035 ns 0.7432 ± 0.0052 ns
100% 0.9003 ± 0.0101 ns 0.7528 ± 0.0468 ns 0.8314 ± 0.0161 ns 0.8248 ± 0.0202 ns
CRF4-25-1-Pl-1 0% 0.8347 ± 0.0042 ns 0.7239 ± 0.0257 ns 0.7372 ± 0.0028 * 0.7454 ± 0.0055 ns
50% 0.8529 ± 0.0056 ns 0.7221 ± 0.0353 ns 0.7550 ± 0.0102 ns 0.7539 ± 0.0167 ns
100% 0.8917 ± 0.0054 ns 0.7657 ± 0.0508 ns 0.8392 ± 0.0108 * 0.8442 ± 0.0096 ns

Values are mean±SE from 21 plants. * significantly higher than WT (P<0.05), ** significantly higher than WT (P<0.01), ns=not significant (P>0.05).

Supplementary Table 4. NDRE values in the field experiment. 

Genotype Treatment 60 DAS 70 DAS 81 DAS 88 DAS
WT Nipponbare 0% 0.3327 ± 0.0076   0.3210 ± 0.0208   0.1099 ± 0.0197   0.2031 ± 0.0147  
50% 0.3705 ± 0.0020   0.1802 ± 0.0935   0.1399 ± 0.0110   0.2253 ± 0.0108  
100% 0.4629 ± 0.0131   0.3128 ± 0.1148   0.2592 ± 0.0187   0.3292 ± 0.0145  
AAP2-25-1-4 0% 0.3195 ± 0.0059 ns 0.3068 ± 0.0309 ns 0.1176 ± 0.0149 ns 0.2284 ± 0.0081 ns
50% 0.3922 ± 0.0014 * 0.2313 ± 0.0617 ns 0.1485 ± 0.0119 ns 0.2587 ± 0.0086 ns
100% 0.4398 ± 0.0171 ns 0.3607 ± 0.0064 ns 0.2708 ± 0.0083 ns 0.3619 ± 0.0083 ns
AAP2-30-8-1 0% 0.3383 ± 0.0023 ns 0.2982 ± 0.0103 ns 0.1503 ± 0.0230 ns 0.2826 ± 0.0287 **
50% 0.3954 ± 0.0105 * 0.3163 ± 0.0094 ns 0.1680 ± 0.0022 ns 0.2780 ± 0.0025 **
100% 0.4695 ± 0.0090 ns 0.3773 ± 0.0295 ns 0.2945 ± 0.0075 ns 0.3781 ± 0.0032 ns
AAP2-30-8-4 0% 0.3393 ± 0.0063 ns 0.3217 ± 0.0311 ns 0.1408 ± 0.0199 ns 0.2588 ± 0.0192 *
50% 0.3929 ± 0.0067 * 0.3033 ± 0.0123 ns 0.1637 ± 0.0060 ns 0.2672 ± 0.0064 *
100% 0.4739 ± 0.0280 ns 0.3454 ± 0.1149 ns 0.3047 ± 0.0221 ns 0.3919 ± 0.0168 *
AAP2-30-8-10 0% 0.3294 ± 0.0049 ns 0.3394 ± 0.0793 ns 0.1513 ± 0.0114 ns 0.2731 ± 0.0116 **
50% 0.3853 ± 0.0009 ns 0.2181 ± 0.0700 ns 0.1626 ± 0.0066 ns 0.2528 ± 0.0074 ns
100% 0.4712 ± 0.0199 ns 0.3737 ± 0.0533 ns 0.3049 ± 0.0187 ns 0.3895 ± 0.0122 *
CRF4-14-2 0% 0.3241 ± 0.0054 ns 0.3216 ± 0.0482 ns 0.1481 ± 0.0176 ns 0.2687 ± 0.0117 **
50% 0.3828 ± 0.0053 ns 0.1916 ± 0.0307 ns 0.1710 ± 0.0098 ns 0.2818 ± 0.0157 **
100% 0.4406 ± 0.0034 ns 0.3938 ± 0.0343 ns 0.2745 ± 0.0099 ns 0.3775 ± 0.0134 ns
CRF4-22-2 0% 0.3311 ± 0.0057 ns 0.3658 ± 0.0612 ns 0.1522 ± 0.0131 ns 0.2687 ± 0.0128 **
50% 0.3801 ± 0.0047 ns 0.2960 ± 0.0122 ns 0.1606 ± 0.0059 ns 0.2721 ± 0.0065 **
100% 0.4585 ± 0.0105 ns 0.3584 ± 0.1355 ns 0.2930 ± 0.0055 ns 0.3851 ± 0.0023 *
CRF4-25-1 0% 0.3259 ± 0.0082 ns 0.2773 ± 0.0158 ns 0.1280 ± 0.0188 ns 0.2452 ± 0.0222 ns
50% 0.3771 ± 0.0039 ns 0.2579 ± 0.0321 ns 0.1505 ± 0.0072 ns 0.2735 ± 0.0038 **
100% 0.4790 ± 0.0108 ns 0.3922 ± 0.1071 ns 0.3137 ± 0.0177 ns 0.4058 ± 0.0145 **
AAP2-25-1-3(2)-Pl-2 0% 0.3215 ± 0.0092 ns 0.2742 ± 0.0355 ns 0.1139 ± 0.0153 ns 0.2343 ± 0.0231 ns
50% 0.3825 ± 0.0055 ns 0.2000 ± 0.0622 ns 0.1346 ± 0.0010 ns 0.2515 ± 0.0079 ns
100% 0.4897 ± 0.0131 ns 0.4243 ± 0.0224 ns 0.3094 ± 0.0016 ns 0.3909 ± 0.0046 *
AAP2-30-8-1-Pl-1 0% 0.3350 ± 0.0063 ns 0.3209 ± 0.0163 ns 0.1545 ± 0.0055 ns 0.2602 ± 0.0079 *
50% 0.3926 ± 0.0099 * 0.2748 ± 0.0203 ns 0.1761 ± 0.0119 * 0.2663 ± 0.0149 *
100% 0.4690 ± 0.0075 ns 0.3753 ± 0.0395 ns 0.2921 ± 0.0039 ns 0.3629 ± 0.0083 ns
AAP2-30-8-4-Pl-1 0% 0.3244 ± 0.0085 ns 0.2912 ± 0.0325 ns 0.1311 ± 0.0132 ns 0.2364 ± 0.0084 ns
50% 0.3887 ± 0.0061 ns 0.2407 ± 0.0335 ns 0.1591 ± 0.0042 ns 0.2522 ± 0.0046 ns
100% 0.4572 ± 0.0062 ns 0.2843 ± 0.1355 ns 0.2985 ± 0.0088 ns 0.3649 ± 0.0090 ns
CRF4-14-2-Pl-1 0% 0.3318 ± 0.0081 ns 0.3488 ± 0.0473 ns 0.1477 ± 0.0198 ns 0.2634 ± 0.0129 *
50% 0.3797 ± 0.0061 ns 0.2804 ± 0.0226 ns 0.1660 ± 0.0074 ns 0.2483 ± 0.0069 ns
100% 0.4653 ± 0.0257 ns 0.3671 ± 0.1355 ns 0.3299 ± 0.0246 * 0.4013 ± 0.0188 **
CRF4-22-2-Pl-1 0% 0.3150 ± 0.0088 ns 0.3055 ± 0.0253 ns 0.1249 ± 0.0092 ns 0.2399 ± 0.0025 ns
50% 0.3931 ± 0.0041 * 0.3156 ± 0.0150 ns 0.1644 ± 0.0058 ns 0.2639 ± 0.0038 *
100% 0.4726 ± 0.0114 ns 0.3928 ± 0.0082 ns 0.3018 ± 0.0221 ns 0.3757 ± 0.0244 ns
CRF4-25-1-Pl-1 0% 0.3203 ± 0.0049 ns 0.3414 ± 0.0458 ns 0.1399 ± 0.0141 ns 0.2405 ± 0.0083 ns
50% 0.3821 ± 0.0046 ns 0.2165 ± 0.0953 ns 0.1553 ± 0.0151 ns 0.2540 ± 0.0119 ns
100% 0.4754 ± 0.0157 ns 0.2949 ± 0.1874 ns 0.3236 ± 0.0193 * 0.4013 ± 0.0132 **

Values are mean±SE from 21 plants. * significantly higher than WT (P<0.05), ** significantly higher than WT (P<0.01), ns=not significant (P>0.05).

Supplementary Figure 3. Interactions between genotypes and N applications in (a) NDVI and (b) NDRE in the field experiment. 

Received: June 21, 2023; Revised: September 18, 2023; Accepted: October 06, 2023

4 Corresponding author: kwakatabi@unal.edu.co, kentaro.wakatabi@gmail.com

Conflict of interests: The manuscript was written and reviewed with the participation of the authors, who declare that there exists no conflict of interest that puts at risk the validity of the presented results.

Creative Commons License This is an open-access article distributed under the terms of the Creative Commons Attribution License