


 Inglés (pdf)
 Articulo en XML
 Referencias del artículo
 Enviar articulo por email
 Citado por SciELO
  Citado por Google
  Similares en
SciELO
Similares en
SciELO  Similares en Google
 Permalink
1. Introduction
During the period from 2000 to 2019, floods affected 41% of the total population world, causing 104,614 deaths [1]. While floods inflict more damage in urban areas, numerical models for flood routing in riverine and coastal regions are more prevalent. Simulations in detection of flooding in urban areas are less common due to the more complex numerical approach associated with streamflow mechanisms. However, monitoring flood-prone areas can help decision makers to implement an appropriate public policy solution for water management. Thus, prioritizing historical analysis of flood events is essential for future flood management planning [2]. One of the main cities with the highest exposure to flooding in Peru is Iquitos, located in the Loreto Region. The region encompasses 7 of the 8 total provinces with a very high flood occurrence rate, affecting tens of thousands of households [3]. In 2016, the Peruvian government executed a project aimed at relocating Belen residents to a small settlement outside Iquitos. This initiative aimed to protect the integrity and well-being of residents who were frequently exposed to ongoing flooding events in the region [4].
In recent times, space-sensors have furnished Earth's surface images for numerous applications, including flood extent mapping. Initial approaches primarily involved optical sensors that utilized visible spectral bands; however, visibility is often compromised during extreme weather conditions. Active sensors, such as Synthetic Aperture Radar (SAR), operating in the microwave spectral range, particularly the C-band, are valuable due to their radiance energy remains unaffected by cloud cover or heavy rain. The use of SAR images for flood mapping is particularly effective in detecting standing water and has gained traction since the deployment of the Sentinel-1 mission. The Sentinel-1 mission is the first project of the Copernicus program satellite constellation, conducted by the European Space Agency (ESA) [5].
Each pixel in the SAR image represents the energy that was reflected back (backscatter) to the satellite, and its magnitude signifies the intensity of the reflected echo. The backscatter characteristics are influenced by radar parameters (wavelength, polarization and incidence angle) and dielectric properties of the ground objects [6]. In order to extract images, certain parameters must be considered, including polarization, wavelength, spatial, spatial and temporal resolutions, as well as, refinement and filtering techniques. Building upon this backscatter information, methods for flood delineation using SAR images encompass histogram threshold, RGB composition, change detection method, classification techniques and data fusion using SAR and optical images [6].
Google Earth Engine (GEE) is a cloud-based platform designed for geospatial data visualization, offering a repository of regularly updated archived Earth observation images. Furthermore, GEE has integrated the dataset from the Sentinel-1 mission, featuring images ranging from 2014 to the present day. This mission employs a dual-polarization C-band Synthetic Aperture Radar (SAR) instrument operating at 5.405 GHz. The scenes within this collection have undergone processing steps including thermal noise removal, radiometric calibration, and terrain correction, utilizing elevation digital models through the Sentinel-1 Toolbox [7]. Each scene is available in three resolutions (10, 25, or 40 meters), and to access them, a JavaScript Code Editor was employed for downloading purposes.
GEE has demonstrated its utility in generating flood patterns in the Mekong Delta in Asia, where SAR images exhibited consistency with observed data [8]. Additionally, the platform facilitated the mapping of near real-time flood inundation across 13 districts in India during 2019. This analysis was conducted by utilizing distinct polarized backscatter values from Sentinel-1 images within GEE [9]. Conversely, images extracted from GEE has been used to validate a numerical simulation HECRAS model to extreme river event in Tunisia and in Greece [10,11]. In the context of Peru, satellite images from various sources, including PeruSat (Peruvian Satellite), were examined to showcase their efficacy in delineating the extent of flooding in the Northern region during the 2017 El Niño phenomenon [12].
This work aims to visualize the extent of the flooded area over Iquitos city through an occurrence map, while also identifying the impact on infrastructure. The images were acquired using Sentinel-1 SAR data extracted from the GEE platform, following the recommendations of the United Nations' UN-SPIDER initiative (https://t.ly/0FdC) [13]. Certain parameters of the processing specific to the study area were adjusted, and subsequently, all raw images extracted in binary format were processed within QGIS.
Study area
A rectangular region covering an area of 13972.2 hectares has been defined as the data collection area for extracting images from GEE, as depicted in Fig. 1. Within that area, the urban zone with is delineated, housing a total population of 384550 habitants [14]. Iquitos serves as the capital city of the Loreto Region in the northeastern part of Peru. Geographically isolated, the access of the region is primarily limited to air and river travel. Its primary economic drivers include small-scales commercial enterprises, extractive industries, and agricultural.
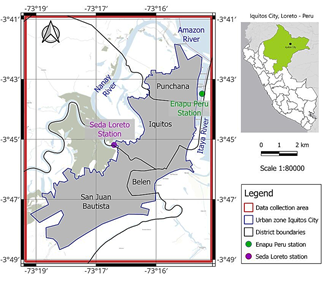
The city of Iquitos is divided into four urban sectors: Punchana (582.5 ha), Iquitos (1109.06 ha), San Juan Bautista (1715.0 ha) and Belen (347.2 ha). Situated within the Amazon basin, the city is surrounded on three sides by the Itaya, Nanay and Amazon rivers covered by dense tropical vegetation.
The geographic nature of the study area is characterized by a natural cyclical flooding process. In recent years, extreme flood events have had a detrimental impact on the population, as observed in 2012 and 2015. These floods are particularly prevalent during the wet months spanning from November to April. They can be triggered by rising water levels in the rivers or surface runoff resulting from heavy local rainfall.
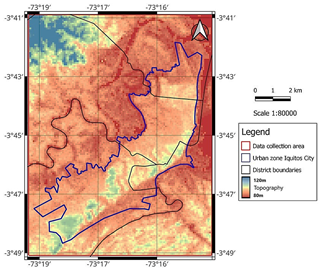
The topography of the study area exhibits variations ranging from 80 to 100 meters, as depicted in Fig. 2. The southeastern and northern portions of the urban area display lower ground elevations, approximately around 85 meters, in proximity to the riverine regions. Notably, this is particularly evident in the neighborhoods of Belen and Punchana. Conversely, the central part of the city features a higher topography, exceeding 95 meters. This topographical insight is significance in understanding the flow of surface runoff, and it also contributes to the refinement process of the flood extent image.
3. Available data set
The main dataset was acquired from the Google Earth Engine Catalog. Images from various dates within the period from 2015 to 2021 were extracted in TIFF format with a spatial resolution of 10 meters. The specific images extracted were dependent on the chosen polarization within the Catalog. The chosen dataset collection within GEE was the Sentinel-1 SAR GRD provided by Sentinel-1 mission. This dataset utilizes a dual-polarization C-band Synthetic Aperture Radar (SAR). As outlined in this platform, the images were previously processed using the Sentinel-1 Toolbox to produce calibrated, ortho-corrected product.
Conversely, the daily observed water levels were collected from Servicio Nacional de Meteorologia e Hidrologia del Peru (SENAMHI) and Sistema Nacional de Informacion de Recursos Hídricos (SNIRH) for the period from 2018 to 2021. Data was collected from the Seda Loreto and Enapu Peru stations, situated along the Nanay and Itaya Rivers, respectively. The Enapu Peru station possesses a high alert level indicating the occurrence of a large-scale hydrological event at 117 meters. The highest record water level at this station was 118.97 meters in April, 2012 which led to the inundation of both rural and urban areas of Iquitos.
Images from JRC Global Surface Water Layer v1.4 were required to identify permanent water bodies using GEE catalog. Administrative buildings and transportation infrastructure boundaries were obtained from Sistema de Información para la gestión del Riesgo de Desastres (SIGRID) (https://sigrid.cenepred.gob.pe). Additionally, a digital elevation model (DME) from Hydrosheds dataset was extracted from GEE at a resolution of 3 arc-second.
4. Methodology
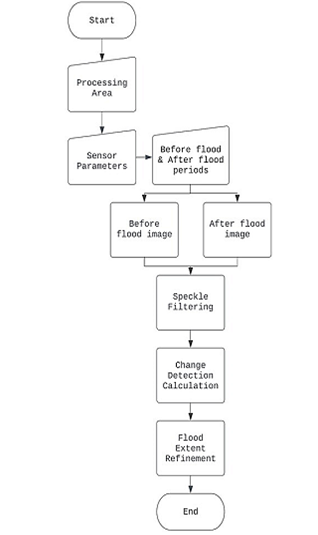
The scheme adopted to extract images of flood extent using GEE involves the JavaScript programming language directly implemented on the GEE interface. Here, the code was developed based on the recommendations of United Nations (more details, the reader could to enter the following link: https://goo.by/v0Q3O). The method used to flood mapping is change detection approach and its procedure consisted on the following steps:
Step 1: A rectangle polygon was created to defined the processing extent, which corresponds to the study area.
Step 2: Select the sensor parameters, such as polarization channel and pass direction. Four polarization channels are available for selection; for the study area, VV images were chosen. The pass direction parameter for the images was set to ASCENDIG, which corresponds to a coverage frequency of 12 days, aligning with the geographical context of Peru.
Step 3: Two time periods were required to extract images: one image before the flood, and another image after the flood. Subsequently, two images in TIFF format were obtained and processed independently in the following steps.
Step 4: To mitigate the granular characteristics and enhance image interpretation, a speckle filtering process was applied using a morphological mean filter. A kernel in the form of a circular mask, with a radius specified in meters, was employed for this filtering process. A smoothing radius of 50 meters was chosen as the value for the filter.
Step 5: Calculate the change detection using a threshold value. High values (bright pixels) indicate significant change, while low values (dark pixels) suggest minor change. The predetermined threshold is applied, assigning a value of 1 to all pixels greater than this threshold and 0 to all pixels below it. This process generates a binary image that illustrates the extent of the flood. In this case, a threshold value of 1.40 was utilized. This value was determined through a trial-and-error method based on a map of flooding in Iquitos, as extracted from the following source (https://shorturl.at/ehRT9).
Step 6: Refine the flood extent image. Up until this point, all images have been classified as either flooded or non-flooded. Two types of refinements were applied to the flood extent. The first one masks out all areas covered by permanent water, such as rivers that are present for more than 10 months per year. The second refinement involves removing areas with a slope of over 5% from the digital elevation model.
The aforementioned steps are explained in the flowchart presented in Figure 3. Flood extents were obtained for hydrological each year, beginning in November of the previous year and concluding in April of the current year. The two before-flood dates were defined as October 1st and October 31st, while the after-flood dates were defined as April 1st and April 30th. The flood extent area for each year is calculated by summing all the pixels and converting the flood extent to hectares.
After executing the script on the GEE platform, a number of images available between the specified, before and after, flood periods were noted in the console bar. Subsequently, these available images were downloaded individually, following the methodology outlined in the aforementioned steps. This final procedure facilitated the download of 112 images covering the period from 2015 to 2022, which was carried out to construct the probability map of occurrences. Subsequent to this, all images were exported to the QGIS environment to generate the conclusive map presented within this study. Specifically, a map was created to identify urban sectors affected by flooding, including administrative buildings and transportation infrastructure boundaries.
The validation process becomes challenging due to the absence or unavailability of in-situ observations images. Technical reports of disasters from Peruvian public institutions contain informative notes, but lack comprehensive explanations regarding the extent of the flooding areas. As a result, this study employs the coefficient of determination (R2) to examine the correlation between the flooding area and the river level measurements from monitoring stations. The coefficient of determination equation is calculated as showed in eq. (1), its ranges from 0.0 to 1.0 with values above 0.70 indicating a strong correlation between the two variables [15].
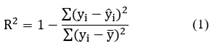
Where
 denotes the predicted value of y and as usual
  is the mean of y's values and both summations are over i=1,2,…n.
The probability map of occurrences is computed within the QGIS environment using the Field Calculator command applied to the 112 binary images downloaded from GEE. The probability equation is calculated for each pixel within the defined rectangular region.
where i is pixel, ni is a number of times with flooding pixel with value 1, N is a total number of times, in this case, N = 112.
5. Results
The Table 1 shows the extent of flooding area expressed in hectares for the four sectors of the city of Iquitos and the rural zone during the period from 2015 to 2021. Additionally, the value in parentheses shows the percentage of the flooded area in relation to the total area of each urban sector. The Table shows that rural zone has a larger flooding area compared to the urban area. Also, the largest flood areas were 1714.74 hectares and 1755.9 hectares for the years 2019 and 2020, respectively.
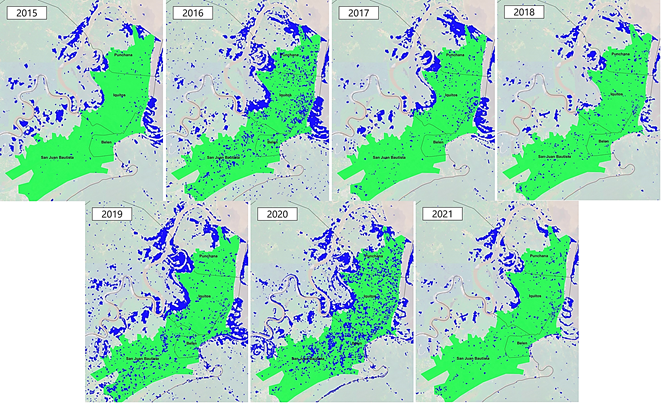
The smallest flooding areas were 818.87 and 671.31 hectares for the years 2015 and 2018, respectively. Considering the San Juan Bautista sector has the largest urban area, its flooding area extent shows lower percentages compared to the others. Conversely, the Belen sector, with the lowest urban area, it has the highest percentage of its territory flooded, reaching 10.1 % and 14.2% for the years 2019 and 2020, respectively. The Fig. 4 shows the flooding extent for each year from 2015 to 2021 over the study area. It is observed that floodplain are present in regions surrounding the meandering geomorphology of the rivers. Some regions are remarkable as the side western of the Iquitos sector and the side east of Belen sector, both with lower elevation. Additionally, floodplain are notable in the northern side of the Punchana sector.
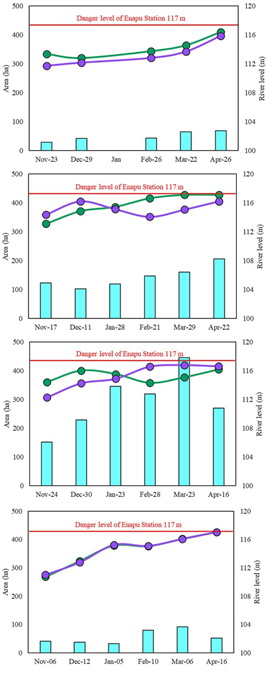
A preliminary validation between the floodplain area and river levels at the two stations was conducted for each year within the period from 2018 to 2021, as depicted in Fig. 5. The horizontal X-axis corresponding observed flooding area from GEE as to the most extensive of the month. The vertical Y-axis corresponding the river level at the two stations observed in that date.
Table 1 Flooding extent in hectares and percentage of flooding extent for urban zone and rural for each year over the period from 2015 to 2021.
| Description | 2015 | 2016 | 2017 | 2018 | 2019 | 2020 | 2021 |
|---|---|---|---|---|---|---|---|
| Urbana Area | |||||||
| Punchana | 21.56 (3.7) | 88.58 (15.2) | 46.34 (8.0) | 31.54 (5.4) | 40.46 (6.9) | 117.43 (20.2) | 35.23 (6.0) |
| Iquitos | 24.31 (2.2) | 154.01 (13.9) | 76.70 (6.9) | 46.55 (4.2) | 83.00 (7.5) | 235.45 (21.2) | 56.34 (5.1) |
| Belén | 5.32 (1.5) | 38.00 (10.9) | 11.62 (3.3) | 12.87 (3.7) | 37.78 (10.9) | 91.24 (26.3) | 14.43 (4.2) |
| San Juan Bautista | 8.87 (0.5) | 114.10 (6.7) | 27.64 (1.6) | 47.89 (2.8) | 173.42 (10.1) | 243.40 (14.2) | 36.46 (2.1) |
| Sub-total (ha) | 60.06 | 394.69 | 162.30 | 138.85 | 334.67 | 687.52 | 142.47 |
| Rural Area | |||||||
| Sub-total (ha) | 758.81 | 995.09 | 802.94 | 478.46 | 1380.07 | 1068.44 | 564.43 |
| Total | 818.87 | 1389.78 | 965.25 | 617.31 | 1714.74 | 1755.97 | 706.89 |
Source: Own elaboration.
For reference, the flood hazard level for the Enapu Peru station, which is marked at 117 meters (there is no reference for the Seda Loreto station), has been included. In the month of January, no images were available from the GEE platform; hence, it appears as missing data
The flooding areas for the years 2018 and 2021 were less than 100 hectares. However, in the year 2020, larger areas were observed, exceeding 400 hectares, and the river level approached the danger level. The highest river levels in the Nanay and Itaya rivers reached the hazard level, especially in the years 2019, 2020, and 2021. There is no observable relationship between an increase in floodable area and higher river levels at both stations. For example, on April 16, 2021, when it reached the 117-meter mark because a small floodable area was observed.
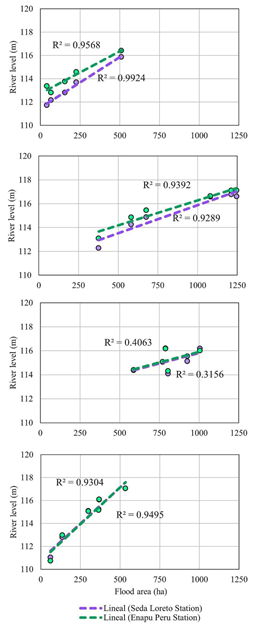
Fig. 6 shows the correlation that exists between the flooding area and the observed river level at the control stations for the period from 2018 to 2021. A coefficient of determination was calculated and they are close to the value 1, indicating a very strong correlation between both variables. The coefficient is greater than 0.90 in all cases, except for the year 2020. The low coefficient in that year may suggest that other factors, such as local rainfall patterns, may be influencing flood behavior.
Source: Own elaboration.
Figure 5 Flooding extent area and level river from Enapu Peru station and Seda Loreto for the period from 2018 to 2021.
A probability map of occurrences (Fig. 7) was constructed with the flood extent images downloaded from the GEE platform and exported to QGIS in raster format. Probability at 100% was observed in various rural areas, especially in the floodplains. The western side of the Iquitos sector, the eastern side of the Belén sector, and the northern area near the confluence of the Nanay River with the Amazon River. Probabilities lower than 40% were observed in the urban area, particularly in the historic center and the northern region of the San Juan Bautista.
Source: Own elaboration.
Figure 6 Coefficient of determination calculated between flooding extent area and level river from Enapu Peru and Seda Loreto stations for the period from 2018 to 2021.
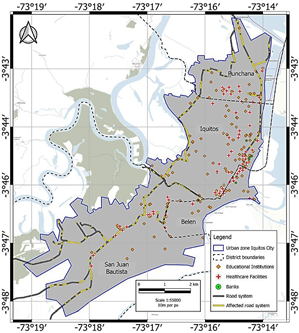
A map of affected infrastructure (Fig. 8) was overlaid onto the probability map of occurrences for purpose of identifying health centers, educational institutions, banks, and the road network. Table 2 presents a quantitative analysis of these infrastructure in detailed by sector of the Iquitos city. From the results, it is observed that the buildings located in the Iquitos sector are the most affected. This quantity is highly significant as the historic center of the city because it is where social, tourist, and cultural activities in the region take place. On the other hand, the San Juan Bautista sector has a higher percentage of affected roads with 5.75 km, representing 5.8% of the total.
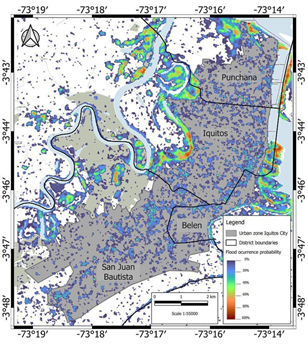
Table 2 Quantification and percentage within the parentheses of urban infrastructure affected for flooding into Iquitos city.
| Sector | Education Building (Und) | Hospitals (Und) | Banks (Und) | Road (km) |
|---|---|---|---|---|
| Punchana | 15 (4.8) | 13 (7.3) | 0 | 3.3 (3.3) |
| Iquitos | 65 (21) | 28 (15.8) | 9 (47.4) | 3.1 (3.1) |
| Belén | 19 (6.1) | 18 (10.1) | 3 (15.8) | 0.12 (0.1) |
| San Juan Bautista | 20 (6.5) | 12 (6.8) | 1 (5.3) | 5.75 (5.8) |
Source: Own elaboration
6. Conclusions
This study analyzed flood events detected by the GEE platform between 2015 to 2021. The findings enhance our comprehension of the spatial patterns of flooding in both rural and urban areas of Iquitos, and how the phenomenon affects public and private buildings, as well as urban road networks.
The validation process, involving the comparison of flood extents based on river level from hydrometeorological stations has allowed us to conclude satisfactorily that there is a direct relationship in most of the analyzed maximum flood events. Additionally, the probability of occurrence map highlights varying flood incidences, with particular focus on the floodplains in the Belén and Iquitos sectors.
Polarization combinations offer enhanced accuracy in flood mapping, particularly in urban areas. However, for the Iquitos region, only VV polarizations were available. A preliminary download of images from the GEE platform for the Northern region of Peru confirmed the availability of cross-polarizations VH and HV, making it interesting to replicate this methodology in that region.
Source: Own elaboration.
Figure 8 Map of affected infrastructure over urban area of the Iquitos city.
The absence of in-situ flood information leads us to indirect validation approach. In some studies, extracted inundation boundaries from GEE are considered as truth data for comparison with hydrodynamic models. Compared to flood monitoring using discrete hydrological data, the use of Sentinel-1 provides spatial and temporal continuity in the analysis.
This study demonstrated that the GEE platform offers advantages such as rapidly obtaining high-resolution images using an intuitive and non-complex programming language. This approach is justified by the available of these images for free download, enabling easy manipulation in programs like QGIS to provide enhanced support and resolution for addressing practical problems.
The methodology can be easily adapted for other regions likely to the city of Iquitos. The results presented here can be useful not only for scientists but also for local governments, decision-makers, or the general public. Furthermore, the methodology applied here can be incorporated into flooding management, planning, and disaster prevention projects.

