


 Inglés (pdf)
 Articulo en XML
 Referencias del artículo
 Enviar articulo por email
 Citado por SciELO
  Citado por Google
  Similares en
SciELO
Similares en
SciELO  Similares en Google
 Permalink
INTRODUCTION
Parabens, esters of para-hydroxybenzoic acid, have an alkyl group like methyl, ethyl, propyl, butyl, heptyl or benzoyl and are been utilized as preservatives in cosmetics, pharmaceutical products, food items for as they possess anti-microbial and anti-fungal properties [1]. Nowadays, parabens are considered dangerous, by its endocrine disruption potential, which includes modification of hormone synthesis and their metabolism [2]. Studies have shown that parabens have estrogen agonist action and they can also cause male infertility [3].
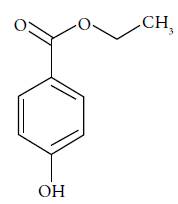
Ethylparaben (EtP, see figure 1, ethyl 4-hydroxybenzoate, C9H10O3) is used in soap and detergents, eyeliner, perfumes, shampoos, tint, foundations, deodorants, pre-shaving lotions, moisturizers [4]. Parabens found in aqueous sources are mainly due to the discharges from wastewater treatment plants [2].
In this context, solubility studies have become an important tool for the development of decontamination strategies. In addition, they also allow the development of more precise mathematical models, which lead to predict solubility and reduce the number of experimental tests, that entails reducing the environmental impact, due to a decrease in the volume of pollutant discharges to bodies of water [5, 6].
The other hands, the mathematical models are the easy and fast ways to estimate drugs solubility, and therefore, they also offer an important alternative in the pharmaceutical industry. Nevertheless, these models are optimized through the generation of experimental data, which allow for rational modifications [7-9].
The main goal of this paper is to evaluate the solution thermodynamic of EtP in {1-propanol + methanol} cosolvent mixtures, based on thermodynamic deinitions. Thus, this work is similar to the ones presented previously in the literature for some drugs in cosolvent mixtures [10-14].
EXPERIMENTAL
Reagents
In this research, EtP (Sigma-Aldrich, USA; compound 3, purity at least 0.990 in mass fraction), MeOH (Merck A.R., Germany); the solvent component 2, purity at least 0.998 in mass fraction) n-PrOH (Merck A.R., Germany; the solvent component 1, purity at least 0.998 in mass fraction); EtOH (Merck A.R., Germany; solvent used for dilutions).
Preparation of solvent mixtures
All (n-PrOH (1) + MeOH (2)} solvent mixtures were prepared by mass in quantities of 40.00 g, using an analytical balance with sensitivity ± 0.1 mg (RADWAG AS 220. R2, Poland). The mass fractions of n-PrOH (1), w 1 , of the nine mixtures prepared varied by 0.10 from 0.10 to 0.90.
Solubility determinations
An excess amount of EtP was added to approximately 40.00 g of each binary (n-PrOH (1) + MeOH (2)} solvent mixture or neat EtP, in stoppered dark glass flasks. The flasks were transferred to cooling thermostats (cryostats) (Medingen K-22/T100, Germany) maintained at 313.15 (±0.05) K for at three days to reach the saturation equilibrium. After this time, the supernatant solutions were filtered at isothermal conditions (Millipore Corp. Swinnex®-13, USA) to ensure that they were free of particulate matter before sampling for analysis. Drug concentrations were determined after appropriate gravimetric dilution with ethanol by measuring the UV light absorbance at the wavelength of maximum absorbance, 268 nm (UV/VIS EMC-11-UV spectrophotometer, Germany), and interpolation from a previously constructed UV spectrophotometric gravimetric calibration curve following a validated method. All the solubility experiments were performed at least three times. Later, the thermostats temperature was adjusted at 308.15 K during two days allowing the respective EtP precipitation, finally the temperature led to 283.15 K.
RESULTS AND DISCUSSION
Equilibrium solubility of EtP in aqueous-cosolvent mixtures
The experiment results in n-PrOH, MeOH and the mixtures of n-PrOH and MeOH are presented in table 1 and plotted in figure 2. The solubility value in pure solvents and the mixtures with a ixed composition increased with the rise of temperature. Moreover, in the two studied pure solvents, the solubility largest one was found in n-PrOH and lowest in MeOH at the determined temperature. As can be seen, the solubility of EtP in the mixtures of (n-PrOH (1) + MeOH (2)} increases to a maximum with the increasing the composition of cosolvent n-PrOH up to pure n-PrOH. The results show that the solubility of EtP can be improved by cosolvents. Table 1 via footnotes c and d shows that our parabens solubility values in neat solvents are in good agreement with those reported in the literature. The different reported solubility values for parabens vary in some extent. This could be due to differences in analyzed polymorphic crystals, equilibration times, or the analytical techniques employed [15].
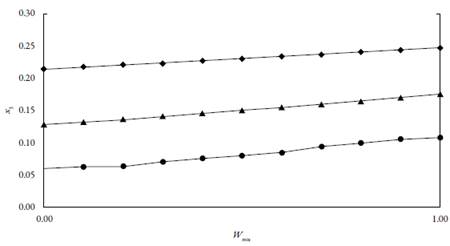
Figure 2 Experimental mole fraction solubility of EtP in (n-PrOH (1) + MeOH (2)} mixtures at different temperatures; (•=283.15 K; ▲=298.15 K; ♦=313.15).
Table 1 Experimental mole fraction solubility of EtP in (n-PrOH (1) + MeOH (2)} mixtures at different temperatures.
| 283.15 K | 298.15 K | 313.15 K | |
|---|---|---|---|
| 0.00 | 0.0597±0.0012 | 0.1283±0.0019b | 0.2142±0.0021b |
| 0.10 | 0.0623±0.0016 | 0.132±0.004 | 0.2173±0.0012 |
| 0.20 | 0.06307±0.00016 | 0.1364±0.0018 | 0.22048±0.00033 |
| 0.30 | 0.0701±0.0011 | 0.1407±0.0032 | 0.2237±0.006 |
| 0.40 | 0.0754±0.0011 | 0.1452±0.0016 | 0.22690±0.00028 |
| 0.50 | 0.0800±0.0010 | 0.150±0.003 | 0.23018±0.00026 |
| 0.60 | 0.0849±0.0019 | 0.1544±0.0019 | 0.2335±0.007 |
| 0.70 | 0.0940±0.0009 | 0.1593±0.0021 | 0.237±0.004 |
| 0.80 | 0.0996±0.0012 | 0.164±0.004 | 0.240±0.005 |
| 0.90 | 0.1054±0.0023 | 0.1695±0.0021 | 0.244±0.006 |
| 1.00 | 0.1077±0.0013 | 0.1748±0.0021c | 0.247±0.006c |
a w1 is the mass fraction of n-PrOH in the cosolvent mixture free of solute.
b Reported mole fraction solubility values in neat MeOH (2) at 298.15 K: x3=0.135 [16]; x3=0.136 [4] and 313.15 K: x3=0.208 [16].
c Reported mole fraction solubility values in neat n-PrOH (1) at a 298.15 K: x3=0.176 and 313.15 K: x3=0.229 [16].
Activity coefficients
Table 2 shows the EtP (3) activity coefficients y3, calculated as the quotient x3-id/x3 from the respective solubility values presented in table 1 in all cases these values are quite approximate than 1 particularly in methanol-rich mixtures and low temperatures. From y3 values a rough estimate of solute-solvent intermolecular interactions can be made by considering the following expression [17]:

Table 2 EtP (3) activity coefficients (y3) in (n-PrOH (1) + MeOH (2)} cosolvent mixtures at several temperatures.
| w1 a | 283.15 K | 298.15 K | 313.15 K |
|---|---|---|---|
| 0.00 | 0.869 | 1.207 | 1.332 |
| 0.10 | 0.906 | 1.245 | 1.351 |
| 0.20 | 0.918 | 1.284 | 1.371 |
| 0.30 | 1.020 | 1.325 | 1.391 |
| 0.40 | 1.098 | 1.366 | 1.411 |
| 0.50 | 1.164 | 1.409 | 1.431 |
| 0.60 | 1.235 | 1.453 | 1.452 |
| 0.70 | 1.369 | 1.499 | 1.473 |
| 0.80 | 1.449 | 1.546 | 1.494 |
| 0.90 | 1.535 | 1.595 | 1.516 |
| 1.00 | 1.567 | 1.645 | 1.538 |
a w 1 is the mass fraction of n-PrOH in the cosolvent mixture free of solute.
Where subscript 1 stands for the solvent mixture: (n-PrOH (1) + MeOH (2)}, e 11 , e33 and e13 represent the solvent-solvent, solute-solute and solvent-solute interaction energies, respectively; V 3 is the molar volume of the super-cooled liquid solute, whereas, Φ 1 is the volume fraction of the solvent. As commonly used, for relatively low x3 values, V 3 Φ 1 2 /RT may be considered as constant. Thus, y3 depends mainly on e 11 , e 33 and e13 [17]. The e11 and e13 terms are unfavorable for solubility and dissolution, whereas the e13 term favors the dissolution process. The contribution of the e33 term could be considered as constant in all the mixtures.
This is a particularly interesting case, the values of y3, are very approximate to the unit. Therefore, solute-solvent interactions favor the process of solubility in all cases. In general, the activity coefficients diminish as the temperature rises, and therefore, the solution processes become "more ideal".
Apparent thermodynamic quantities of dissolution
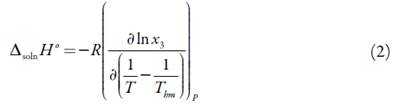
From solubility data, the thermodynamic functions are calculated solution. So, the standard molar enthalpy changes of solution, ∆solnH° is obtained from the slope of a lnx3 vs. 1/T-1/ Thm plot. Over the limited temperature interval (283.15 to 313.15 K) the heat capacity change of solution may be assumed to be constant, hence ∆solnH should be valid for the mean harmonic temperature, Thm = 297.6 K [17-19]:
The apparent standard Gibbs energy change for the solution process (∆solnG°) considering the approach proposed by Krug et al., is calculated at 297.6 K by means of[17, 18]:

The standard molar entropy changes for the solution process, ∆solnS°, at the mean harmonic temperature, Thm = 297.6 K is then
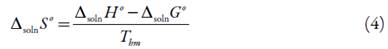
Table 3 presents the standard molar thermodynamic functions for dissolution of EtP (3) in all the {n-PrOH (1) + MeOH (2)} solvent mixtures.
Table 3 Apparent thermodynamic functions relative to solution process of EtP in {n-PrOH (1) + MeOH (2)} cosolvent mixtures at 297.15 K.
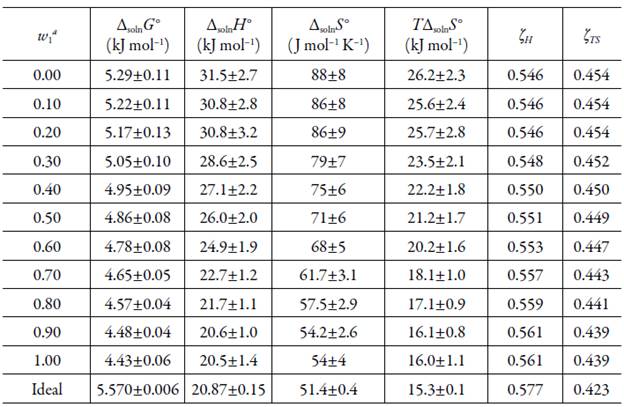
aw1 is the mass fraction of n-PrOH in the cosolvent mixture free of solute.
The standard Gibbs free energy of solution is positive in all cases as is the enthalpy of solution; therefore the process is always endothermic [20]. In figure 3 show change of enthalpy versus the mole fraction of n-PrOH. In this case, it is not observed, the typical behavior of aqueous mixtures, where the enthalpy, initially increases, and then decreases [21, 22]. So, from the pure MeOH up to the pure n-PrOH the enthalpy of solution tends to decrease that is responsible for increasing the solubility.
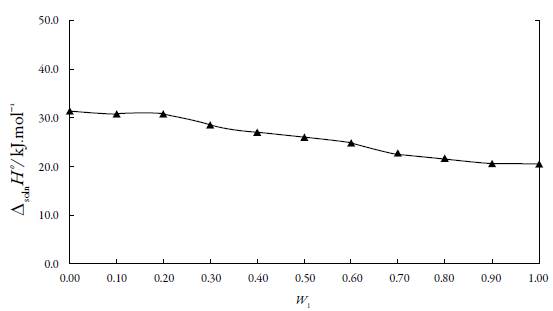
Figure 3 Enthalpy of solution of naproxen in of EtP in {n-PrOH (1) + MeOH (2)} cosolvent mixtures at 297.15 K.
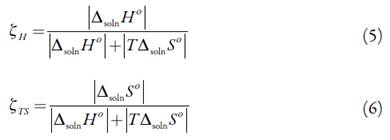
The entropy of solution is positive in all solvent mixtures and neat solvent, indicating the entropy as driving the solution process. The ∆solnS° values decrease nonlinearly from pure MeOH up to n-PrOH where the lower entropic value is obtained. The relative contributions by enthalpy (ξ H ) and entropy (ξ TS ) toward the solution processes are given by equations (5) and (6) [23]:
The main contributor to the (positive) standard molar Gibbs energy of solution of EtP, in all cases, is the (positive) enthalpy (ξ H > 0.546).
Enthalpy-Entropy Compensation of EtP
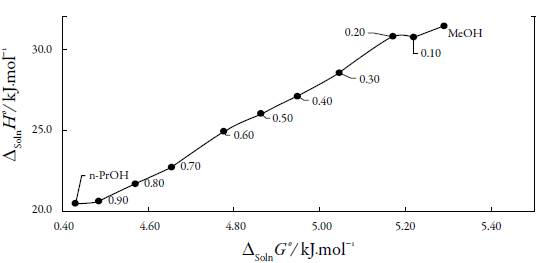
There are several reports in the literature that have demonstrated enthalpy-entropy compensation effects for the solubility of drugs in aqueous cosolvent mixtures. This analysis has been used in order to identify the mechanism of the cosolvent action. Weighted graphs of ∆solnH° as a function of ∆solnG° (7° at the mean temperature permit such an analysis [24, 25].
Figure 4 shows that EtP (3) in the {n-PrOH (1) + MeOH (2)} solvent system presents a non-linear ∆solnH° vs. ∆solnG° (7° curve with a variable negative slope in the interval from (1=0.10 up to (1 = 0.20. In all cases, a variable positive slope is obtained with exception of mixtures with 0.1 and 0.2, a trend that is not common in these systems. Accordingly, the driving mechanism for solubility is the enthalpy, probably due to better solvation of the drug by n-PrOH molecules.
Computational validation
The x values of EtP in the {n-PrOH (1) + MeOH (2)} solvent mixtures were fitted/correlated using two combined computational models namely van't Hoff and Yalkowsky-Roseman. Thus, from four data can determine a high quantity of solubility values, between temperatures and compositions extremes. The van't Hoff model (VH) solubilities in various solvent mixtures including neat solvents were determined with the help of Eq. 7 [26, 27]:
Here, the terms A and B are the coefficients of model.
The logarithmic solubilities of Yalkowsky-Roseman (YR) model for a solute in the different solvent mixtures including neat solvents were determined with the help of Eq. 8 [28-33]:

Here, x3,1 and x3,2 are the mole fraction solubility of the solute in the mono-solvents 1 and 2; w 1 and w 2 denote the mass fractions of pure-solvents 1 and 2 in the mixture free of solute.
Combining the two models would have Eq. 9:
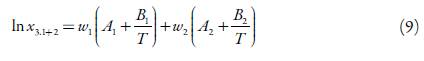
This combination is interesting, because the VH model predicts solubility by varying the temperature but with a constant cosolvent composition, and the YR model, allows to calculate the solubility in a range of cosolvent composition but in an isothermal manner. The combination develops a model, which allows varying both the cosolvent composition and the temperature. The mean relative deviation (MRD) is used as an error criterion [34]:
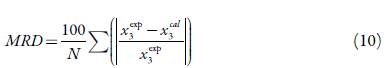
Where, N is the number of data in each set, and x3 exp and x3 cal are experimental and calculated solubility values.
The resulted equation for solubility prediction of EtP at different temperatures and composition (cosolvent mixtures), is as follow:
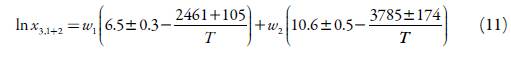
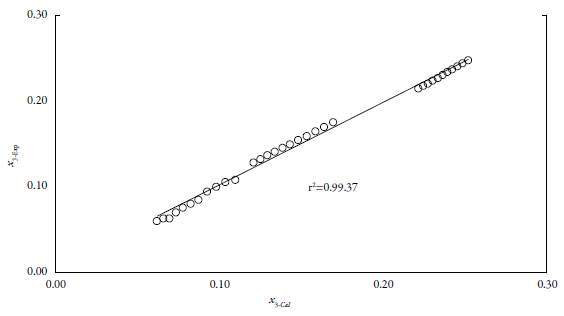
List of extracted data sets, their related x values calculated by Eq. 11, and produced MRD values are tabulated in table 4. For total 33 data points the overall MRD value is 3.48%. The prediction error is within an acceptable range, where 30% error is accepted for correlating the solubility data in the pharmaceutical area [34-36].
Table 4 Calculated molar solubility of EtP in {n-PrOH (1) + MeOH (2)} mixtures at different temperatures.
| Wa 1 | 283.15 K | RDb | 298.15 K | RDb | 313.15 K | RDb |
|---|---|---|---|---|---|---|
| 0.00 | 0.061 | 3.01 | 0.120 | 6.05 | 0.221 | 3.33 |
| 0.10 | 0.065 | 4.60 | 0.125 | 5.76 | 0.224 | 3.16 |
| 0.20 | 0.069 | 9.39 | 0.129 | 5.47 | 0.227 | 3.00 |
| 0.30 | 0.073 | 4.23 | 0.133 | 5.18 | 0.230 | 2.83 |
| 0.40 | 0.077 | 2.65 | 0.138 | 4.89 | 0.233 | 2.67 |
| 0.50 | 0.082 | 2.51 | 0.143 | 4.60 | 0.236 | 2.50 |
| 0.60 | 0.087 | 2.35 | 0.148 | 4.31 | 0.239 | 2.34 |
| 0.70 | 0.092 | 2.17 | 0.153 | 4.01 | 0.242 | 2.18 |
| 0.80 | 0.097 | 2.12 | 0.158 | 3.72 | 0.245 | 2.01 |
| 0.90 | 0.103 | 2.10 | 0.164 | 3.43 | 0.248 | 1.85 |
| 1.00 | 0.109 | 1.52 | 0.169 | 3.13 | 0.251 | 1.68 |
| %MRD | 3.48 |
a w 1 is the mass fraction of n-PrOH in the cosolvent mixture free of solute.
bRelative deviation 
The main advantage of the proposed model is that it does not require any experimental solubility data in mixed solvents.
Just four experimental solubility data points in mono-solvents and desired temperature. It almost provides good results, which might show its applicability in solubility prediction (figure 5). These characteristics make it a suitable model for solubility prediction of EtP in {n-PrOH (1) + MeOH (2)} mixture from 283.15 K up to 313.15 K and any solvent mixture.
CONCLUSIONS
The solubility of EtP in the investigated mixture solvents increased with the temperature increasing, these results indicate that the dissolution process is endothermic; therefore, the obtained thermodynamic functions are helpful to understand the dissolution process of EtP in the different organic solvents. Improving solubility prediction methods or making them easy to use is highly demanded in the pharmaceutical industries. In this work, we have showed the utility of the combined model van't Hoff and Yalkowsky-Roseman might be helpful in solubility prediction of EtP with acceptable error in {n-PrOH (1) + MeOH (2)} mixtures.


