


 Inglés (pdf)
 Articulo en XML
 Referencias del artículo
 Enviar articulo por email
 Citado por SciELO
  Citado por Google
  Similares en
SciELO
Similares en
SciELO  Similares en Google
 Permalink
INTRODUCTION
Previous studies suggest a complete dependence of green coffee price on its quality. This relationship creates an opportunity to increase coffee prices but a challenge for storing green coffee (Donovan et al., 2019). Green (parchment) coffee is the unroasted seed of the coffee tree separated from the fruit mucilage, washed and floated to remove seeds damaged by insects, and dried to between 10 and 12% moisture content. The quality of green coffee is determined by physical, chemical, and sensory analyses (Worku et al., 2016). The physical analysis consists of a visual evaluation of general aspects of the coffee beans (i.e. color, bean defects, and others), which helps determine the quality and hence the product’s valuation (Borém et al., 2013). Sensory analyses are commonly used to assess coffee quality (Worku et al., 2016) and to characterize different types of coffee (Borém et al., 2013).
Despite concerns, sensory analysis is considered a viable and scientific practice (Gatchalian, 1999; Stone & Sidel, 2004). Although there may be variability between “cuppers” (Worku et al., 2016), sensory analysis is perhaps the most reliable and consistent practice to predict or measure customer satisfaction (Gatchalian, 1999). Usually, a coffee sample is evaluated by several tasters and an average score is used in an effort to limit the impact of any individual’s tendencies.
The Specialty Coffee Association of America (SCAA) protocol is widely accepted worldwide for sensory analysis of coffee beverages (Borém et al., 2013). The SCAA (2018) protocol establishes a scale from 0 to 10 points to evaluate coffee based on the ten following attributes are: fragrance/aroma, flavor, aftertaste, acidity, body, balance, sweetness, clean cup, uniformity and overall score. A brief description of these attributes is available at SCAA Protocols | Cupping Specialty Coffee (SCAA, 2015).
For each attribute, a score range from 6 to 6.75 is considered good, from 7 to 7.75 is very good, from 8 to 8.75 is excellent, and from 9 to 9.75 is considered outstanding (SCAA, 2015; PROMPERU, 2019). Scores below 6 or full 10 are rare (Di Donfrancesco et al., 2014). A reason why very low scores are not often given is that coffee is presorted by color and moisture content before the sensory analysis and coffee with very high moisture (>14%) and of very poor color is rejected before being cupped. The sum of the individual attribute scores represents the global quality of the coffee (scale of 0 to 100), and coffees with a score of 80 or higher are considered specialty coffees (Lingle, 1993).
Some research suggests that out of all these attributes, the most important in determining quality are fragrance/aroma, acidity, body, and flavor (Van Der Vossen, 2009). However, other organizations have adjusted these criteria according to the market. For instance, they exclude uniformity because final consumers do not notice it; and replace clean cup with bitterness (Angels’ Take Inc, 2020).
Evidence suggests that sensory scores are influenced by temperature, rainfall, altitude and latitude (Barbosa et al., 2012). The presence of various volatile and nonvolatile chemical constituents, like proteins, amino acids, fatty acids and phenolic compounds, and the action of enzymes on these components may affect the flavor and aroma of the coffee (Barbosa et al., 2012).
The implications of water activity on green coffee quality during storage have not been fully explored (Donovan et al., 2019). In dried green coffee, water activity is the result of the hygroscopic capacity that leads to absorption of moisture from the air. Fretheim (2014) studied the relation between moisture content and water activity in a non-experimental setting, finding that moisture content can only explain water activity up to 51% of the time. Fretheim (2014)also posited an optimal level of water activity between 0.50 and 0.59 for the best coffee cup score and it is widely accepted that the Maillard reaction rate is at a maximum between 0.5 and 0.7 (Labuza & Dugan, 1971; Hedegaard & Skibsted, 2013). Maillard (or Browning) reactions are those which occur when coffee is roasted and give it unique flavors and aromas. If water activity is too low, these do not sufficiently occur, but if it is too high then molds may be present which impart adverse flavors. Hence, it is assumed that there is a quadratic relation between cupping scores and water activity.
In Colombia, coffee testing begins the moment farmers bring their coffee to the point of purchase. The first evaluation is moisture, where the technical standard of the National Federation of Coffee Growers of Colombia (FNC) indicates that dry green (parchment) coffee must have a moisture content between 10 and 12% by weight (Puerta-Quintero, 2006; Jurado-Chaná et al., 2009). The moisture content directly affects coffee quality, and it is one of the most significant quality indicators used by coffee buyers (Donovan et al., 2019). Then, the physical evaluation is done as follows: 1) a sample of 250g of dry parchment coffee is taken; 2) the sample is threshed to obtain green coffee; 3) the green coffee is passed through a No. 13 mesh; 4) the sample is checked to detect and remove defective grains; 5) finally, the yield after discarding chaff and damaged kernels is determined. Subsequently, the cup quality is evaluated by the coffee cuppers in a sensory laboratory (FNC, 2004). Once the traits of the coffee are determined, it is stored or shipped to its final destination. Traditionally, green coffee is stored in jute bags, but this material does not protect the coffee beans from moisture and insects (Donovan et al., 2019). One alternative then is to use hermetic bags such as the PICS bags for storage.
PICS bags are hermetic triple-layer bags made of two liners of high-density polyethylene (HDPE) fitted into a polypropylene (PP) woven bags (Baributsa et al., 2015; Williams et al., 2017b). The PICS technology aims to provide a “low-cost, simple, and effective solution for low resource farmers” to assist in the preservation of dry crops after harvest, by reducing the losses to insects and eliminating insecticide use (Murdock & Baributsa, 2014; Baributsa & Ignacio, 2020). Once the PICS bag is closed, the liners significantly reduce oxygen supply from outside to the contents inside the bag, and by doing so stop insect feeding activities and eliminate losses during storage of dry grain in addition to maintaining moisture content (Murdock et al., 2012; Williams et al., 2017b). Although the PICS technology was initially used in cowpea storage, it has also been effective in other crops (Baoua et al., 2014, Baoua et al., 2016; Vales et al., 2014; Mutungi et al., 2015). Different studies report on the storage of other grains in various modifications of PICS technology. For example, some studies show how PICS has been effective in controlling disease and contamination in maize (Williams et al., 2014; Tubbs et al., 2016), and groundnuts (Sudini et al., 2015; Baributsa et al., 2017). Also, PICS bags have shown to be better than polypropylene (PP) bags in maintaining relative humidity and preserving grain quality of maize and sorghum during storage (Njoroge et al., 2014; Williams et al., 2017a, Williams 2017b).
PICS bags have two liners to ensure crop protection in case the first liner is damaged (Baributsa et al., 2015). For crops where insects are not the primary concern, e.g., green coffee), a single interior layer may be sufficient for storing effectively and be less expensive for farmers with limited resources.
Donovan et al. (2019) analyze the effect of moisture content, water activity, and the use of PICS-2L and PICS-3L bags on the overall coffee quality scores. They find that both methods are able to control for moisture content and that there is no significant difference between them. The next step is to analyze the effect of sensory scores and the use of PICS bags on price and price differential (price - base price). To complement the analysis, it is necessary to study if individual sensory scores of green coffee are sensitive to storage time.
The objectives of this paper are to assess the impacts of alternative PICS storage applications, sensory attributes, and water activity on the price and price differential of stored green coffee beans. A second set of objectives are to assess how coffee sensory scores respond to storage duration, water activity and two alternative applications of PICS bags.
MATERIALS AND METHODS
The experiment was conducted at the Universidad de Caldas in Manizales, Colombia. The storage area of the experiment was similar to the ones found in small farms in Colombia’s central Andean region, with a concrete floor and limited natural ventilation panels but no mechanical ventilation, heat control, or air conditioning.
In total, seven hundred kilograms of green coffee (approximately 1540lbs) were purchased from the Cooperativa de Caficultores de Manizales (CCM) in Colombia. The coffee variety is unknown because the coffee was purchased at the cooperative and is meant to be a representative sample of the coffee in the region. There are four principal varieties grown in the area, which are Caturra, Colombia, Castillo, and Cenicafé that coffee growers have combined in their properties and that are not separated in the purchase process. The production system is also unknown because the coffee used may have been a blend of coffee from different farmer members of the cooperative who may have different production systems.
The experiments followed a completely randomized design with three treatments and nine replicates, giving 27 experimental units. The green coffee was stored in three different types of bags, traditional jute, PICS-2L, and PICS-3L bags. Thus, there were three treatments based on storage techniques. The PICS-2L treatment used the PICS bags in a less intensive option. PICS-2L used only one inner bag liner fitted into a PP woven bag. PICS-3L is the standard PICS bag with two inner liners fitted into an outer PP woven bag.
Each unit contained 50kg of green coffee. The nine bags in each treatment were divided into three groups: group 1 tested at 2, 5, and 8 months; group 2 tested at 3, 6, and 9 months; group 3 tested at 4, 7, and 10 months. Each set of three bags was tested and then retested twice. Three samples were taken from each bag on each sampling date.
All bags were labeled with a unique code that corresponded to sample codes written on bags sent to the cooperative for further analysis. These codes did not reference the treatments in order to ensure blind testing from the technicians at the cooperative. The technicians who evaluated the coffee sensory attributes are skilled, trained, and certified cuppers who regularly analyze samples at the cooperative for export and domestic customers and pricing purposes.
The first samples were drawn after two months in order to allow equilibration of conditions inside the bags. In addition, coffee harvest seasons in Colombia last roughly three (3) months and create seasonal patterns in prices (Donovan et al., 2019) that creates a general opportunity to store coffee for two or more months for profitability. In addition, all of the samples drawn from traditional jute bags exceeded the 14% moisture threshold set by the cooperative. Tasters do not evaluate such samples because mold could contaminate their equipment, and it is assumed that the coffee will be of low quality. Thus, there is no data on the price of the samples stored in jute bags.
Likewise, some of the PICS bags resulted in samples exceeding 14% moisture. This arose because at the outset of the study, it was humid and raining. While green coffee was obtained from the cooperative at 12% moisture, some of it exceeded 14% by the time it could be bagged and sealed. Coffee in those bags remained at 14% moisture and could not be analyzed according to the rules of the cooperative’s laboratory. Given that this is a field experiment, moisture could not be precisely controlled reflecting the realities for smallholder farmers in Caldas.
The variables measured during the experiment are the price assigned by the cooperative in Colombian Pesos (COP), the base price determined in the New York Stock Exchange (NYSE) for coffee, the cupping sensory scores, and water activity. The last variable was measured for each sample at the storage site using an AQUALAB Pawkit water activity meter. This handheld device converts a measured humidity value into a specific capacitance by electronic measurement using the circuit embedded in the device (METER Group, 2017).
Two sets of dependent variables are defined. In the first set, there is the price of bag (i) of green coffee Pric e i ; and price differential 𝑃𝐷𝑖𝑓 𝑓 𝑖 measured as the difference between the coffee bag’s price and its base price. The coffee base price is the current market price for standard coffee with no premium or discount being offered at the cooperative, where the sensory aspects were analyzed and the sample prices were assigned. Hence, the Price Differential can estimate the effect of the sensory scores on the coffee premium or discount. The second set of independent variables are the coffee sensory scores 𝑆 𝑆 𝑠𝑖 where the subscript 𝑠 refers to one of the ten cupping sensory scores.
An independent binary variable 𝑃𝐼𝐶𝑆 2 𝑖 is created, which takes the value of 1 if the coffee was stored in a PICS-2L bag and zero otherwise. Analogously, another binary variable called 𝑃𝐼𝐶𝑆 3 𝑖 is created, which the value of 1 if the coffee was places in a PICS-3L bag and zero otherwise. Sensory scores are also included as independent variables in the coffee price regressions.
As control variables, there are month group binary variables ( 𝑔 𝑔 ) where the subscript (𝑔=1,2,3) represents the month group in which the sample was taken. Additionally, for the regressions control for water activity ( 𝐴𝑊 𝑖 ), which is the measured water activity for bag𝑖.
The first step to test the hypotheses, is to perform an Analysis of Variance (ANOVA) to examine the differences between and across sample group mean of sensory scores according to: a) storage times; b) type of PICS bag used. To check the direction of the difference between groups and to test if that difference is significant, the analysis includes pairwise t-tests. In these tests, sub-sample means are compared: a) according to the month group of observation; b) and according to the type of bag used.
In the second part of the statistical analysis, a series of regressions are estimated using Ordinary Least Squares (OLS), which is a method for finding the mean of a dependent variable conditional on the fixed values of the key explanatory variables. The principle of OLS is to minimize the sum of the squared error between the observed values of the dependent variable and the conditional means of the specified regression function (model) (Gujarati, 2003). Donovan et al. (2019) measures the effects of water activity, moisture content and the use of a PICS bag on the sum of the 10 sensory scores using a shorter storage horizon. In contrast, this research aims to measure the effect of individual sensory scores, water activity and the use of PICS bags on the coffee price. To do so, we define Equation 1 and Equation 2 below.
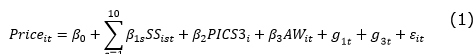

Where the subscript 𝑖 refers to the i-th sample and the subscript 𝑡 is the month when the sample was taken. 𝑆𝑆 𝑖𝑠𝑡 is the s-th sensory score and 𝜀 𝑖𝑡 is the random error term. All other variables are defined above. The omitted reference treatment is the PICS-2L bag. Notice that moisture content is not included because it may have correlation with water activity, which is the main concern.
To measure the effect of storage time and the use of PICS bags on the sensory scores the following models are defined in Equation 3 and Equation 4:

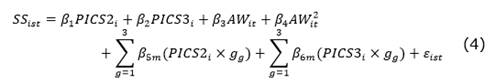
To make interpretation easier, the constant is suppressed and both PICS binary variables included. Even though the intercept is suppressed, all three group binary variables cannot be included because they would be perfectly collinear with the PICS binary variables and the OLS algorithm would not have a unique solution. The choice of which to omit does not alter the model predicted values, residuals, and statistical tests. In addition, Equation (4) estimates the interaction effect of the PICS bags with storage time via the group binaries. The water activity variable is included in quadratic terms following the theory that describes a hypothetical relation (Labuza & Dugan, 1971; Fretheim, 2014).
The models in (3) and (4) include group fixed effects instead of month fixed effects for two reasons. First, it increases the degrees of freedom. Second, if there were missing observations in a particular month, it would result in insufficient observations on certain bag types with month treatments and that could result in a poorly specified model or even failure of the OLS algorithm to find a solution.
All statistical tests are carried out using STATA® developed by Statacorp (2019).
RESULTS AND DISCUSSIONS
First, it is important to remind the readers that sensory and price data were not obtained for green coffee stored in traditional bags because they were unable to control moisture content. Such bags should not be used to store green coffee and, based on experiences of this study in the humid Caldas environment, it is risky for smallholder farmers to use jute bags for transportation.
There are 92 usable observations over a period of 10 months. 47 observations for green coffee were stored in the PICS-2L bags, and forty-five observations for green coffee were stored in the PICS-3L bags. The sample is not evenly distributed across the 10 months of observation. For instance, months 2 and 3 have 9 observations each, month 4 has 14 observations, month 5 has 6 observations, and the following months have different number of observations. In months 5 and 8 no PICS-2L bags were observed making monthly analysis potentially infeasible.
In group 1 (months 2, 5 and 8) there is a total of 21 observations; in group 2 (months 3, 6, 9) there is a total of 27 observations; and in group 3 (months 4, 7, 10) there is a total of 44 observations. Grouping observation in this way did not spread the types of PICS bags evenly within month sets. However, each month group has more than 2 observations for each type of PICS bag making statistical analysis feasible.
Descriptive statistics of the main traits observed in the sample of 92 observations are summarized in Table 1.
Table 1 Descriptive statistics of the main variables observed in the sample
| Mean | Std. Dev. | Min | Max | |
|---|---|---|---|---|
| Coffee Price | 81,379.05 | 3,853.52 | 74,204.00 | 89,871.00 |
| Price Differential | 2,427.97 | 1,629.46 | -1,540.00 | 6,371.00 |
| AW | 0.69 | 0.02 | 0.64 | 0.72 |
| Pics Binary Variables | ||||
| PICS3 | 0.49 | 0.50 | 0.00 | 1.00 |
| PICS2 | 0.51 | 0.50 | 0.00 | 1.00 |
| Cupping Scores | ||||
| Frag./Aroma | 6.77 | 0.55 | 6.00 | 7.50 |
| Flavor | 6.58 | 0.63 | 6.00 | 8.00 |
| Aftertaste | 6.71 | 0.57 | 6.00 | 7.50 |
| Acidity | 6.81 | 0.66 | 6.00 | 8.00 |
| Body | 6.72 | 0.49 | 6.00 | 7.50 |
| Balance | 6.83 | 0.57 | 6.00 | 7.50 |
| Clean Cup | 8.09 | 2.22 | 0.00 | 10.00 |
| Sweetness | 8.47 | 1.94 | 6.00 | 10.00 |
| Uniformity | 8.13 | 1.92 | 6.00 | 10.00 |
| Overall | 6.60 | 0.71 | 6.00 | 8.00 |
| Group Binary Variables | ||||
| Group 1: Month 2,5,8 | 0.23 | 0.42 | 0.00 | 1.00 |
| Group 2: Month 3,6,9 | 0.29 | 0.46 | 0.00 | 1.00 |
| Group 3: Month 4,7,10 | 0.48 | 0.50 | 0.00 | 1.00 |
| Observations | 92 |
Coffee price and price differentials are measured in Colombian Pesos. AW is the water activity measured as the ratio of the partial water vapor pressure of the food itself in a completely undisturbed balance with the surrounding media, and the vapor pressure of distilled water under identical conditions (Food & Drug Administration, 1984). PICS2 and PICS3 are binary variables that take the value of 1 if two layers or three layers of PICS bag where used respectively. Group binary variables are variables that take the value of 1 if the sample was taken in a particular set of months and zero otherwise (Group 1: Months 2,5,8; Group 2: Months 3,6,9; Group 3: Months 4,7,10). There are no observations in Month 1. Cupping scores are based on a scale of 10.
The coefficient of variation (CV) for each variable, measured as the (standard deviation divided by the sample mean) quantifies a normalized measure of variability. The sensory trait with the lowest CV is the Body (0.07) while the one with the highest CV is clean cup (0.27). The differences in variability across sensory scores, suggests that they react differently to various factors during storage.
An important feature of the distribution of sensory scores is that the most common sensory score is 6 or 7, except for sweetness, clean cup, and uniformity which have a mode of 10. These last three scores have a distinct behavior, probably because they are measured towards the end of the cupping process (SCAA, 2015).
Pairwise Pearson correlation coefficients between the main variables observed in the sample were tested against a null hypothesis of zero correlation. In general, there was significant positive correlation between sensory scores. Water activity was found to have significant correlation only with price and the price differential. Among sensory scores, price was found to only be significantly correlated with aftertaste and balance whereas the price differential was found to be significantly correlated with aftertaste, acidity, body, and sweetness.
Coffee price has a positive and significant correlation coefficient with the price differential at the 5% level. This is no surprise, given that the price differential is a function of price. There is no significant correlation between price and the use of either type of PICS bag. There is a positive and significant correlation between the use of a PICS-2L bag and the price differential.
These correlation results suggest three things. First, the same sensory attributes that are correlated with price, may not be correlated with the price differential. Second, water activity has a different correlation with price and with the price differential. Third, although the PICS binary variables are not correlated with coffee price, they are correlated with the price differential.
Prior to presenting ANOVA results, Figure 1 compares the mean values of coffee price and the price differential by type of PICS bags and month groups. Coffee price and its price differential are lower when using a PICS-3L bag than when using a PICS-2L bag, except in month group 2. From the graph, it is not possible to know if these differences are statistically significant. Moreover, there seems to be a negative correlation between price and storage time.
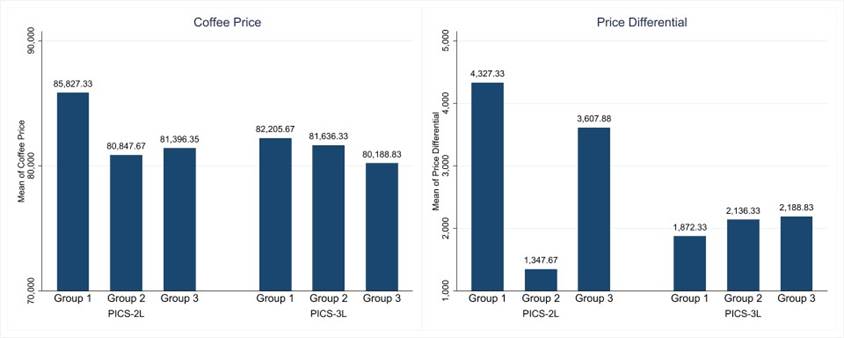
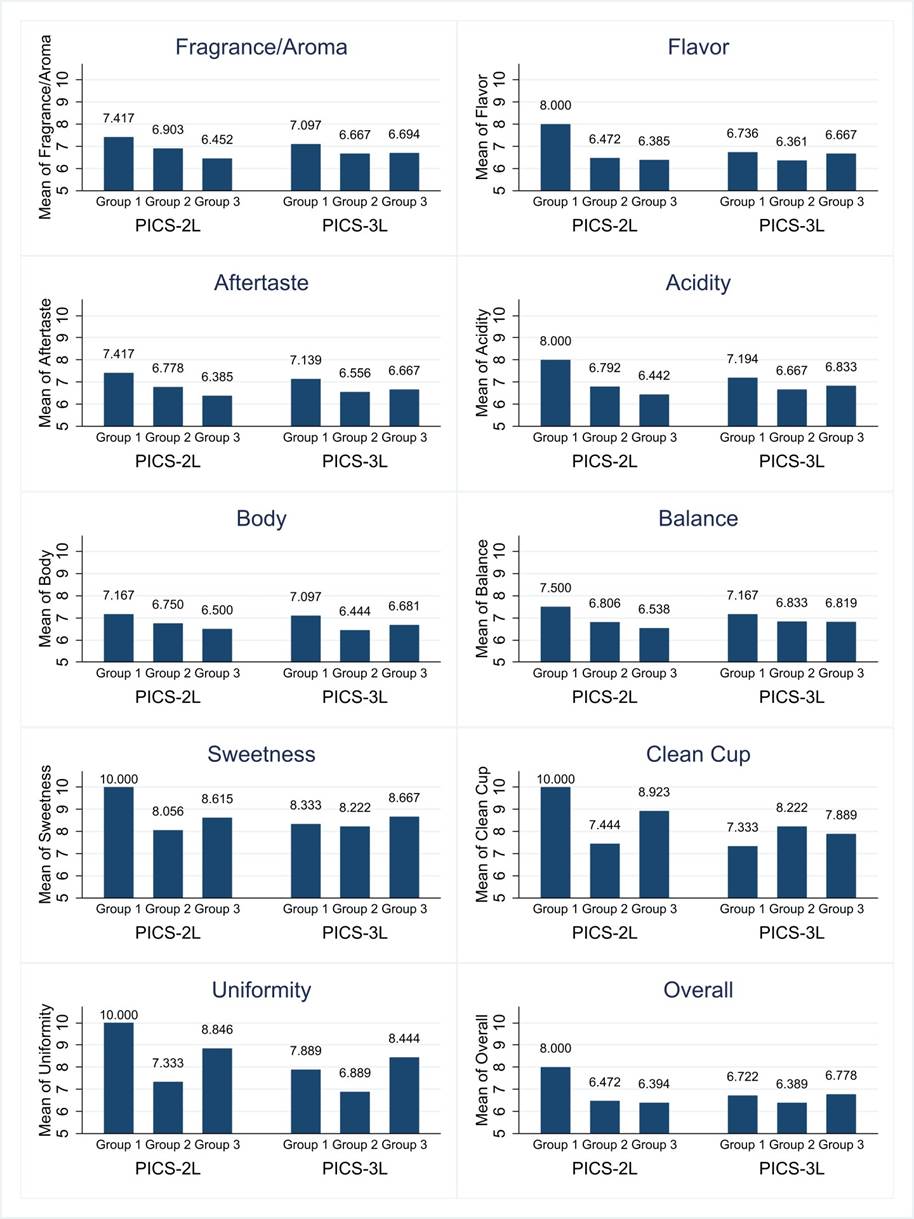
Figure 2 shows a visual comparison of mean values of the sensory scores by type of PICS bags and month groups. In most cases, with more storage time, the sensory score is lower. The case is not clear, however, if there are statistically significant differences between means by using a PICS bag with two or three layers.
ANOVA results comparing sample mean differences between month groups, between the use of different PICS bags, and between the interaction of months and PICS bags communicate significance in the differences between different groupings of observations. These show that coffee price has significant differences in sample means between month groups at the 10% level. There is no significant difference when using a PICS-2L bag or a PICS-3L bag. The coffee price differential has significant differences for sample means between month groups and the two different PICS bag storage methods.
Except for clean cup and sweetness, all differences in the average sensory scores between month groups are significant at the 1% level. Flavor, clean cup, and overall scores appear to have significant differences when using different types of PICS bags. Results also show that some of these differences are translated when analyzing the interactions of PICS bags and month group binary variables.
In general, the ANOVA results suggest that there is evidence of a significant difference between sensory scores based on the time and method of storage. These results do not indicate the “direction” of the difference between groups, however. For instance, it tells us if there is significant difference between groups, but it doesn’t tell us what average score is higher. For this reason, the analysis extends to pairwise comparison of means using t-tests.
Results show that coffee price is approximately 184 COP per kg. lower when using a PICS-3L bag than when using a PICS-2L bag. This difference is not statistically significant even though it is economically significant. In contrast, the mean of the price differential when using a PICS-3L bag is 736 COP per kg. lower than when using a PICS-2L bag. This difference is statistically significant and suggests that the differences in prices may be best explained by differences in the price differential.
The average score of aftertaste, acidity and balance scores are between 0.2 and 0.3 points higher when using a PICS-3L bag instead of a PICS-2L bag. These differences are significant at the 5% level. The results suggest that there is no significant difference in the other sensory scores. One thing to notice is that, although not statistically significant, the scores of clean cup, sweetness, and uniformity are lower when using a PICS-3L bags compared to when using a PICS-2L bag.
Pairwise comparisons of sensory scores sample averages for different month groups were also conducted. The pairwise comparison t-tests show that fragrance scores diminish with storage time. Specifically, fragrance scores observed at a given month group is 0.3 points higher than those observed at a subsequent month group, on average. In addition, fragrance scores in month group 1 are 0.6 points higher than those observed in month group 3. These differences are statistically significant at the 5% level. It is the only score with a significant difference between all successive month group average values.
The scores for flavor, aftertaste, acidity, body, balance, and overall observed in month group 1 are between 0.4 and 0.6 points higher than those observed in month group 2, and between 0.35 and 0.7 points higher than those observed in month group 3. These differences are all statistically significant at the 5% level. There does not seem to be any statistically significant difference in these attributes when observed at month group 2 or month group 3.
Clean cup and sweetness do not present any statistically significant differences when observed at different storage times. On the other hand, uniformity shows a statistically significant higher score in month group 3 compared to month group 2 at the 1% level.
These results indicate that all sensory scores, except for clean cup, sweetness, and uniformity diminish with higher storage time. This is no surprise because as it was mentioned previously, clean cup, sweetness, and uniformity are more related to the preparation process rather than storage. The OLS estimates can help quantify check if these effects persist after controlling for other variables.
The OLS regression results for Equation 1 and Equation 2 are presented in Table 2. The models explain at least 50% of the total variability, which is considered a good fit with field experiment data. The following interpretations analyze increases or decreases in the price or the price differential of a sample observation (i.e., a bag of 50 kg).
Table 2 OLS regressions of coffee price and price differential as the dependent variable.
| (1) | (2) | (3) | (1) | (2) | (3) | |
| Trait | Coffee Price | Coffee Price | Coffee Price | Price Differential | Price Differential | Price Differential |
| Frag./Aroma | 2834.5 | 2715.6 | 2231.9 | 1259.8 | 909.1 | 988.6 |
| (2665.06) | (2702.22) | (2474.30) | (1151.24) | (1082.72) | (1107.39) | |
| Flavor | 4125.6** | 4026.1** | 3345.0** | 943.4 | 650.0 | 761.9 |
| (1704.26) | (1756.19) | (1652.01) | (873.07) | (772.11) | (791.25) | |
| Aftertaste | -13502.8*** | -13401.5*** | -13126.0*** | -4371.8*** | -4073.0*** | -4118.2*** |
| (3286.04) | (3326.65) | (2981.42) | (1465.21) | (1408.18) | (1408.93) | |
| Acidity | -1125.3 | -1128.9 | -78.92 | 127.4 | 116.6 | -55.78 |
| (2237.61) | (2262.26) | (1833.99) | (838.69) | (765.74) | (822.93) | |
| Body | 8017.5*** | 8029.6*** | 7802.1*** | 1107.2 | 1142.9 | 1180.3 |
| (1584.83) | (1584.45) | (1580.22) | (873.76) | (833.07) | (812.76) | |
| Balance | -1316.7 | -1266.9 | -1433.1 | 652.4 | 799.3 | 826.6 |
| (1566.23) | (1599.83) | (1452.60) | (652.03) | (616.62) | (627.22) | |
| Clean Cup | 274.7 | 270.2 | 485.0 | 208.8 | 195.4 | 160.1 |
| (405.60) | (430.12) | (380.13) | (158.23) | (197.35) | (197.48) | |
| Sweetness | 159.8 | 176.5 | 241.0 | 180.4 | 229.5 | 218.9 |
| (451.46) | (452.36) | (426.21) | (207.60) | (189.43) | (188.07) | |
| Uniformity | -999.6* | -1029.6* | -1127.5** | -435.3* | -523.7** | -507.6** |
| (540.63) | (562.98) | (513.15) | (229.36) | (247.98) | (247.66) | |
| Overall | 1947.9 | 2037.0 | 1654.2 | 76.68 | 339.5 | 402.4 |
| (1413.24) | (1444.13) | (1391.77) | (734.50) | (666.15) | (659.15) | |
| PICS3 | -313.7 | -346.5 | -925.1*** | -919.7*** | ||
| (734.54) | (708.58) | (331.65) | (326.67) | |||
| AW | -76492.1*** | 12561.2 | ||||
| (24352.02) | (13287.58) | |||||
| Constant | 80221.6*** | 80244.1*** | 134514.9*** | 3145.0 | 3211.3 | -5700.8 |
| (6990.36) | (7154.61) | (17218.77) | (2451.04) | (2309.81) | (9742.77) | |
| Month Group Fixed Effects | Yes | Yes | Yes | Yes | Yes | Yes |
| Obs. | 92 | 92 | 92 | 92 | 92 | 92 |
| R2 | 0.501 | 0.502 | 0.568 | 0.397 | 0.457 | 0.467 |
| Adj. R2 | 0.425 | 0.419 | 0.490 | 0.305 | 0.367 | 0.370 |
Bootstrapped standard errors (rep = 1000) errors in parentheses, * p < 0.10, ** p < 0.05, *** p < 0.01. (i) Cupping sensory scores are on a scale of 10. (ii) PICS3 is a binary variable that takes the value of 1 if the coffee was put in a PICS-3L bag and 0 otherwise.
Flavor and body show a positive and significant effect on coffee prices. Parameter estimates indicate that an additional point in the flavor score increases the price per bag by at least 3,300 COP, which is approximately 66 COP per kg. Similarly, an increase of one point in the body score increases the price per bag by 8,000 COP (160 per kg), on average. Nevertheless, the effects of these attributes are not transmitted to the price differential. Therefore, it is safe to assume that body and flavor are important factors to explain the standard coffee market price, but they may not explain the premium (or discount) offered at the cooperative.
Aftertaste and uniformity affect coffee prices negatively. An increase of one point in aftertaste reduces coffee prices by as much as 13,000 COP per bag (260 COP per kg). Similarly, an additional point in uniformity decreases coffee price by at least 900 COP per bag (18 COP per kg), on average.
Interestingly, the effect of these sensory score categories is also significant in the price differential. An increase in one point of the score in aftertaste and uniformity decreases the price differential by at least 4,000 COP and 440 COP per bag (82 COP and 8.8 COP per kg), respectively. The effect of the coffee price reduction could be best clarified by the effect on the price differential. Coffee has distinctive qualities depending on its origin, and thus a coffee from Colombia is “expected” to have some unique traits (Van Der Vossen, 2009). Perhaps, these samples have significantly different scores in Uniformity and Aftertaste compared to other coffees in the same region and so they receive a discount.
Consistent with Donovan et al. (2019) , using a PICS-3L bag instead of a PICS-2L bag has no effect on the coffee price. However, there is a negative effect of PICS-3L bag use on the price differential of at least 900 COP per bag (18 COP per kg), on average. This may be an indication that using two inner liners of HDPE in the bags, instead of one, has no positive effect on revenues; if anything, the opposite is true. Therefore, using a PICS-2L bag instead of a PICS-3L bag, may translate into savings for coffee growers choosing to adopt hermetic storage. The cost of the PICS-2L bag is roughly two thirds, the cost of the PICS-3L bag. Therefore, assuming that a PICS-3L bag costs 3 COP, using a PICS-2L bag generates a saving of 1 COP on every bag used. This saving means that if the PICS-3L does not appear to be economically viable for coffee growers, famers could consider using PICS technology with PICS-2L bags instead. Donovan et al. (2020) estimates that on average green coffee price is expected to rise by 7,600 COP per 50 kg between the 4th quarter one year and the first quarter of the following year. That is, from Colombia’s annual peak harvest in the fourth quarter to the period of little or no production prior to the next harvest that occurs in the second quarter. The current exchange rate is nearly 4,000 COP per US Dollar meaning that a PICS-2L would cost approximately 8,000 COP. Using the Donovan et al. (2020) benchmark the PICS-2L would nearly pay for itself in one use. However, one of the distinct features of PICS bags are their re-usability and thus in two years or less the PICS-2L is projected to generate an annual profit equal to the seasonal increase in price for 2 to 4 years. From the results above, there does not immediately appear to be an economic incentive to use the PICS-3L to store green coffee due to its higher cost and no direct economic gain over PICS-2L. However, Donovan et al. (2019) suggest that the PICS-3L system’s redundant bag may enhance its successful re-usability. That is, if a bag should suffer damage, then the redundant bag, in the case of green coffee, would suffice to maintain protection. We project a cost of 12,000 COP for the PICS-3L and thus expect it to also generate a profitable return to storage in its second use.
Additionally, water activity has a negative and significant effect on coffee price but this is not translated to the price differential. It is notable that the water activity measured in samples was uniformly above Fretheim (2014) optimal level and thus the sample encompasses only observations where an increase in water activity is likely to give rise to mold and adverse sensory outcomes and does not encompass the levels of water activity that might lead to insufficient Maillard reactions. This also explains why the quadratic effect of water activity on price was not statistically important.
Continuing with the analysis, parameter estimates for Equation 3 and Equation 4 are presented in Table 3 and Table 4, respectively. The total variability of the dependent variable explained by these equations are between 14% and 54%, which is an acceptable fit in field experiments.
Table 3 OLS regression of cupping sensory scores as a dependent variable (equation 3).
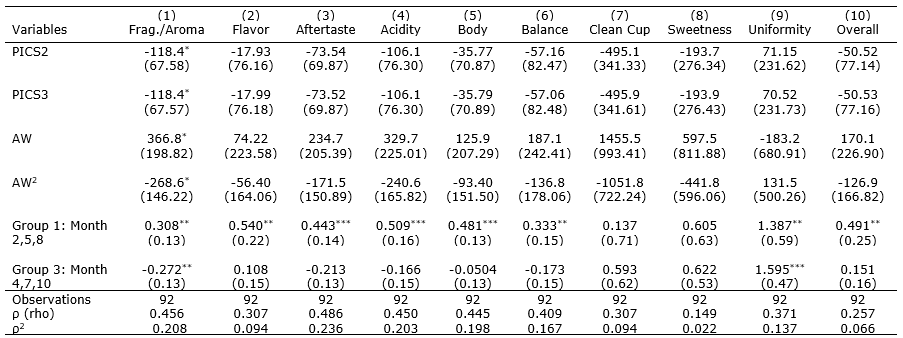
Robust standard errors in parentheses, * p < 0.10, ** p < 0.05, *** p < 0.01
ρ (rho) is the coefficient of correlation between observed and fitted values
(i) The dependent variables are cupping sensory scores. (ii) PICS3 is a binary variable that identifies if the coffee was put in a PICS-3L bag. PICS2 is a binary variable that identifies if the coffee was put in a PICS-2L bag. (iii) Group 1 is a binary variable that takes the value of 1 if the sample was taken in months 2,5,8 and zero otherwise. Group 2 is a binary variable that takes the value of 1 if the sample was taken in months 3,6,9 and zero otherwise. Group 3 is a binary variable that takes the value of 1 if the sample was taken in months 4,7,10 and zero otherwise.
Table 4 OLS regression of cupping sensory scores as a dependent variable (equation 4)
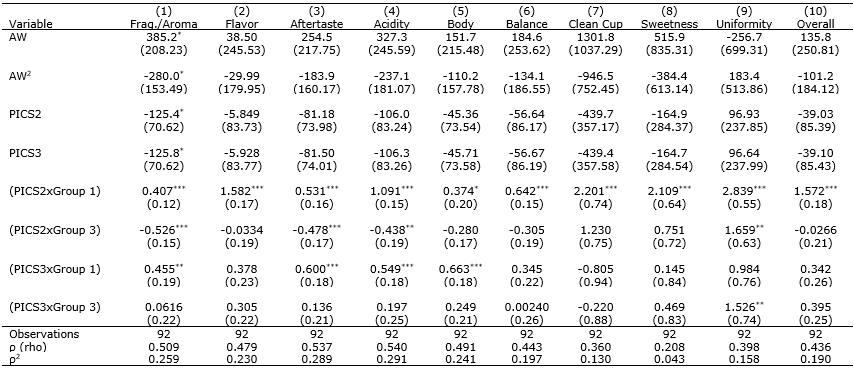
Robust standard errors in parentheses, * p < 0.10, ** p < 0.05, *** p < 0.01
ρ (rho) is the coefficient of correlation between observed and fitted values
(i) The dependent variables correspond to cupping scores. (ii) PICS2 is a binary variable that takes the value of 1 if the coffee was put in a PICS-2L bag and zero otherwise. PICS3 is a binary variable that takes the value of 1 if the coffee was put in a PICS-3L bag and zero otherwise. (iii) Group 1 is a binary variable that takes the value of 1 if the sample was taken in months 2,5,8 and zero otherwise. Group 2 is a binary variable that takes the value of 1 if the sample was taken in months 3,6,9 and zero otherwise. Group 3 is a binary variable that takes the value of 1 if the sample was taken in months 4,7,10 and zero otherwise.
For all attributes, except uniformity, the coefficients of water activity have the expected signs according to the theory. This means that the relation between sensory scores and water activity behaves like a quadratic concave down function; where the score increases with water activity up to a certain optimal point and reduces after that. However, these coefficients are usually not statically significant. Fragrance is the only score that has significant water activity coefficients. To calculate the optimal level of water activity using sample regression coefficients, note that if the relationship with water activity is 𝑆 𝑆 𝑖𝑡 =𝑎𝐴 𝑊 𝑖𝑡 −𝑏 𝐴𝑊 𝑖𝑡 2 +𝑐, then simple calculus provides an optimal water activity as 𝐴𝑊 ∗ =−𝑏/2𝑎. Given this formula, it seems that the optimal level of water activity for fragrance is around 0.7, which is also in line with theory (Labuza & Dugan, 1971) but much higher than the optimal values posited by Fretheim (2014) . However, his focus was on the overall sensory score and not fragrance.
Uniformity has the opposite signs for water activity. However, there are a few things to notice. First, uniformity, clean cup, and sweetness are measured in the last step before scoring (SCAA, 2015). These attributes measure the green coffee’s preparation and processing, after grinding and roasting (Lingle & Menon, 2017). Therefore, if these coefficients were statistically significant, it would mean that as water activity increases, it is more difficult to keep a uniform preparation and processing until a minimum point. This is related to the fact that it is difficult to control for moisture in the region where the coffee was sampled (Donovan et al., 2019).
Consistent with Donovan et al. (2019) , there is no significant difference when using the two types of PICS bags. All scores, cupping sensory scores except clean cup and sweetness are between 0.3 and 1.4 points higher when samples at month group 1 compared to month group 2. The fragrance attribute is usually 0.27 points lower, and uniformity is about 1.6 points higher when sampled in month group 3 compared to month group 2.
When analyzing the coefficient of interactions variables between PICS bags and month groups in Table 8, it seems that scores are higher for samples in a PICS-2L bag in month group 1 compared to an observation in month group 2.
These results are evidence that the difference in storage time has a more significant effect on sensory scores than the difference in the use of PICS-2L and PICS-3L bags.
CONCLUSION
It has been found during this study that using the traditional PICS-3L bag is likely not the most profitable approach for Colombian coffee producers and associations considering the adoption of hermetic storage. These results suggest that instead of the PICS-2L bag (with only one HDPE inner bag layer) is likely more profitable. Furthermore, it is found that not all cupping sensory scores increase the price of hermetically stored green coffee. Flavor and body increase green coffee price. Whereas, aftertaste and uniformity affect the coffee price and price differential negatively. Moreover, body and flavor are important determinants of standard coffee market price, but not of the cooperative’s premium (price differential). We conclude that it is important to consider how storage may deviate sensory attributes from what is expected from coffees in a region resulting in discounts in price.
Results confirm that water activity is an important consideration in the storage of green coffee and that high-water activity results in reduced price and water activity levels partially determine key sensory attributes. We conclude that greater attention should be paid to this measurement in the evaluation and pricing of coffee, especially as storage increases in frequency.
Due to historical seasonality in Colombian coffee prices, the ability to maintain quality attributes of green coffee during storage represents a means for enhancing profit of small-scale producers and cooperatives that support them. Because seasonal fluctuations in prices are exacerbated by climate events, such as El Niño and La Niña, storage may also represent a resiliency strategy for managing climate change.
Future research is needed to perform studies of coffee prices and sensory attributes where moisture and water activity are controlled in a laboratory setting. However, these type of analyses may not contain the effect of insects on the coffee valuation. Fretheim (2014) also suggests that in a meaningful portion of coffee samples water activity and moisture content are not closely related. Better understanding when and why this discontinuity occurs, and how it impacts green coffee quality is an important future dimension of research to be explored.

