Inglés (pdf)
 Articulo en XML
 Referencias del artículo
 Enviar articulo por email
 Citado por SciELO
  Citado por Google
  Similares en
SciELO
Similares en
SciELO  Similares en Google
 Permalink
I. Introduction
Colombia is responsible for almost 70% of the world’s production of coca —the primary input of cocaine— (UNODC, 2020). To contain the problem, an ongoing war on drugs was waged in 2000 under ‘Plan Colombia’, a bilateral effort by the Colombian and the United States governments based on forced eradication (either through air-spraying with glyphosate —a powerful herbicide— or through manual eradication), interdiction measures (the destruction of processing laboratories and the seizure of inputs and outputs), and alternative development (the voluntary substitution of the crops through the provision of subsidies, technical assistance, and public infrastructure). Later, the 2016 peace agreement with the Fuerzas Armadas Revolucionarias de Colombia (FARC) guerrilla reemphasized the role of a series of territorial transformations, including land formalization and the provision of basic public goods and services. Under this new approach, Plan Colombia came to be re-termed as ‘Paz Colombia’.
While some of the above policies have been assessed separately by the empirical literature or, at best, in comparison to one another, no attention has been paid to their possible complementarities or incompatibilities. This is of particular pertinence to the ongoing debate among the Colombian public and the Constitutional Court regarding the renewal of air-fumigation efforts (El País, 2019), which was suspended in 2015, following a decision of the National Environmental Regulation Authority (ANLA, 2015) citing the negative effects of glyphosate on human health and the environment5. On the one hand, the government argues this strategy can reach large and distant areas of the country; on the other, apart from the concerns raised by the ANLA, stakeholders and independent observers –local and international officials, members of civil organizations, coca-growing families, and academics– also question its effectiveness and express concerns about the indiscriminate destruction of adjacent alternative crops and livelihoods, which undermines alternative development goals and territorial transformation processes (CRISIS, 2021). This criticism extends to manual eradication and to ‘war on drugs’ measures in general, which tend to criminalize poor farmer communities and push them into ‘unwilling alignment’ with illegal armed groups, while displacing them towards more remote parts of the countryside; all of which results in an increased expansion of coca. Instead, they argue, the State should de-emphasize the role of military interventions and provide farmers with genuine licit alternatives (ibid.).
Clearly, the above discussion raises questions regarding the relationship between the military and non-military components of Plan and Paz Colombia. From an economics of crime perspective (Becker, 1968), the choice of cultivating coca may depend on both the costs imposed by forced eradication (FE) and interdiction (either by the direct destruction of the crops and laboratories or through a higher risk) and on the benefits derived from participating in alternative development (AD) and those arising from territorial transformations (TT). Moreover, because the large margins from the cocaine industry allow coca leaf buyers to increase its price substantially at the farm gate to incentivize production (Moreno-Sanchez et al., 2003), both groups of policies might have to be implemented together to reduce the relative expected payoff of coca sufficiently enough to discourage its cultivation6. Finally, peasants whose illicit crops are destroyed by FE or interdiction and who find no viable economic alternative in the absence of AD and TT may resort to growing coca again, or to growing coca more intensively or extensively to compensate for the risk (Moreno-Sanchez et al., 2003; Robledo, 2015), while beneficiaries of AD and TT may have an incentive to ‘cheat’ and use the investments (subsidies, bridges, roads, and even better health, etc.) to continue growing coca if no significant penalties are imposed on them.
Furthermore, some of the key policies of both Plan and Paz Colombia, such as manual eradication and AD, have been widely overlooked. We propose, then, a comprehensive study on the effectiveness of all these policies and their interactions through a panel data regression model at municipal level with cross-sectional and time fixed effects during the 2005-2015 period, when aerial fumigation was still active. For identification, we use the change of net coca cultivation from year to year as the dependent variable, instead of its evel, as this change is not likely to simultaneously determine the intensity of the policies, which are assumed to be exogenously defined by the pre-existing levels of coca and the fixed nature of investments, lagging political and bureaucratic processes, and idiosyncratic characteristics of the municipalities.
Our results suggest that the aerial fumigation and manual eradication of one additional hectare (the two FE components) reduce coca plantations by around 0.06 and 0.17 hectares, respectively; while the destruction of one additional laboratory (‘interdiction’) reduces them by up to 3.4 hectares. As for AD investment, an additional $1 million pesos (some US$300) reduces coca cultivation by less than 0.01 hectares, while an additional $1 million pesos in infrastructure (one of the TT components) reduces them by roughly 0.001 hectares. Fundamentally, we also find that the military and non-military components of both Plan and Paz Colombia are complementary and interdependent (i.e., they depend on each other to be effective).
This work is organized as follows: the next section, Section II, presents a brief literature review; Section III provides the data; Section IV describes our identification strategy and estimation methods; Section V presents the results; and Section VI closes with a brief discussion.
II. Literature Review
Plan Colombia’s main forced eradication (FE) measure was aerial fumigation, spraying an average of 106,189 hectares annually since the year 2000 until its suspension in 2015 by the National Environmental Regulation Authority (ANLA, 2015). By contrast, only 29,816 hectares were eradicated manually each year during the same timeframe (data from the Observatorio de Drogas de Colombia, ODC). However, on the one hand, empirical studies show that air-spraying has either a positive effect on cultivation –as farmers compensate for eradication by growing more (Moreno-Sanchez et al., 2003)–, a statistically insignificant effect (Tabares & Rosales, 2005), or an economically negligible negative effect that makes it not a cost-effective strategy (Mejia et al., 2017). On the other hand, although its effectiveness has not yet been evaluated, manual eradication is subject to difficult geographical conditions, the hostility of the local communities, the presence of land-mines, and even enemy firepower (Mejía, 2016). To illustrate this, only in the 2008-2017 period, 115 members of the armed forces were killed and 418 were wounded in manual eradication operations (ODC, 2017).
Besides FE, the other military component of Plan Colombia is interdiction, which includes the destruction of laboratories (both ‘primary production infrastructure’ where coca leaves are turned into coca paste or base –the two main intermediate products– and cocaine processing facilities or ‘cristalizaderos’, where the final product is obtained), on the one hand, and the seizure of coca leaf, coca paste and base, and cocaine, on the other. In particular (and contrasting with aerial fumigation), econometric studies show that the destruction of one additional laboratory is associated with a reduction equivalent to three-hectares of coca cultivation, as the local demand for the leaf is eliminated (Mejía, 2016), given the monopsonistic structure of the coca leaf markets (Serrano López, 2017).
Plan Colombia’s third, smaller7 , non-military component is alternative development (AD), based on the voluntary substitution of legal agricultural projects for illicit crops through the provision of subsidies, technical assistance, and public infrastructure. Five main programs existed during the Plan Colombia era: the Forest Warden Families, Post-Eradication, Productive Projects, Rapid Response, and Strategic Sustainability programs. Yet, little effort has been devoted to analysing the effectiveness of AD, with conflicting results (Tabares & Rosales, 2005; Davalos, 2016). AD seems to have depended heavily on FE as a prerequisite for its implementation, which, in turn, was affected by poor soil conditions, little investment, scarce infrastructure, and lack of access to markets, among others (Veillette & Navarrete-Frías, 2005; Mejía 2016).
Plan Colombia’s acknowledgment of the difficulties and criticism related to it, led to a new approach based on the concept of territorial vulnerabilities, made explicit in the 2016 peace agreement between the government and the FARC. According to this agreement, illicit crops are a consequence of the territories’ poverty and marginality; hence, their reduction relies on an integral transformation of the territories themselves. Consequently, the treaty introduced the Integral Rural Reform and the National Illicit Crops Substitution Program in an attempt to overcome these vulnerabilities through a series of strategies, especially land formalization and the provision of public goods and services such as education, healthcare, credit, infrastructure, and technical assistance (OACP, 2016). Under this new approach, Plan Colombia came to be re-termed as ‘Paz Colombia’.
Nevertheless, empirical research on the different territorial transformations (TT) is very scarce, although with some favourable results: on the one hand, Davalos (2016) finds that an additional US$0.50 per capita investment in ‘social capital’ (the conjunction of infrastructure and human capital) reduces coca plantations by 0.09 hectares. On the other hand, Muñoz-Mora et al. (2018) find that the formalization of one additional hectare of land is associated with a 1.4-hectare decrease of coca. This is thanks to a ‘deterrence mechanism’ by which titles confer criminal responsibility to the owners and increase the value and expropriation cost of land (the penalty for growing coca); and to a ‘substitution mechanism’, whereby titles increase farmers’ access to AD programs and credit.
However, the relationships among the above groups of policies have not yet been analysed, particularly those between the military and non-military components of Plan and Paz Colombia (FE and interdiction, on one side, and AD and TT, on the other). Indeed, following an economics of crime perspective (Becker, 1968), rational individuals engage in crime if its expected utility exceeds that of other legal activities, and so the choice of cultivating coca may be dependent on both the costs imposed by FE and interdiction (either by the direct destruction of the crops and laboratories, or by a deterrence mechanism whereby the expected return of coca cultivation is reduced by the increased risk of having the crops destroyed) and on the benefits from participating in AD and arising from TT. Moreover, some of the key policies such as manual eradication and AD have been widely overlooked, despite their central roles during both plans. This is what we do in the rest of this paper.
III. Data
To analyse the effectiveness and interactions between policies (FE and interdiction, on one side; AD and TT on the other), we gather data on 291 of Colombia’s 1122 municipalities that had any net positive level of coca cultivation during the period of analysis, starting in 2005 (due to the availability of data) and ending in 2015 (the last year of aerial fumigation). This panel includes data on the annual number of coca hectares net of eradication8, the annual number of coca hectares destroyed through air-spraying, the annual number of coca hectares destroyed through manual eradication, the annual number of laboratories (both primary production infrastructure and ‘cristalizaderos’) destroyed, and the annual investment in AD programs (the Forest Warden Families, Post-Eradication, Productive Projects, Rapid Response, and Strategic Sustainability programs) in million pesos, retrieved from the Observatorio de Drogas de Colombia (ODC).
Although the period of analysis corresponds exclusively to the Plan Colombia era, we also include two central territorial transformations (TT) of Paz Colombia: public infrastructure and education, categorized by Davalos (2016) as the two components of ‘social investment’. For the former, we collect data on each municipality’s annual expenditure on fixed capital from the Departamento Nacional de Planeación (DNP); for the latter, we collect the annual school enrolment rate (number of students over the school-age population), from the Sistema de Información Geográfica para la Planeación y el Ordenamiento Territorial (SIG-OT). Unfortunately, according to data from the Agencia Nacional de Tierras (ANT), systematic efforts of land formalization (another central territorial transformation during the Paz Colombia era) did not take place during the period of analysis, and so its analysis rests outside the scope of this work9 .
Crucial control variables are also in order. To start with, we collect the annual number of forced displacement cases (from the Unidad Para las Víctimas, UPV), a phenomenon central to Colombia’s internal armed conflict (a contest for power between the government and illegal armed groups linked to the cocaine industry). It captures the sustained presence of these groups in each municipality, which determine coca cultivation by forcing farmers to grow coca through any form of intimidation and violence (reportedly, farmers who resist growing coca must leave the area or ‘face the consequences’ [CRISIS, 2021]), or simply because they constitute the demand for the coca leaf (recurrently, these groups provide incentives such as low-cost inputs and seeds [ibid.]). We also collect data on the annual rural population and the total population from SIG-OT, as well as on each municipality’s tax income from DNP (a rubric that includes property, industry and commerce, and gasoline tax), which we use as a proxy for relative wealth and for economic activity in each municipality.
All monetary variables are taken from the literature, are expressed in million pesos, and are adjusted for inflation using the Consumer Price Index. All variables with sources and descriptive statistics are presented and organized by groups (FE, interdiction, AD, TT, and X for control variables) in Table 1. The map of all municipalities with any net positive level of coca cultivation during the period of analysis included in the sample (shown in grey) is presented in Figure 1. The second variable in the table, Cocachange, will be introduced in the next section.
Table 1. Sources and descriptive statistics of variables (n=291), 2005-2015.Descriptive statistics of each variable are over the sample period totals for each municipality.
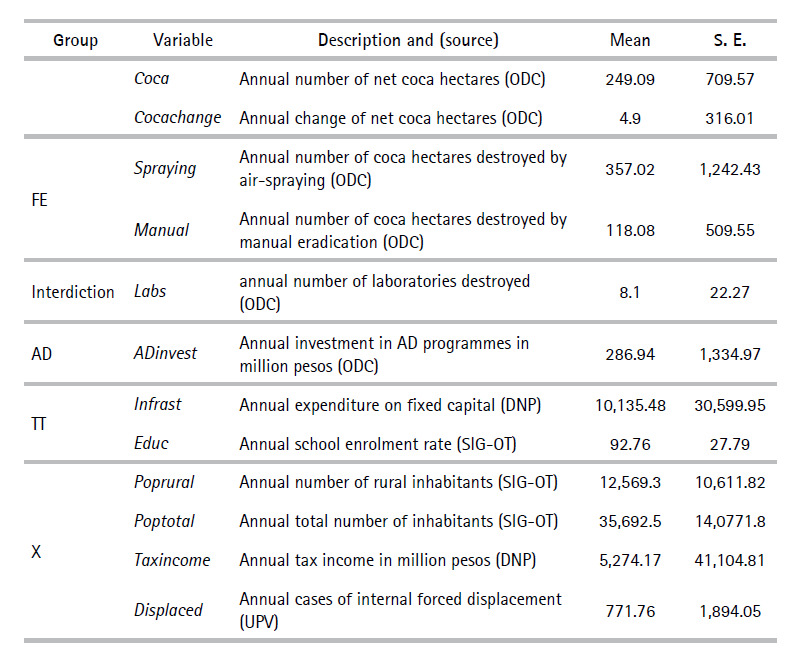
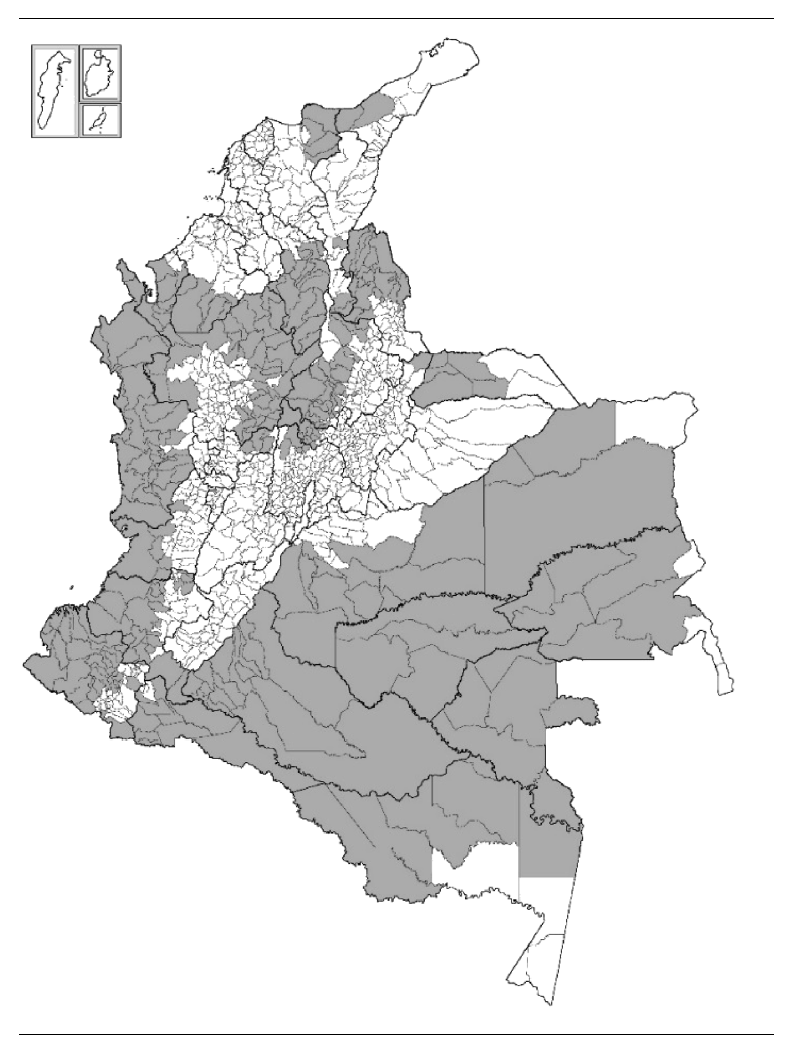
Figure 1. Municipalities with net positive levels of coca, Colombia 2005–2015.Municipalities with net positive levels of coca are shown in grey. Thin lines divide municipalities, whereas thicker lines correspond to larger political divisions, called ‘Departamentos’.
To show that there is considerable cross-sectional variation in the implementation of the different strategies; or, in other words, that the implementation of one strategy is not correlated with the application of the others across municipalities (i.e., no perfect multicollinearity), we also present a correlation matrix of the FE, interdiction, AD, and TT variables. We do this across municipalities for each year separately (although we only show 2008 and 2012 to save space) and over the 2005-2015 period totals for each municipality (Table 2).
Table 2. Correlation matrices of FE, laboratories, AD, and TT variables for 2008, 2012, and the whole sample period (2005-2015)
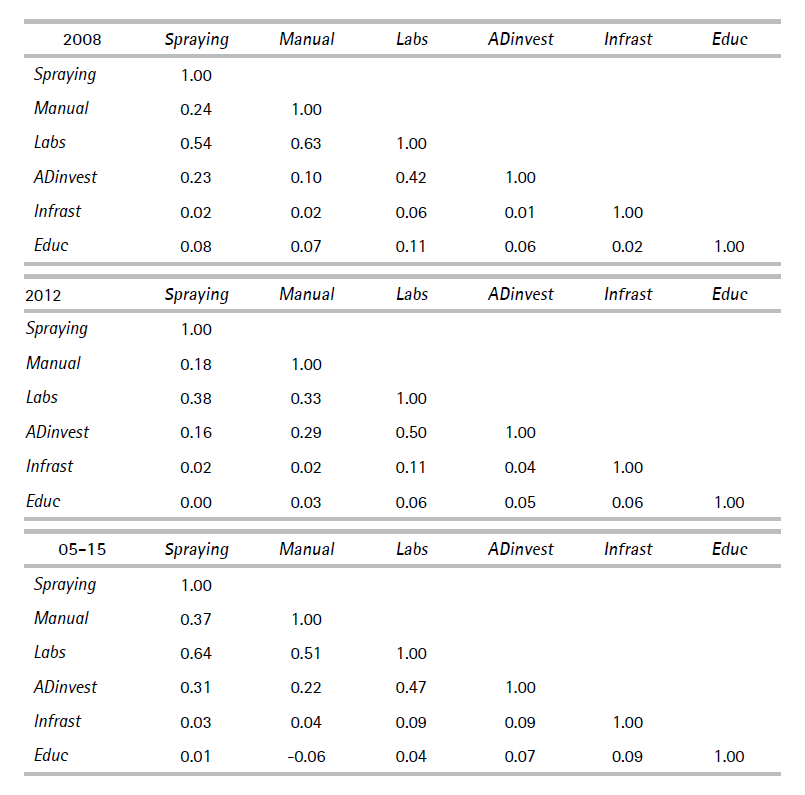
The highest correlation in the three matrices of Table 2 occurs between Labs and the FE and AD variables, meaning that municipalities that are subject to higher levels of air-spraying, manual eradication, or alternative development are also more likely to have higher levels of interdiction (destruction of laboratories). A plausible explanation for this is that higher involvement of civil and military authorities in eradication efforts or alternative development activities leads to a higher probability of the detection of laboratories. However, the correlation coefficients between these variables are never above 0.65, and all other coefficients tend to be very low (i.e., no multicollinearity).
IV. Methodology
a. Identification
We start by recognizing a basic endogeneity problem: the intensity of the different policies (whether it’s FE, interdiction, AD, or TT) affects the level of coca cultivation; but in turn, the level of cultivation also determines the intensity of the policies (i.e., a problem of simultaneous equations). Following Davalos (2016), we tackle this issue by using the first difference or change of coca plantations from year to year –instead of the level of coca– as dependent variable, for this change is not likely to affect the intensity of the antinarcotic strategies: how much (i.e., the intensity) of each policy doesn’t depend on how much coca plantations contracted or expanded in a single period (especially if this change is relatively small), but on the absolute level of coca within any given municipality. Thus, municipalities with higher levels of coca experience more intense policy interventions, while municipalities with lower levels of coca experience less intense interventions, regardless of how much coca increased or decreased during that period10. Therefore, the intensity of the above policies is independent from the change in cultivation and is defined exogenously by the absolute levels of coca in each municipality.
This identifying assumption is reinforced by the lagging political and bureaucratic processes and the fixed nature of investments: If, for instance, a municipality with low absolute levels of coca cultivation experiences a sudden surge, the political and bureaucratic process may not lead to automatic increases in eradication or in any other efforts, while the investments to counter the emerging coca plantations (e.g., aerodromes, AD projects, roads, schools, etc.) may not be automatic even if the decision is made. Similarly, in traditionally coca-growing municipalities, even ‘bigger’ changes in coca cultivation (in absolute numbers) may still be proportionally small to call for significant policy intensity changes in those municipalities, also given the relatively fixed nature of investments (e.g., once AD projects are established, investments continue to flow as part of the long-run commitments of AD; the same could be said of infrastructure and other public projects).
Finally, the intensity of the policies may also be conditioned by certain idiosyncratic characteristics of the municipalities that give rise to cross-sectional variation (Table 1), such as their unique geographical conditions (e.g., difficult terrain that constrains the access of crop dusters or manual eradication squads); the social tolerance or resistance towards certain policies, and the level of social organization (e.g., the presence of coca grower unions opposing forced eradication); the level of corruption (e.g., collusion with the authorities or diversion of resources); among others. These and other unobserved factors may also affect the change of coca directly (e.g., a temperate weather or a culture more tolerant of crime that allows for a quicker expansion of the crop, etc.), and so they are included as fixed effects in the regression11.
b. Estimation
We use the sample of 291 municipalities with coca –that had some net positive level of coca cultivation– from 2005 to 2015. Following Davalos (2016), we define the dependent variable as the first difference of coca cultivation (i.e., the change of net coca cultivation from year to year in each municipality), as follows:
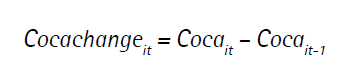
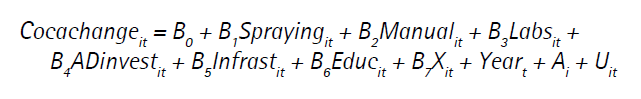
In which Cocait is the number of coca hectares present in the i’th municipality at time t, and Cocait-1 is the number of coca hectares present in the same municipality at time t-112. To determine the effectiveness13 of each individual policy, we arrange a panel data regression model with municipal fixed effects to control for the mentioned unobservable heterogeneity of municipalities; and with time fixed effects, to control for variables that are constant across municipalities but evolve over time, such as macro-factors like inflation, the interest rate, the price of coca, the prices of alternative crops, the price of inputs, etc.14 The econometric model is:
 (1)
(1)
Where Spraying and Manual are the two FE policies; Labs, the number of destroyed laboratories, is the ‘interdiction’ strategy; ADinvest is the investment in AD programs; Infrast and Educ are the two TT components; and X is a vector of control variables containing the rural population, Poprural, the total population, Poptotal, the tax income, Taxincome, and the internal forced displacement, Displace (see table 1). Finally, Year stands for the time fixed effects, A for the municipality fixed effects, and U is the stochastic error term.
We then estimate equation (1) by groups, using the FE variables as the only regressors in model (A), Labs as the only regressor in model (B), ADinvest as the single regressor in model (C), and the set of TT variables in model (D). In model (E), we include the FE, interdiction, AD, and TT variables altogether; and in model (F), we add the full set of controls, X. We expect the coefficients of Spraying, Manual, Labs, ADinvest, Infrast, and Educ to be negative. In the case of the two FE and interdiction variables, negative coefficients are associated with the imposition of costs or penalties, either by the direct destruction of the crops or laboratories, or by deterrence through a higher risk. In the case of the remaining variables, the negative signs are associated to the benefits of participating in AD programs or arising from TT. The results are presented in Table 3.
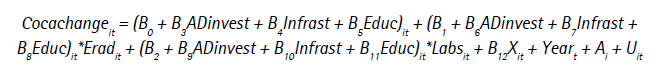
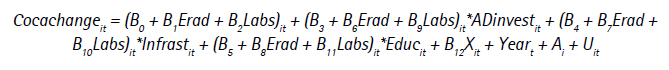
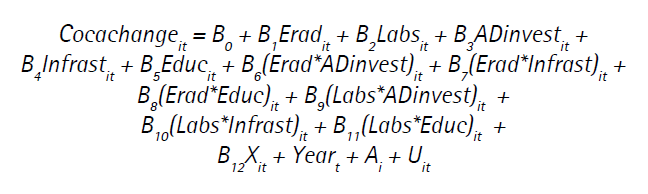
To analyse the relationships between groups of policies, particularly FE and interdiction with AD and TT, we add up (for simplicity) the number of hectares destroyed through air-spraying and manual eradication for each observation to create a new variable, Erad, which represents the total number of hectares destroyed through forced eradication. Then, we introduce the interaction terms of this new variable and interdiction (Labs), on one side, with ADinvest, Infrast, and Educ (the AD and TT variables), on the other. The interactions model is:
 (2)
(2)
However, this equation needs careful interpretation, for the coefficients of the individual variables (B1 through B5 ) now represent the conditional effect of the associated variables when their interacting terms are equal to zero; and the coefficients of the interaction terms (B6 through B11) indicate how much an additional unit of one of the interacted variables reduces or increases the effect of the other interacted variable on the dependent variable15.
While we expect the coefficients of the interaction terms to be negative, indicating a complementarity among the policies (the higher the level of FE or interdiction, the greater –the more negative– the effect of AD and TT on coca cultivation; or equally, the higher the level of AD and TT, the greater the effect of FE and interdiction), we do not expect any of the coefficients of the individual variables to necessarily be negative, although a non-negative coefficient would imply that the corresponding policy is ineffective without its interacting policy.
We estimate equation (2) in three different settings: first, including only the interactions between Erad and the AD and TT variables (model G); second, including only the interactions between Labs and the AD and TT variables (model H); and third, including the full set of interactions (model I). The results are presented in Table 4.
V. Results
Estimating equation (1) yields the results in Table 3. These show that the FE and interdiction variables are the only ones with very significant effects (at the 1% level) across the six models, holding the expected negative signs: in the first place, air-spraying one additional hectare reduces coca plantations, on average, by around 0.06 hectares. This effect is very similar to that found by Mejía et al. (2014), which ranged between 0.02 and 0.065. Second, manually eradicating one additional hectare reduces coca by around 0.16 hectares; and third, also in line with the literature (Mejía, 2016), destroying one additional laboratory (i.e., interdiction) reduces coca crops by 1.7 (models E and F) or by up to 3.4 hectares (model B).
Table 3. Estimations of equation (1) Standard errors in parenthesis. 1%, 5%, and 10% significance levels are marked ***, **, and *, respectively.
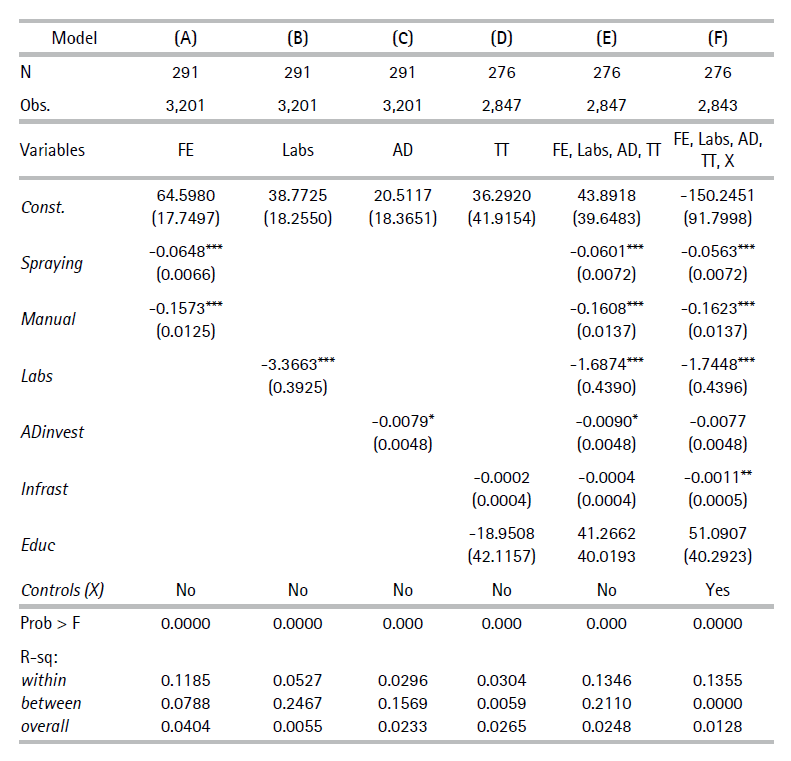
Meanwhile, AD investment is only significant in models (C) and (E) at the 10% level, but is not significant when the control variables are included (model F); however, it holds the expected negative sign throughout: on average, an additional $1 million pesos (around US$300)16 of AD investment reduces coca cultivation by less than 0.01 hectares. This is lower than the 0.169-hectare reduction effect (per US$1,000) found by Tabares & Rosales (2005), and in contrast with Davalos (2016) who finds no significant effect at all. As for the TT variables, only infrastructure has a significant effect (at the 5% level) in model (F), reducing coca plantations by roughly 0.001 hectares for each additional $1 million spent (US$300). Lastly, none of the control variables are significant.
To put things in monetary terms, Mejía (2016) states that the cost of spraying one hectare of coca is of about US$2,400 (or around US$2,600 today). According to his calculations, with an average coefficient of -0.042, around 23.81 hectares must be sprayed to eliminate one hectare of coca, summing up to nearly US$62,000 (using current values). According to our higher coefficient (in absolute value) of -0.06, around 16.7 hectares need to be sprayed to eradicate one hectare of coca, for a total of almost US$43,420. As for AD, using a coefficient of -0.009, it takes approximately $111.1 million pesos to reduce coca cultivation by one hectare (or roughly US$33,333), less than the cost of air-spraying; and as for infrastructure (the only significant variable of TT), this requires slightly less than 910 million pesos (nearly US$273,000). Hence, the costs of AD are lower than those of aerial fumigation, and both are much more cost-effective than infrastructure. Unfortunately, we do not have figures of costs for either manual eradication or interdiction efforts.
As we are interested in unveiling the complementarities, if any, among the different groups of policies, we now estimate the interactions model of equation (2) in its three different settings (models G, H, and I). All contain the vector of control variables, although the results are not sensitive to their inclusion. The estimation results are presented in Table 4.
The results are compelling: all the coefficients of the interaction terms in models (G) and (H), located in the bottom half of the table, are significant at the 1% or 5% level and hold the expected negative sign, meaning that there are strong complementarities between the military components (FE and Interdiction) and the non-military components (AD and TT) of Plan and Paz Colombia. Concretely, the higher the level of FE and interdiction, the greater (the more negative) the effect of AD and TT on coca cultivation; or equivalently, the higher the level of AD and TT, the greater the negative effect of FE and interdiction. Although in model (I) only the interactions between eradication and the TT components are significant (at the 1% level), all of them retain the negative sign.
Table 4. Estimations of equation (2) Standard errors in parenthesis. 1%, 5%, and 10% significance levels are marked ***, **, and *, respectively.
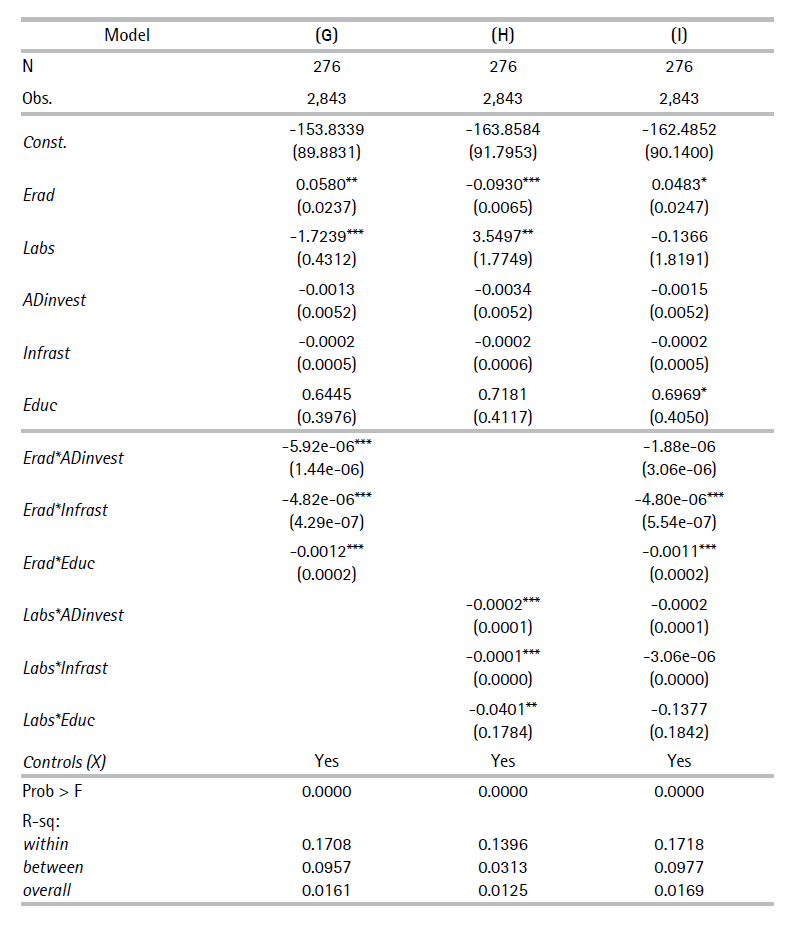
For a precise interpretation of the coefficients in Table 4, remember (from footnote 11) that the slope with respect to Erad is (B1 + B6 ADinvest + B7 Infrast + B8 Educ)it. With the point estimates of model (G), for instance, it becomes, approximately, (0.06 – 6e-06*ADinvest – 5e-06*Infrast - 0.0012*Educ)it. Hence, when all three policies within the parenthesis are equal to zero, the effect of eradication on coca cultivation is B1, or 0.06, which is positive and significant at the 5% level (i.e., in the absence of AD and TT, eradication is associated with an expansion of coca crops). However, the slope with respect to eradication decreases by 6e-06 for every $1 million pesos of AD investment. In other words, the forced eradication of one additional hectare reduces coca cultivation by 6e-06 additional hectares for each million pesos of AD. Likewise, the forced eradication of one additional hectare reduces coca cultivation by 5e-06 additional hectares for each million pesos of infrastructure; and by 0.0012 additional hectares for each percentage point increase of the school enrolment rate17. Eventually, at some minimum levels of each policy, the slope becomes negative (e.g., even with zero levels of AD and infrastructure, a school enrolment rate above 50% is sufficient); and at average levels (see table 1), the slope becomes -0.1040.
In parallel, taking model (H) as a reference, the estimated slope with respect to Labs is (3.55 - 0.0002*ADinvest - 0.0001*Infrast – 0.04*Educ)it. In the same way as before, when all three policies within the parenthesis are equal to zero, the effect of interdiction (Labs) on coca cultivation is B2 , or 3.55, which is again positive and also significant at the 5% level (is associated with an expansion of coca crops). However, the slope with respect to interdiction decreases by 0.0002 for every ($1 million pesos) unit of AD investment, by 0.0001 for every ($1 million pesos) unit of infrastructure, and by 0.04 for every percentage point increase in the education rate. Again, some minimum levels of each policy are required to make the slope negative, and at average levels, it is equal to -1.2409.
Note that the coefficients of Labs in model (G) and Erad in model (H), where these variables are not interacted, remain significant with a negative sign, and are interpreted as usual (like in table 3). However, the coefficients of ADinvest, Infrast, and Educ, which form part of the interaction terms, are not significant in any of the three models (except for Educ in model [I], which is positive and significant at the 10% level), implying that in the absence of eradication and interdiction (i.e., when Erad and Labs are equal to zero), these policies are ineffective. All of which points not only to a complementarity among policies, but also to a dependence of FE and interdiction on AD and TT, and viceversa.
Finally, with regards to the control variables (not reported in Table 4), only the coefficients of rural population (Poprural) and internal forced displacement (Displaced) are significant at the 5-10% and 1% level, respectively, with a positive sign, throughout the three models. In the first case, rural population is expected to be positively associated with a labour-intensive agricultural activity; in the second, the result is in line with our earlier reflections (in Section III) about the role of illegal armed groups in the demand and supply of coca.
VI. Conclusions
For over two decades, Colombia has fought a war on drugs under Plan Colombia, based on forced eradication (FE), interdiction, and alternative development (AD). More recently, since the signing of the peace agreement with the FARC, a new approach based on a series of territorial transformations (TT) has been implemented under ‘Paz Colombia’. In this paper, we estimated the effectiveness of these groups of strategies and their interactions, using a panel data regression model at municipal level with cross-sectional and time-fixed effects during the 2005-2015 period.
Our results suggest that air-spraying and manually eradicating one additional hectare (the two components of FE) reduce coca plantations by around 0.06 and 0.17 hectares, respectively; while destroying one additional laboratory (‘interdiction’) reduces them by 1.7, or even up to 3.4 hectares. As for AD investment, an additional $1 million pesos (some US$300) reduces coca cultivation by less than 0.01 hectares, while an additional $1 million pesos of infrastructure (one of the two TT components) reduces them by roughly 0.001 hectares (although both effects are not always statistically significant). Education –the other TT component– is not significant in any of the regressions. Using these coefficients, we estimate the cost of eliminating one hectare of coca through air-spraying at nearly US$43,420, in comparison to the US$33,333 needed through AD, or the US$273,000 through infrastructure. Unfortunately, the costs of manual eradication or interdiction are not available to us.
Furthermore, our results reveal that besides being complementary, the military and non-military components of Plan and Paz Colombia are also dependent on each other, to the point that if carried out without investments in AD and TT, FE and interdiction actually result in an expansion of coca crops, while AD and TT are completely ineffective in the absence of these deterrent mechanisms. These results are in line with an economics of crime approach, whereby the decision to grow coca depends on both the costs imposed by FE and interdiction (either by the direct destruction of the crops and laboratories, or by an increased risk of having them destroyed –a deterrence mechanism–), which reduce the expected value of coca; and on the benefits arising from AD and TT, which increase the expected value of alternative activities. Moreover, peasants who lose their illicit crops to eradication or interdiction and find no viable economic alternative may resort to growing coca again (in fact, replanting rates after eradication have been reported to be as high as 90% [CRISIS, 2021]), or to grow coca more intensively or extensively to compensate for the risk (Moreno-Sanchez et al., 2003; Robledo, 2015). Here, a moral hazard problem arises in AD and TT whereby beneficiaries may find it profitable to ‘cheat’ and use the investments (e.g., subsidies, bridges, roads, health, etc.) to continue growing coca far from the sight of the authorities if no significant penalties are imposed on them. This is especially likely where monitoring activities are difficult, either because illegal armed groups restrict access to the areas that need to be checked, or because cultivators move their crops (or labor) to different plots that are not subject to verification, as some anecdotal evidence suggests (CRISIS, 2021).
The above conclusions, however, should not obscure the intrinsic problems of FE and interdiction, such as the health and environmental issues associated with the use of glyphosate, the low cost-effectiveness of aerial fumigation, the life-threatening risks of carrying out manual eradication campaigns, the difficulty of detecting processing infrastructure, or the resistance of the local communities. Nevertheless, they highlight the central role of these military strategies as dissuasive mechanisms through the imposition of costs that are complementary to the incentives provided by AD and TT. Moreover, as explained earlier, these latter policies may be totally dependent on both FE and interdiction (and viceversa). This raises an interesting reflection, as this interdependence means that non-military policies fail to completely substitute past ‘war on drugs’ methods, as often proposed in the concurrent debate, which is a major drawback of Paz Colombia’s new approach.
Strictly speaking, the above is not necessarily implying an intensification of (or a return to, in the case of air-spraying) traditional war on drugs methods either, even if these are carried out in combination with alternative approaches. Indeed, effective punishment or deterrence mechanisms are not exclusively military in nature; rather, they can be embedded in the institutional design of those alternative non-coercive strategies. A clear example is that provided by the previously cited work of Muñoz-Mora et al. (2018), who find that land titling serves as a deterrence mechanism by which both the land value and, hence, its expropriation cost (as a penalty for growing coca), are increased. Thus, in essence, what this work is advocating for is the imposition of costs and penalties, in combination with benefits and incentives, instead of a return to particular (and problematic or non-cost-effective) measures such as air fumigation. Whatever direction the policy against illicit crops in Colombia should follow, the key take-away from this analysis is that it must be subject to both the ‘carrot’ and the ‘stick’.