


Servicios Personalizados
Revista
Articulo
 Inglés (pdf)
 Articulo en XML
 Referencias del artículo
 Enviar articulo por email
Indicadores
-
 Citado por SciELO
 -
 Accesos
Links relacionados
-
 Citado por Google
 -
 Similares en
SciELO
Similares en
SciELO -
 Similares en Google
Compartir

 Permalink
Ensayos sobre POLÍTICA ECONÓMICA
versión impresa ISSN 0120-4483
Ens. polit. econ. v.25 n.55 Bogotá jul./dic. 2007
El salario mínimo en Colombia 1984 -2001: Inequidad, Desempleo y Pobreza
The Minimum Wage in Colombia 1984 -2001:Favoring the Middle Class with a Bite on the Poor
Carlos A. Arango - Angélica Pachón
Este trabajo fue financiado por el Banco de la República y el Banco Mundial. Los resultados y opiniones son responsabilidad de los autores y su contenido no compromete ni al Banco de la República ni al Banco Mundial. Se agradecen los comentarios y sugerencias de Leonardo Villar, Wendy Cunningham, Carlos E. Posada y Luis E. Arango. Así mismo, se agradecen los comentarios de los participantes a los seminarios de Economia en la Universidad de los Andes y en la conferencia de la Asociación de Economía de América Latina y el Caribe (Adealc) llevada a cabo en San José, Costa Rica, en noviembre de 2004.
Los autores pertenecen respectivamente al Banco de Canadá y a la Universidad de Warwick
Correo electrónico: carango@bankofcanada.ca; angelic_p2@hotmail.com
Documento recibido el 17 de mayo de 2007; versión final aceptada el 4 de octubre de 2007.
This research was sponsored by Banco de la República (The Colombian Central Bank) and The World Bank. The opinions expressed here are those of the authors and not of the Colombian Central Bank board or the World Bank. We thank Wendy Cunningham, Leonardo Villar, Carlos E. Posada, and Luis E. Arango for their valuable comments. We also thank participants at the Economics Workshops at Universidad de los Andes and at the 9th annual meetings of the Latin American and Caribbean Economic Association (LACEA) San José, Costa Rica, November 2004.
The authors belong to Bank of Canada and University of Warwick.
E-mails: carango@ bankofcanada.ca; angelic_p2@hotmail.com
Document received 17 May 2007; final version accepted 4 October 2007.
En este documento se estudia el impacto del salario mínimo sobre la distribución del ingreso y la situación económica de las familias más pobres en Colombia. Aprovechando la larga historia del salario mínimo en Colombia, el estudio evalúa tanto su efectividad para aliviar las condiciones económicas de los más pobres, como sus efectos sobre la situación laboral de los diferentes miembros del hogar. Los resultados muestran un efecto negativo significativo del salario mínimo sobre la probabilidad de estar empleado y sobre las horas trabajadas para los miembros cabeza de familia; siendo más marcado para las mujeres, los jóvenes y los menos educados. Con respecto a los miembros que no son cabeza de familia, se encuentra que incrementos en el salario mínimo generan un aumento signifi cativo en la participación laboral, una reducción en las horas trabajadas, y un aumento en la probabilidad de estar desempleado. Aún más relevante, los resultados sugieren un efecto regresivo del salario mínimo, ya que se encuentra una mejora signifi cativa en la situación económica de las familias en la parte media de la distribución de ingresos, al tiempo que un deterioro en la situación de las familias más pobres.
Clasificación JEL: O15, 017, J31, J42, J48.
Palabras clave: salario mínimo, desempleo, desigualdad del ingreso, pobreza.
This paper exploits the long history of the minimum wage in Colombia in order to see whether it has im-proved the living conditions of low income families and reduced income inequality. This paper also explores how the minimum wage may have distorted market outcomes in the process. We find significant negative minimum wage effects on both the likeli-hood of being employed and hours worked among household heads. The negative effect is strongest for women, the young and less educated people. For non-head household members, we fi nd that a rise in the minimum wage signifi cantly increases labor participation, reduces hours worked, and increases the likelihood of being unemployed. Most impor-tantly, we find evidence that the minimum wage ends up being regressive, improving the living con-ditions of families in the middle and the upper parts of the income distribution but causing net losses for those at the bottom.
JEL classification: O15, 017, J31, J42, J48.
Keywords: minimum wage, income distribution, income inequality, poverty alleviation.
I. INTRODUCTION
The Colombian economy, as well as many others in Latin America, is characterized by relatively high rates of unemployment. a signifi cant informal sector,1. and sub-stantial levels of poverty and inequality. As a response, important reforms have been brought forward to make the labor market more flexible and to provide new tools for social protection without tampering the efficiency brought about by market forces. One institution that seems to survive these trends is the minimum wage, in spite of its reputation as ineffective in helping the working poor.
Much of the empirical work on the minimum wage has focused on its impact on unemployment, however, little work has been done to assess its distributional properties. As Freeman (1996) puts it Minimum wage is not a panacea to poverty and low wages. It does not, in general, increase national output or the rate of growth. It redistributes income. This paper explores how minimum wages impact the distribution of income, in particular the living conditions of the poor, and how it distorts market outcomes to do so.
The justification for minimum wage regulation mostly comes from the intention to provide income support to the poor. In many developing countries, unskilled wages are a higher proportion of income of poor urban people than in developed countries where the poor are more likely to benefi t from social income (Lustig and McLeod, 1997). Thus, the minimum wage may have a relatively bigger impact in developing economies and may help lifting low income families out of poverty.
However, minimum wage laws are routinely used in countries with very different economic and social situation (Shaheed, 1994). In developing countries, minimum wage laws generally apply to a small formal sector and compliance is usually difficult to implement. In spite of these pitfalls, many Latin American studies have found that the minimum wage has a strong spill-over effect, affecting the whole wage distribution, not just those wages around the minimum wage. The potential of minimum wages to shape the wage distribution is particularly marked in the Colombian case where there is a clear cliffin the wage density at the minimum wage, shifting part of the mass below it towards higher labor incomes. However, there is also evidence of significant unemployment effects (Maloney and Núñez, 2003, and Neri, Gonzaga and Camargo, 2000).
Attempts have being made to put together employment losses and income gains in order to assess the net contribution of the minimum wage as an instrument to fi ght poverty. Most of this work has been based on simulations (Brown, 1996); although recently an alternative approach has been taken which looks at family incomes and poverty. This approach has the advantage of unifying both effects, bringing out the net effect of minimum wages in improving the living conditions of low income families.
We take advantage of the long history of the minimum wage as an institution in the Colombian labor market by looking at the period 1984-2001 which has witnessed signifi cant changes in the minimum wage.2. We model the effect of the minimum wage on the distribution of per-capita family incomes (measured in income per family member) across the seven largest Colombian cities and over time. We fi nd a posi-tive effect of the minimum wage on family incomes, although it is signifi cant only for households above the 20th percentile of the family income distribution. More importantly, the likelihood of being at the bottom of the distribution increases with raises in the minimum wage. The asymmetric effect of the minimum wage along the distribution of family incomes generates an important distributive effect, widening the distance between those families at the bottom of the distribution relative to the median income family.
The negative effect at the bottom of the distribution of the family percapita incomes is backed up by evidence of a signifi cant negative effect of the minimum wage in the likelihood of the household head being employed and in his/her hours worked; being signifi cantly higher for women, and the young and less educated people. Likewise, non-head members see their hours worked reduced and their unemployment and participation rates increased with increases in the minimum wage.
At the individual level, as expected, the minimum wage has a strong effect around the minimum but no effect for those individuals below the 35th percentile of the individual income distribution. We also fi nd evidence of a positive spill-over effect in the upper part of the distribution that monotonically decreases toward the top.
These results confirm the predictions derived by a model of a labor market segmented by the minimum wage. Although a rise in the minimum wage increases the chances of being unemployed, it reallocates workers between the formal and informal sectors. allowing some cushion against job losses. Furthermore, it induces higher participation at the household level. The evidence suggests that increases in the minimum wage end up hurting the living standards of the poor in the Colombian case, although lifting the income of families in the middle and upper part of the distribution.
This paper is divided into six sections including this introduction. Section II discusses the distributional effects of minimum wages and reviews the evidence regarding the potential distributional and poverty alleviation gains that minimum wages may induce. Section III describes the data. Sections IV and V provide the results on the effects of the minimum wage on household unemployment, participation, and in-come. Concluding remarks end the paper.
II. REDISTRIBUTIVE EFFECTS OF MINIMUM WAGES
Freeman (1996) argues that the redistributive effects of a minimum wage depend on the labor market and redistributive system in which it operates, on the level of the minimum and its enforcement. At best, an effective minimum wage will shift the earnings distribution in favor of the lowpaid [ ] at worst, minimum wages reduce the share of earnings going to the low-paid by displacing many from employment.
Theory leads to no clear predictions as to the effect of the minimum wage on poverty. In the neoclassical model, the minimum wage works as a wage floor. The em-ployment level is defi ned by the amount of labor fi rms wish to hire at the minimum wage, which is lower than the employment that would be demanded at the lower competitive wage. This model predicts an increase in the total income of the working poor as long as the demand for labor is suffi ciently inelastic. That is, if the income losses associated with the layoffs are more than offset by the income gains of those whose wages rise with the minimum wage.
When a covered and an uncovered sector coexist,3 the effect of the minimum wage becomes cumbersome. As Fields (1994) showed, increases in the minimum wage reduce employment in the covered sector. Workers loosing their jobs in this sector will either work in the uncovered sector or drop out of the labor force as discourage workers, pursuing some non-work alternatives such as school, or unpaid work, depending on their reservation wage. As some of them will still search for a job in the uncovered sector, the equilibrium wage will fall and therefore the employment level will rise in this sector. The final effect will depend on the elasticity of the labor demand in the covered sector, the elasticity in the uncovered sector and the size of the minimum wage rise (see also Agénor and Aizenman, 1999).
There is however a large body of work that looks at positive effects of the minimum wage on unemployment. One possibility is the case of monopsony fi rms with some market power in the labor market which are price takers in the product market. In this case, fi rms face higher marginal labor costs as they increase their demand, i.e. they face an upper sloping marginal cost of labor. The minimum wage flattens out this curve making it profi table to increase employment as fi rms no longer have to offer higher wages to attract extra workers. However, the partial equilibrium mon-opsony model does not consider that profi ts must be lower with the minimum wage, rendering some fi rms unprofi table, offsetting the expansionary effect.
A model that closely mimics the predictions of the monopsony model is based on efficiency wage theory. The upper sloping marginal cost curve is derived from a monitoring technology which makes it more difficult to control individuals in the firm as the payroll increases. As a result, the firm uses efficiency wages to induce voluntary effort. Therefore, the introduction of a minimum wage might induce an increase in productivity (less monitoring) which will shift the demand upward and increase the equilibrium level of employment.4
Firms can also adjust to minimum wage increases by making conditions harder for workers with marginal productivities below the minimum wage without necessarily fi ring them. They could also offset the effect of the minimum wage by reducing nonwage compensation (Fraja, 1999). Firms may also avoid paying the minimum wage, as well as other nonwage compulsory contributions, by covering the labor relation-ship under outsourcing contracts or by operating in the informal sector. The extent of non-compliance practices may contradict the objective of equality and fairness of the minimum wage. As documented by several studies, most governments appear not to enforce strict compliance with minimum wages (Gindling and Terrell, 1995).
Although the direction of the unemployment effect becomes an empirical question, minimum wages unambiguously increase the income of those workers whose contracts are pegged to it. However, its effectiveness in fi ghting poverty depends on who are the recipients of the income bust. If the increases are concentrated in secondary earners belonging to families above the poverty line the minimum wage weakens as a distributional tool. Also, in most countries the lowest-income families usually will not have members whose incomes are tied to the minimum wage so it will be a poor instrument targeting the well being of those families.
The income effect will depend also on spill-over effects of the minimum wage in the covered and the uncovered sector wage distributions. In Latin America, it has been found that the minimum wage has a strong spill-over effect, affecting the whole wage distribution, not just those wages around the minimum wage. Furthermore, it not only changes the distribution of wages in the formal sector but also those of the informal sector, acting as a numerary in labor contracts (Maloney and Núñez, 2003, and Neri, Gonzaga and Camargo, 2000).5
As there may be many offsetting effects of the minimum wage at the individual level, making it hard to estimate its net effect, it makes sense to move away from individuals and look at family incomes to test the overall impact of minimum wages. We would expect that increases in the minimum wage might improve the well being of low income families if the unemployment effect of the minimum wage is small. The following are the main forces that determine the net effect of minimum wages in family incomes:
- Some household members will loose their job in the covered sector ending up unemployed with zero contribution to the family income.
- Some workers previously employed in the covered sector might fi nd a job in the uncovered sector and suffer an income loss, depending on wage differentials between sectors and spill-over effects.
- Some workers who keep their jobs in the covered sector may experience gains in their wages due to raises in the minimum wage. Again, the magnitude of this effect on family incomes will depend on whether there is a spill-over effect.
- On the supply side, some unemployed members may have longer unemployment spells as the reservation wage increases. while others will be encourage to enter the labor force either to compensate job losses by a family member or attracted by higher returns (Basu. Genicot, and Stiglitz, 1999 and Teulings, 2000).
A. EVIDENCE ON THE REDISTRIBUTIVE EFFECTS OF MINIMUM WAGES
Although there are many studies that try to estimate the employment effects of minimum wages, only few have looked at their distributional effects. A survey by Brown (1996) identifies just a handful of papers dedicated to the later. Most of the empirical work that tries to identify the distributional effects of minimum wages fi nds that it is not very effective in helping low-income families (Newmark et al., 1997 and 1998). This result holds in part because many of the minimum-wage-paid workers belong to families that are far above the poverty line (Burhhauser, Couch and Wittenburg, 1996).
The empirical work in Latin America looks at distributional and employment effects separately. Freeman-Castillo and Freeman (1991) fi nd strong employment effects in Puerto Rico after introducing the US minimum wage legislation. Bell (1997) also fi nds large minimum wage elasticities of employment for workers paid near the minimum in the case of Colombia and Mexico using panel data on manufacturing firms. These results are confirm by Maloney and Núñez (2003) who, in the Colombian case, find a signifi cant positive relationship between increases in the minimum wage and the likelihood of becoming unemployed; relationship that abates for those workers earning relatively higher wages.
On the other hand, Maloney and Núñez (2003) as well as Neri, Gonzaga and Camargo (2000) find, in the Colombian and Brazilian cases respectively, strong positive income effects of changes in the minimum wage over the entire distribution of salaried workers, with the greatest effect occurring below the minimum wage, showing important spill over effects on the wage distribution.
As for the relation between poverty and the minimum wage, the available empirical evidence for Latin America is mixed. Morely (1995) finds that poverty falls with a rise in the minimum wage but only for periods of recovery, whereas De Janvry and Sadolet (1996) fi nd minimum wage poverty alleviation in periods of recession. Using world wide LDC data, Lustig and McLeod (1997) confi rm a negative effect on poverty although with a signifi cant negative effect on employment.
More recently, in a country panel for developing economies, Saget (2001) fi nds that for a constant level of GDP per-capita and average wage, and controlling for location, a higher minimum wage is associated with a lower national level of poverty and concludes that the data analysis gives strong support to the proposition that the minimum wage may bring positive results in poverty alleviation by improving the living conditions of workers and their families while having no negative results on employment.
In Colombia the law defi nes the minimum wage as the right of a worker to earn enough to cover not only his basic material, moral and cultural needs but also the needs of his family. Such institution was introduced in 1955 and has been updated following different criteria such us inflation, productivity, and GDP growth, through a bargaining process between government, unions and fi rms. Its legislature has changed considerably with minimum wages varying by rural and urban sectors, and also by fi rm size. Since 1984 it was unifi ed as a national wage floor. Most of the studies for Colombia have focused on the relationship between minimum wages, inflation and employment. Few of them have looked at distributional issues (Vélez and Santamaría, 1999; Hernández and Lasso, 1999; Maloney and Núñez, 2001). Our work goes one step further by considering not only the wage and employment effects of minimum wages, but also the net effect on the living standards of low-income families.
III. THE DATA
We use quarterly data from the National household surveys (Encuesta nacional de hogares) for the period 1984-2001. The survey covers the 7 largest cities: Bogotá, Medellín, Cali, Barranquilla, Pasto, Bucaramanga and Manizales, and has about 20,000 households per quarter.
We focus on information at the household level. We exclude domestic workers and boarders as part of the family and only consider family members and relatives. As mentioned by Newmark et al. (2006) this might lead to a sample selection bias since a domestic workers family living in the household of an employer will not be included in the sample.
We take per-capita income defined as the total family earnings divided by all family members whether or not they have any income. We use per-capita income based on all labor earnings including those of self-employed individuals. This is a limitation in the results presented since changes in minimum wages might produce changes in public and private transfer payments to the family due to changes in employment, hours and earnings.6
As for poverty measures, we take the poverty line calculated by the Departamento Nacional de Planeación (the Colombian National Planning Department). This measure is estimated by city although it does not control for equivalence scales depending on number of individuals and their ages. This might be a problem in case the minimum wage changes the structure of the family over time.7
The period 1984-2001 has been chosen since it is marked by strong movements in the minimum wage (Graph 1); including a long downward trend starting in the 80s, which reverts during the second half of the 90s.
Most of the work is based on cross section data at the family level. The sample includes 900,000 households and excludes families with any employed member reporting missing earnings, and families with no members participating either as employed or unemployed.
A. WHO EARNS MINIMUM WAGES IN COLOMBIA?
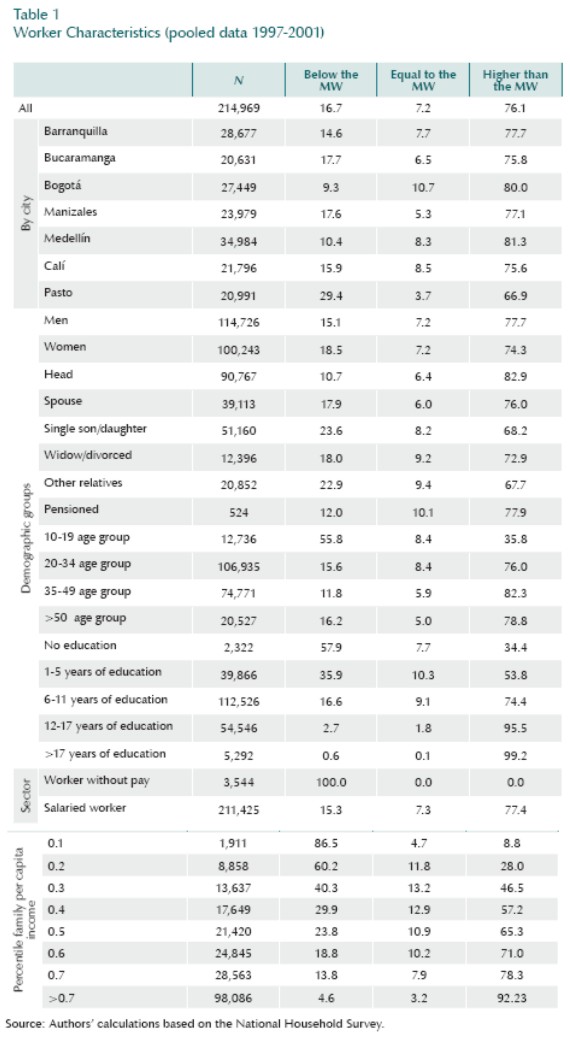
Table 1 shows that 16.7 % of workers, working between 30 and 50 hours per week, earn less than the minimum wage and 7.2 % earn exactly the minimum wage.8Bogotá and Medellín are the cities with relatively higher wages, with less than 11% of workers earning below the minimum wage and they also have a higher proportion of individuals earning exactly the minimum. As expected, young non-head workers with none to middle education are the ones with a higher percentage earning the minimum. These groups, together with women, are also more likely to earn wages under the minimum wage. In contrast, household heads, older workers, and individuals with higher education tend to have earnings above the minimum wage. Finally, we fi nd that among the workers belonging to families in the lower tail of the family per-capita income distribution, more than 40% earn below the minimum wage and have higher percentage working at a minimum compared with families up in the distribution.
At the household level, Table 2 divides families into poor and non-poor based on the poverty line and half the poverty line. Poor families tend to be those with house-hold heads with low education, earning less than the minimum, many with self-employed household heads, with a bigger family size, and a lower number of employed members.
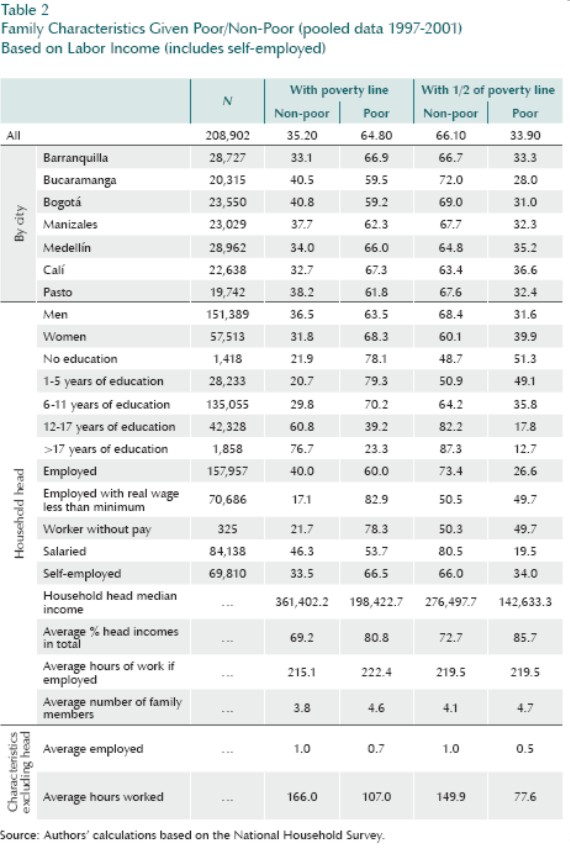
The fact that 70% of workers living in poor households earn the minimum wage or less shows an important room for the minimum wage to alter the relative living con-ditions of low income families. However, note that household heads in poor families are over represented by individuals working in the self-employment sector, which limits the impact of the minimum wage.
B. IDENTIFYING THE MINIMUM WAGE EFFECT
As Graph 1 shows, the minimum wage decreases during most of the 80s and early 90s, suggesting an easing of the minimum wage constraint in the labor market that was reverted toward the end of the 90s. During the same period income inequality both at the family and the individual level (Graph 2) shows a slightly declining trend between 1984 and 1995. after which inequality seems to worsen, showing a final stable but higher level at the end of the 90s. Hence, one could argue that lower rather than higher levels of minimum wages reduce income inequality.
Nevertheless, as Graph 3 shows, the fraction of individuals earning the minimum increases almost continuously between 1984 and 1995, year in which this fraction drops to the level of the 80s and remains like that for the rest of the decade.9 In particular, the accelerated increase during the first part of the 90s coincides with the strong growth in the construction sector which may partially account for this trend.10 Therefore, it is hard to assess, from simple inspection, the relation between the minimum wage and inequality.
Neumark et al. (2006) suggests a way to capture the minimum wage effect by looking at the fraction of workers that most probably will hold a contract associated with the new minimum wage. This group is, ideally, composed by those whose wage is between the old and the new minimum wage, so they are the ones for whom an increase in the minimum wage should also lead to an increase in their wages.11 We calculate the fraction of workers between the current real minimum wage and the minimum wage 12 months before for each city and quarter, hereafter called the fraction between minimum wages (FBM).12 Graph 4 shows a 7-cities average of this fraction. Negative (positive) values mean a reduction (increase) in the minimum wage bite. The graph shows that the bite has suffered strong changes during the sample period. Furthermore, it also shows that the bite has signifi cant variation between markets as is reflected by the wide range between the minimum and the maximum value of FBM across cities by quarter.
We also used a standard real minimum wage to median income ratio to see the ro-bustness of our estimates. We divide the current minimum wage by the median in-come 12 months before, hereafter the minimum-to-median ratio (MMR).13 Graphs 5 and 6 show the level and the variation of MMR respectively. An increase (reduction) in MMR implies an increase (reduction) in the minimum wage bite. Although FBM and MMR present similar periods of tightness (around the years 1986, 1990, 1993 and 2000), the timing and the intensity are not the same. The advantage of FBM is that it considers both the relative change in the minimum wage and the base of workers potentially affected, whereas MMR only considers the former.
IV. UNEMPLOYMENT AND PARTICIPATION AT THE HOUSEHOLD LEVEL
The minimum wage effects at the household level are the result of offsetting forces: for those with a net gain, the income effect more than offset the nega-tive impact that the minimum wage may have in other labor dimensions such as unemployment and hours worked by its members. Following Newmark et al. (2006) we looked at both household heads and the family group as a whole to explore how their employment and participation status are affected by changes in the minimum wage.
We model different features of labor choices and labor outcomes experienced by the family, controlling for familys human capital and family composition.
For household heads, we look at the probability of being employed (salaried or self-employed), and hours worked. For members other than the household head, hereafter non-head members, we look at hours worked as well as their unemploy-ment and participation rates. The estimations are based on a pooled sample of all cross sections from the quarterly ENH surveys in the period 1984-2001. We model each labor variable yj for the j- household head (or, alternatively, non-head members) as:
where MMR]t, MMRjt_1/4, MMRjt_1/2, MMRjt_1 are the current MMR, the ratio a quarter before, the ratio 6 months before and the ratio a year before. Xjt is a set of individual (family) characteristics. For models based on household heads it includes education, age, gender, and job type (that is, whether they look for salaried of self-employed Jobs). For models based on non-head members, it includes the household level of human capital and the household composition as follows:
for education we take the máximum level of education among the family members above 12 years of age,
for experience we use the máximum age of members participating in the labor forcé,
for gender composition we use the proportion of women among the family members,
for job types we use the proportion of self-employed among members over 12 years of age,
and for age composition we use the proportion of young (between 12 and 22) among family members, as well as the proportion of children.
We also test whether interactions between the MMR and individual (family) characteristics matter, in particular, whether the minimum wage effect changes with the individual (family) human capital, Xjt *MMRjt Finally. Yj, Qj, Cj, in (1) are annual, quarter, and city dummies, which control for common long term and short term ag-gregate economic effects as well as fixed city effects.14
Table 3 shows the results for the household heads likelihood of being employed and hours worked. We estimate a Probit model with Hubert-White (HW) standard errors where yjt in equation (1) is equal to 1 when the worker is employed and zero otherwise. Hours worked, on the other hand, are estimated by HW robust least squares. The table shows that increases in the minimum wage to median income ratio, MMR,15increase the likelihood of a household head being unemployed. the main effect occurring in the first quarter. The interactions of MMR and gender, age, and education are also significant, indicating that the negative effect is larger for women, young, and less educated people. These last fi ndings give robustness to the results given that these groups have a larger proportion of individuals earning around the minimum. Turning to household head hours of work. the table shows that the minimum wage bite reduces the number of hours worked by household heads although the effect differs signifi cantly only by age, being bigger for young individuals.
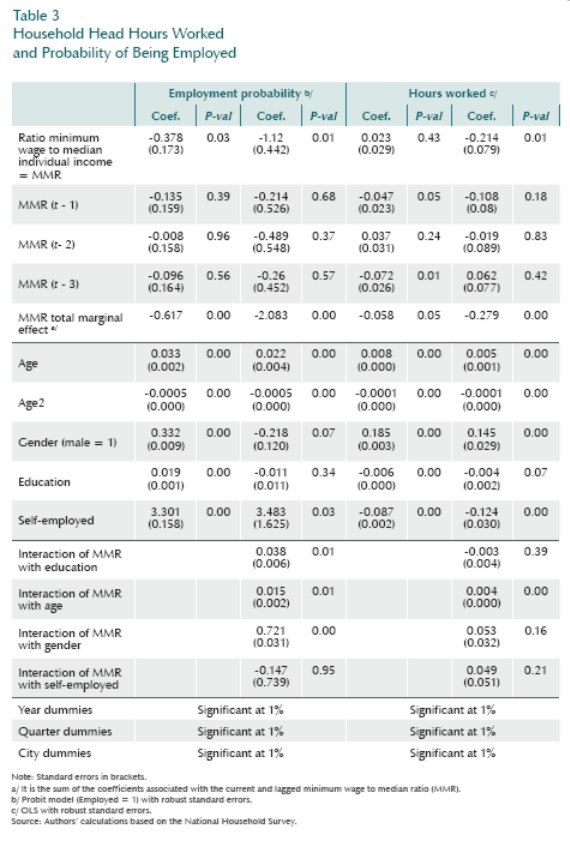
Table 4, on the other hand, looks at the behavior of non-head members. We estimate equation (1) for hours worked by non-head members using HW robust least squares. As for their unemployment and participation rates we estimate binomial models. The binomial household unemployment model is a model of the number of non-head unemployed members giving the number of household members participating in the labor force. The binomial participation model looks at the number of members employed or searching conditional on the number of members above 12 years of age.16
The results in Table 4 show that MMR is inversely related with hours worked by non-head members and positively related with their unemployment and their partici-pation rates. However, t he effect of M MR on the u nemploy ment rate is only significant for non-head members in households with high human capital, as captured by the interaction of MMR and education. Note also that there is a change in the sign of the education coeffi cient once the interaction is included, highlighting the distorting effect of the minimum wage in the non-head members unemployment equation. As for their participation in the labor market, higher MMR increases non head member participation, especially in families with lower human capital as captured by the interaction of MMR and education. Note that there is a large bias in the education coeffi cient when omitting the interaction term.
The finding that the unemployment effect of MMR in non-head members is only signifi cant for families with high human capital is consistent with labor decisions that go beyond the individual and are associated with the family group as a whole. First, as shown before, an increase in the minimum wage produces higher participation rates in families both with low and high human capital; a supply effect. However, the increase in the minimum wage may have asymmetric effects on non-head member employment decisions depending on the household type. Clearly, increases in the minimum wage would increase the reservation wage for every body looking for a job, which should increase the average unemployment spell. However, as we saw in Table 3, the lower the household heads human capital the bigger the negative effect of increases in the minimum wage on his/her probability of being employed. Therefore, it may be the case that those nonhead members living in families with low human capital will search in the informal sector, with short unemployment spells, to offset the familys unemployment shocks produce by changes in the minimum wage. In contrast, those in families with high human capital will be more prone to wait. having longer unemployment spells while queuing for a job in the covered sector.
V. NET INCOME EFFECTS
The negative effect of the minimum wage on employment and its positive effect on the familys participation rate clearly show that in the Colombian case higher minimum wages induce higher unemployment. In this section we test whether the negative employment effects are offset by the income effects that the minimum may have on those that remain employed and on those new comers attracted by higher search payoffs. This is done by looking at the per-capita family income, which will sum up both the zero incomes for the unemployed and the higher incomes induced by the minimum wage for those employed.
We use both proxies, FBM and MMR, to estímate dynamic panel models for each of the different percentiles of the income distribution. We perform a set of estimations both for family per-capita income distributions and for individual income distribu-tions base on annual observations taken from fi rst quarter surveys. For both proxies of the minimum wage bite (MB) we estimate:
Where yjtc is the income at the c'th percentile of the income distribution of city j in year t, (for per-capita family incomes and, alternatively, for individual wages). MBjt is a proxy of the minimum wage bite for each city-year pair, Β. is a city unobserv-able effect and t is a time specifi c effect, invariant across cities.17 in (2) &beta will be the short run effect whereas Β/(1 n) will be the long run effect.
We estimate equation (2) following Anderson and Hsiao (1982) differences estimator but, since we are working with panels characterized by small n (seven cities) and quite large T (16 observations) we followed the strategy suggested by Robertson and Symons (1992). First we test for panel stationary for both the dependent and the independent variables using Hadri and Larsson (2005).18 We reject the nuil of stationary for all the variables used in our estimation. In such cases, Robertson et al. (1992) show that Arellano and Bond (1991) instrumental variables estimator does not work well since lags of the dependent variable in levéis will be no correlated with the lags of the dependent variable in differences. Robertson et al. (1992) suggest using lags of the exogenous variables in differences as instruments, and so we use lags of the minimum wage bite proxies defi ned above.
Table 5 shows percentile estimates based on equation (2) for the per-capita family in-come distributions. It includes short and long run effects as specifi ed in (2). Note that by estimating (2) in differences we get rid of the city effect but not the time effect so we include time dummies. The table shows signifi cant positive effects for percentiles above 25th using FBM on each percentile, both in the short and in the long run, and above 15th using MMR, but not statistically significant effects at the bottom of the distribution. The parameter estimates also suggest an inverted U shape: the gains being close to zero at the bottom of the distribution (percentiles up to the 20th), high-est at the middle (percentiles between 25th and 45th) and lower at the top (percentiles from 50th to 90th) which is coherent with minimum wage earners being relatively more representative in families between the 20th and 50th percentiles (Table 1).
On the other hand, worker labor income percentile regressions are reported in Table 6. Significant effects are found toward the middle of the distribution using FBM. Most of the income gains are concentrated between the 45th and 60th with no signifi cant effects at the bottom and the top. With MMR the gains start at a lower percentile (30th) and are significant all the way up in the distribution, being higher around the middle both in the short and in the long run. However, no signifi cant effect is found for percentiles lower than 25th, although a negative sign is estimated for those at the bottom (10th, 15th).
A. DISTRIBUTIVE EFFECTS ON FAMILY INCOMES
Apparently we would think that from the income estimates presented above, a more binding minimum wage will increase inequality at the lower part of the distributions, increasing the gap between the percentiles below the median, and will reduce inequality at the upper part of the distribution of both families and individuals. Yet, it will not alleviate the situation of those families at the bottom and may worsen workers below the minimum.
However, as we can not tell how different the effects between percentiles are, we can not assess the statistical signifi cance of the distributive effects of the minimum wage. To gauge on this, we estimate the difference between each percentile and the median percentile for family per-capita incomes. Following equation (2) and subtracting ycjt from y0.5jt for any cth percentile of the income distribution we get:
where k is a proportional factor that allows us to rewrite (3) in terms of the lagged difference in the percentile distance. We estímate (3) in the same fashion as (2), using lagged differences in our proxies for the minimum wage bite FBM and MMR as instruments. Equation (3) allows us to test whether Β0.5 Βc ■£■ 0, i.e. whether the effect of the minimum wage bite is signifi cantly different across percentiles.
Table 7 shows the results for the distribution of per-capita family incomes. Neither FBM ñor MMR reflects any changes in distances to the median in the short run (except for an almost significant increase in the distance of the 15th percentile to the median). The results, confi rm how similar the estimates for the short term effect are across percentiles in Table 5. Therefore, if any distributional effect can be attributed to minimum wages, it will be a long run effect associated with differences in the speed of adjustment of each percentile income to shocks, as the long run effects in Table 5 suggest.
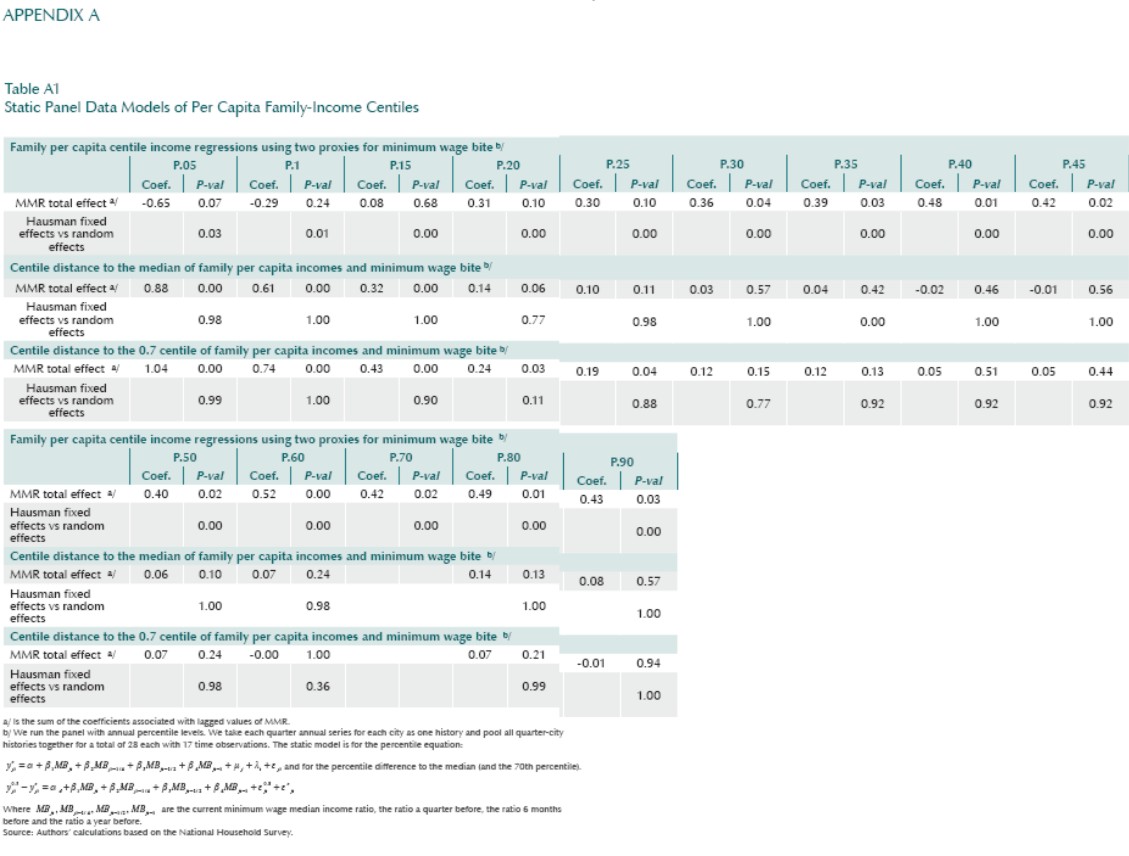
To explore this hypothesis we follow a different econometric strategy by estimating a relationship of the form:
where MMRjt, MMRjt_1/4, MMRjt_1/2, MMRjt_1 are defi ned as in (1). Here the total effect will be the addition of the fii coeffi cients. Equations (4) and (5) are non-dy-namic versions of (2) and (3). We use panel data methods to estimate (4) and (5) and use random effects estimates whenever the Hausman test for consistency is passed (see Appendix A).
For the per-capita family incomes the results are summarized in Graph 7. The continuous portions of the plots show statistically signifi cant minimum wage effects whereas the dotted ones are insignifi cant. The fi rst plot presents the results of equation (4) whereas the second and the third present the results of equation (5). As in Table 5 the minimum wage has a positive long run effect for all percentiles above the 25th, which are quite the same across percentiles, and has no signifi cant, if not a negative effect, at the bottom of the per-capita family income distribution (fi rst plot). Clearly it does not change the shape of the distribution above the 20th percentile (25th for distances to the 70th percentile) since its long run effects on distances to the median (70th percentile) are not signifi cant. However it does increase the gap between the bottom percentiles and the median and the 70th percentiles respectively (second and third plots).
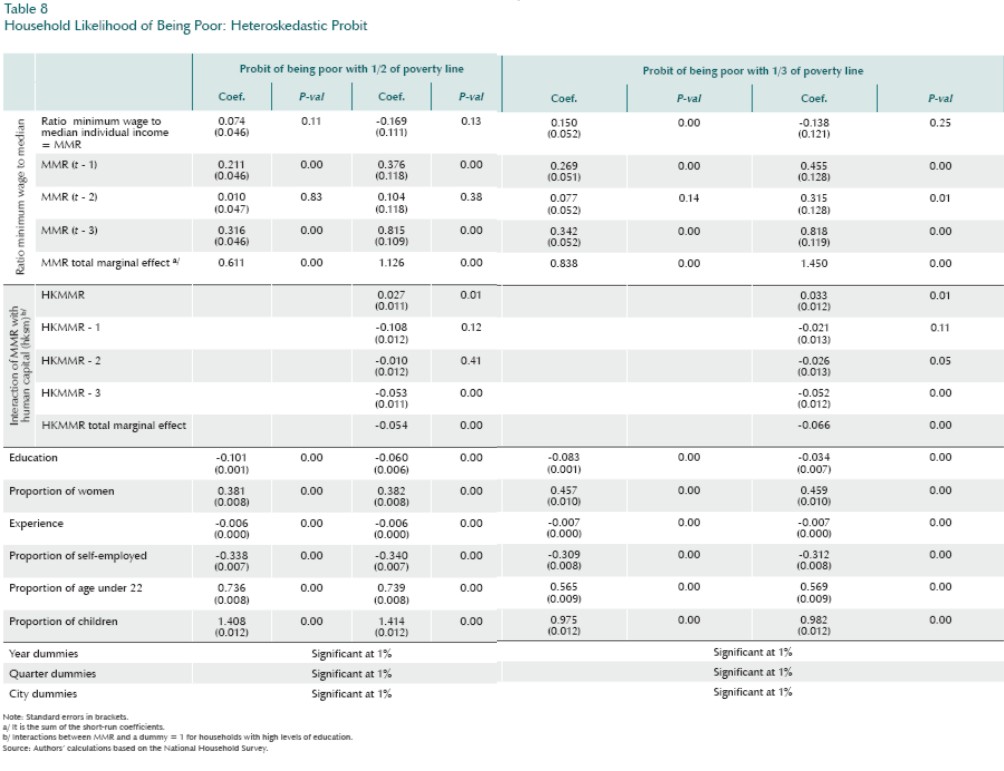
In order to identify how badly the minimum wage may hurt those families at the very bottom of the distribution we look at the likelihood of being poor/non-poor by looking at households with per-capita incomes below half and 1/3 of the poverty line. Here again, we used the pooled sample of all the quarterly surveys for the period 1984-2001 and estimate a Probit model controlling for household human capital and household composition as was discussed in section III. Table 8 shows that an increase in the minimum wage to the median income ratio, MMR,19 raises the likelihood of being poor. All the other variables have the expected sign. Furthermore, the minimum wage effect is significantly smaller for those families with higher human capital.
Summarizing, per-capita income estimates suggest that the minimum-wage increases during the period 1984-2001 produce important asymmetric effects in the household income distribution, bringing important gains for families well above the bottom of the distribution but with signifi cant losses for the working poor.
VI. CONCLUSIONS
In this study we concentrate on evaluating the effects of the minimum wage on the familys well being. We fi nd important gains for families in the middle and the upper part of the distribution of family per-capita incomes but none to signifi cantly negative effects for families at the bottom. This creates important distributive effects, increasing the gap between those at the bottom and those up in the per-capita family distribution.
At the individual level, there is a clear spill over effect with income gains not only for individuals at percentiles close to the minimum but further up in the individual income distribution. However there is no evidence of a farol effect since there are not signifi cant positive effects for individuals at the bottom. Furthermore, there is clear evidence that the minimum wage increases the probability of unemployment especially for low human capital workers. These results show an asymmetric effect which end up deteriorating the situation of the working poor.
Beyond the income effects on households. the minimum wage clearly distorts other dimensions of the familys labor profi le. For families with lower human capital, an increase in the minimum wage increases non-head participation (maybe a third-bread-giver response to negative family income shocks) and does not change their unemployment rate significantly as they may search for a job in the informal sector. In contrast, for families with high human capital the participation effect is much lower with increases in their unemployment rate; probably a higher reservation-wage effect inducing longer unemployment spells while they queue for a job in the formal sector.
COMENTARIOS
1 Although there are many uses of the expression informal sector, the common theme is the evasion by firms of some contractual arrangements that would make them tractable by a regulatory body.
2 As part of future work it is possible to extend this study to include the most recent period. Unfortunately, it was not possible at the time the empirical work was done due to incompatibilities between the old and the new Colombian household survey introduced by changes in the survey methodology starting in 2000. Only recently there have been attempts at reconciling the series (e.g. Arango et al., 2006).
3 An uncovered sector may exist either because the law stipulates so, or because there is no full enforcement of the law and some firms elude the minimum wage operating in the informal sector (see footnote 1).
4 See Card, D. and Krueger, A. B. (1994, 1995a, 1995b), Azam (1992), Deltas (2007) and Robbins et al. (2003) for studies of a positive effect of the minimum wage on employment (the last one in the Colombian case).
5 Azam (1997) suggested the positive effects of minimum wages on employment in wheat production could be explained by savings in hiring costs since the farmer avoids non linear wages and warranty that the individual will survive on it. By doing so the minimum is supported by the community who has the incentive to monitor compliance by other farmers. This might be the reason why a strong spill-over effect has been found in Colombia in the informal sector.
6 We work with hourly earnings and calculate monthly earnings base on hours worked per week. We also looked at monthly earnings as reported in the survey, and compare them with our estimates based on hourly earnings finding no significant differences between them.
7 Incomes, mínimum wages and poverty lines were deflated using the consumer price Índex for each city.
8 We restrict our analysis at the individual level to those workers who work between 30 and 50 hours since we do not have information on the labor contract for those working higher hours per week. Therefore per-hour incomes could be potentially subject to large measurement error.
9 The fraction of workers earning the minimum includes all workers earning wages that do not differ by more than 0.03% of the minimum wage.
10 It could also indícate an inverse relationship between the mínimum wage compliance and ¡ts level.
11 Since their employers were paying them at or above the minimum before, they are likely to pay them at or above the new minimum wage or lay them off.
12 We took real rather than nominal wages since we believe the erosion of the minimum wage within a year due to inflation does relive its binding constraint for contracts spread over the calendar year.
13 If the current median income were used to calculate MMR, the estimate would be affected by the effect of the minimum wage on the current distribution of incomes.
14 Other proxies of household human capital were also tested based on the household heads education and age with no mayor differences with the results presented here.
15 We can not use FBM here since it is a measure of a change in the mínimum wage bite calculated as in footnote 10. Using fractions below the mínimum wage is not a straight forward measure of the mínimum wage bite: a high fraction may indícate a strong bite although it may indícate low compliance as is evident from Table 1.
16 The binomial model depicts the number of successful events, x, in «triáis where 0< x< n . E(x) = np and V(x) = p(1 p)n . In our case, x is the number of family members unemployed and n the number of members participating in the labor forcé (members older than 12).
17 We also introduced interactions of the minimum wage with dummies for first quarter after introducing legislative changes in the minimum wage in all the models estimated in the paper. We find significant positive effects of minimum wage changes in family incomes in most regressions. However, we choose to present a more parsimonious specification to facilitate interpretation. The results do not differ from those presented here.
18 Note that the fraction between the current and the past minimum wage is a change in the minimum wage bite which is the difference in the fractions of workers below the current and the past minimum wage 12 months before. That is, the fraction of individuals whose income 12 months before was below the current minimum wage minus the fraction of them with incomes below the minimum 12 months before. These are the variables that were tested for panel unit roots. The tests are available on request.
19 See note 15.
REFERENCES
1. Agénor, P. R.; Aizenman, J. Macroeconomic Adjustment with Segmented Labor Markets, Journal of Development Economics, vol. 58, no. 2, pp. 277-296, Amsterdam, 1999. [ Links ]
2. Arango L. E.; García, A. F.; Posada, C. E. La metodología de la Encuesta continua de hogares y el empalme de las series del mercado laboral urbano de Colombia, Borradores de Economía, no. 410, Banco de la República, 2006. [ Links ]
3. Arellano, M.; Bond, S. Some Tests of Specifi cation for Panel Data: Monte Carlo Evidence and an Application to Employment Equations, Review of Economic Studies, vol. 58, pp. 277- 297, 1991. [ Links ]
4. Azam, J. P. The Agricultural Minimum Wage and Wheat Production in Morocco (1971-1989), Journal of African Studies, vol. 1, no. 2, pp. 171- 191, Washington, 1992. [ Links ]
5. Azam, J. P. Efficiency Wage and the Family: An Explanation for the Impact of the Agricultural Minimum Wage in Morocco, Kyklos, vol. 50 no. 3, pp. 369-382, Basel, 1997. [ Links ]
6. Anderson, T. W.; Hsiao, C. Formulation and Estimation of Dynamic Models Using Panel Data, Journal of Econometrics, vol. 18, no. 1 pp. 47-82, 1982. [ Links ]
7. Bell, L. A. The Impact of Minimum Wages in Mexico and Colombia, Journal of Labour Economics, vol. 15, no. 3, pp. 103-135, 1997. [ Links ]
8. Basu, K.; Genicot, G.; Stiglitz, J. E. Household Labour Supply, Unemployment, and Minimum Wage, policy working paper no. 2049, World Bank, Washington, 1999. [ Links ]
9. Brown, C. The Old Minimum-Wage Literature and Its Lessons for the New, in M. Kosters (ed.), The Effects of the Minimum Wage on Employment, pp. 87-98, 1996. [ Links ]
10. Burhhauser, R. V.; Couch, K. A.; Wittenburg, D. C. Who Minimum Wage Increases Bite: an Analysis Using Monthly Data from the SIPP and the CPS, Southern Economic Journal, vol. 67, no. 1, pp. 16-40, 2000. [ Links ]
11. Card, D.; Krueger, A. B. Minimum Wages and Employment: a Case Study of the Fast-food Industry in New Jersey and Pennsylvania, American Economic Review, vol. 84, no. 4, pp. 772-793, 1994. [ Links ]
12. Card, D.; Krueger, A. B. Myth and Measurement: The New Economics of the Minimum Wage, Princeton University Press, Princeton, N. J., 1994b. [ Links ]
13. Card, D.; Krueger, A. B. Time-series Minimum- wage Studies: a Meta-analysis, American Economic Review, vol. 85, no. 2, pp. 238-243, 1995. [ Links ]
14. Deltas, G. Can a Minimum Wage Increase Employment and Reduce Prices in a Neoclassical Perfect Information Economy?, Journal of Mathematical Economics, vol. 43, no. 6, pp. 657- 674, 2007. [ Links ]
15. De Fraja, G. Minimum Wage Legislation, Productivity and Employment, Economica, vol. 66, no. 264, pp. 473-88, London, 1999. [ Links ]
16. Fields, G. S. The Unemployment Effects of Minimum Wages, International Journal of Manpower, vol. 15, no. 2-3, pp. 74-81, 1994. [ Links ]
17. Freeman-Castillo, A.; Freeman, R. B. Minimum Wages in Puerto Rico: Textbook Case of a Wage Floor?, working paper no. 3759, National Bureau of Economic Research, 1991. [ Links ]
18. Freeman R. The Minimum Wage as a Redistributive Tool, Economic Journal, vol. 106, no. 436, pp. 639-649, May, 1996. [ Links ]
19. Gindling, T. H.; Terrell, K. The Nature of Minimum Wages and their Effectiveness as a Wage Floor in Costa Rica, 1976-1991, World Development, vol. 23, no. 8, pp. 1439-1458, Oxford, 1995. [ Links ]
20. Hernández; Lasso. El efecto del salario mínimo sobre el empleo (mimeo), Departamento Nacional de Planeación, Colombia, 1999. [ Links ]
21. De Janvry, A.; Sadoulet, E. Growth, Poverty, and Inequality in Latin America: A CausalAnalysis 1970-1994, unpublished paper, University of California, Berkeley, 1996. [ Links ]
22. Hadri, K.; Larsson, R. Testing for Stationarity in Heterogeneous Panel Data where the Time Dimension is Finite, Econometrics Journal, vol. 8, no. 1, pp. 55-69, Royal Economic Society, March, 2005. [ Links ]
23. Lustig, N. C.; McLeod, D. Minimum Wages and Poverty in Developing Countries: Some Empirical Evidence, in S. Edwards and N. C. Lustig (eds.), Labour Markets in Latin America, pp. 62-103, The Brookings Institution Press, Washington, D. C., 1997. [ Links ]
24. Maloney, W.; Núñez, J. Measuring the Impact of Minimum Wages: Evidence from Latin America, working paper no. 9800, National Bureau of Economic Research, 2003. [ Links ]
25. Morely, S. Structural Adjustment and the Determinants of Poverty in Latin America in N. Lustig (ed.), Coping with Austerity: Poverty and Inequality in Latin America, Washington, D. C., The Brookings Institution, 1995. [ Links ]
26. Neri, M.; Gonzaga, G.; Camargo, J. M. Salário Mínimo, Efeito-Farol e Pobreza, Revista de Economia Política, vol. 21, no. 2, pp. 78-99, 2001. [ Links ]
27. Neumark, D.; Stchweitzer, M.; Wascher, W. The effects of Minimum Wages on the Distribution of Family Incomes: a Nonparametric Analysis, working paper no. 6536, National Bureau of Economic Research, 1998. [ Links ]
28. Neumark, D.; Wascher, W. Do Minimum Wages fi ght Poverty?, working paper no. 6127, National Bureau of Economic Research,1997. [ Links ]
29. Neumark, D.; Cunninham, W.; Siga, L. The Effects of the Minimum Wage in Brazil on the Distribution of Family Incomes: 1996–2001, Journal of Development Economics, vol. 80, no. 1, pp. 136-159, june, 2006. [ Links ]
30. Robbins, D.; Mosquera, M. S.; Ruiz, C. J. Legislación laboral, salarios y empleo en Colombia: 1976-1999, Oficina Internacional del Trabajo, primera edición, 2003. [ Links ]
31. Robertson, D.; Symons, J. Some Strange Properties of Panel Data Estimators, Journal of Applied Econometrics, vol. 7, pp. 175-189, 1992. [ Links ]
32. Saget, C. Is the Minimum Wage an Effective Tool to Promote Decent Work and Reduce Poverty?: The Experience of Selected Developing Countries, working paper no. 13, International Institute for Labour Studies-International Labour Offi ce Employment, Geneva, 2001. [ Links ]
33. Shaheed, Z. Minimum Wages and Low Pay: An ILO Perspective, International Journal of Manpower, vol. 15, nos. 2-3, pp. 49-61, Bradford, 1994. [ Links ]
34. Teulings, C. N. Bridging the Gap between «Joe Sixpack» and «Bill Gates»: on the Effi ciency of Institutions for Redistribution, The Economist, vol. 148, no. 5, pp. 603-624, Kluwer Academic Publishers, The Netherlands, 2000. [ Links ]
35. Vélez, C. E.; Santamaría, M. Is the Minimum Wage Binding in Colombia?: A Short Note on Empirical Evidence for 1998 (mimeo), Latin America and Caribbean Department, IBRD, 1999. [ Links ]

