


 Inglés (pdf)
 Articulo en XML
 Referencias del artículo
 Enviar articulo por email
 Citado por SciELO
  Citado por Google
  Similares en
SciELO
Similares en
SciELO  Similares en Google
 Permalink
1. Introduction
The interest in sustainability and sustainable development has been increasing in the past decades. The rapidly growing population of the cities, their aging infrastructure and the environmental concerns continue to challenge and pressure policymakers. The provision of infrastructures and services to allow safe, quick and sustainable mobility of people and goods is increasingly challenging[1]. This implies the investment in improving the quality and sustainability of the transport system, which leads to an increase in productivity, attractiveness, and quality of life in the cities. Therefore, the transport sector has become one of the main subjects that promote sustainable development.
The transport sector plays a fundamental role in the globalized economy by providing an exchange of goods and services to citizens, and its demand is closely linked to economic growth[2]. By 2017, the transport sector employed more than 11 million people directly, around 5% of the total workforce, and its activities accounted for about 5% of Europe’s Gross Domestic Product (GDP)[3]. Between 2010 and 2050, passenger transport activity is expected to grow by 42% and freight transport activity by 60%[4].
Unfortunately, the EU transport sector still remains heavily dependent on oil resources and, therefore, it is responsible for a large part of the air pollution. Figure 1 shows the variation of CO2 emissions from different sectors from 1990 to 2017, using 1990 as the base year. Contrary to the other sectors that have been reducing their emissions, the transport sector has been increasing these emissions in the last years. In 2017, the greenhouse gas (GHG) emissions from the transport sector reached 22% of the total European GHG emissions and 27% when including international aviation and maritime emissions[5].
Figure 1 CO2 emissions from the EU-28 (by sector) [6] (1) Related to manufacturing and construction, industrial processes and product use. (2) Excluding international maritime transport. (3) Related to fuel combustion and other emissions from agriculture. (4) Related to fugitive emissions from fuels, waste, indirect CO2.
Since the transport sector is a key factor in the European economy, reducing its pressure on the environment is critical to achieve long-term sustainability[5]. Investments in low-emission mobility is an important step to achieve a low-carbon, circular economy that meets the mobility needs of people and the transport of goods[7].
Under this scenario, the European Commission’s White Paper on transport - Roadmap to a Single European Transport Area - Towards a competitive and resource efficient transport system, in 2011[8], identified the main challenges in the EU transport sector and proposed strategies for deep changes in the European transport sector aiming at a more sustainable and efficient system.
The adoption of the United Nations’ Sustainable Development Goals also provided new targets to address transport sustainability. These goals address global challenges in several areas such as poverty, inequality, and climate change, in a total of 17 goals to be achieved in 2030[9]. Improvements in the transport sector are very important for achieving many of these goals as several of them are related to transport sustainability. These targets were also highlighted in[10], some of which are directly related to the transport sector while others are related to areas where transport has an important impact, such as energy consumption and emissions.
The sustainable development of the transport sector has been put on the agenda of EU countries, making it clear the necessity of measuring and assessing the current transport sustainable performance towards achieving these targets. It also highlights the importance of analyzing sustainable transport planning, as transport policy and planning decisions can have diverse and long-term impacts on sustainable development. A critical component of sustainable transport planning is developing a comprehensive evaluation program that assesses the transport performance based on an appropriate set of sub-indicators[11].
Sub-indicators are increasingly being used to measure and assess the sustainability of transport for each EU country. Their use is fundamental to make these targets operational and define the actions needed to achieve them. Even though sub-indicators are useful tools, they also have their limitations; for instance, a single sub-indicator cannot provide a complete description of a multi-faceted phenomenon[12]. The sustainability of the transport sector in each EU country is a multi-faceted subject and its assessment requires the use of many sub-indicators. However, the analysis of several sub-indicators is complex for decision-makers, as a joint interpretation is difficult. The best approach is to aggregate the individual sub-indicators for each country into a single index, the composite indicator (CI). The CI is a practical approach that allows summarizing, compare and track the performance of the countries. It allows the measurement of complex and multi-faceted issues that cannot be completely captured by individual sub-indicators analysis[13].
In order to fulfill this objective, this study aims to calculate a CI based on the Data Envelopment Analysis (DEA) technique to measure the environmental performance of the transport sector in the EU countries, from 2015 until 2018, towards a more sustainable mobility. This work is an extension of a previous one made in[14] by increasing the time span under analysis, including now data from 2018. To aggregate the different sub-indicators into the CI, a variant of the Benefit of the Doubt (BoD) model is used, as proposed in[15].
This paper is organized as follows: Section 2 presents a literature review on the construction of the composite indicator and the variant of Benefit of the Doubt model proposed in[15]. Section 3 describes the sub-indicators selected to compose the CI. Section 4 analyses the data used and the CI results obtained. Finally, the conclusions from this work are presented in Section 5.
2. Literature review
2.1 Composite indicators
Composite indicators have been considered a usefulmethod to synthesize masses of data, benchmarkcountries’ performance in relation to desirable states,demonstrate progress towards goals and communicatecurrent status to stakeholders, which leads to effectivemanagement decisions towards the establishedtargets [13]. The essential purpose of the CI is to summarize a complex, multi-faceted phenomenon in wide-ranging fields, e.g., environment, economy, society or technological development, enabling the performance comparison of several countries or the evolution of a country over time [16]. It is also a recognized tool for public communication since it provides a big picture of a subject, facilitating its interpretation by the general public rather than identifying common trends across many sub-indicators [17]. Some well-known composite indicators are the Human Development Index (HDI), that ranks countries based on life expectancy, education, and per capita income sub-indicators; and the Environmental Performance Index (EPI), which uses 32 sub-indicators to evaluate the state of sustainability of the countries [18].
The CI comprises several individual sub-indicators that measure different aspects with usually no unit of measurement in common. The sub-indicators are summarized into a single index on the basis of an underlying model [17]. Considering m sub-indicators, for each country j, y ij (i = 1, ..., m), the CI is calculated according to the general expression presented in (1). When aggregating the sub-indicators i in a composite indicator, it is necessary to assign weight w i to each of them according to the underlying theoretical framework. Thus, the sub-indicators are aggregated into CI j which enables the evaluation of the performance of country j with respect to all m sub-indicators.
The subjective judgment about the relative worth of each sub-indicator is modelled through the weight assigned to it [16]. The weight reflects the significance of the sub-indicator and assigns a value to it in relation to the others. The weights definition usually has a great impact on the aggregation results [12].
The weights attributed to the sub-indicators can be derived through different methods [17]. The easiest and most common approach is to use equal weights. However, as will be further discussed, not all units agree to be evaluated with equal weights since each of them has different characteristics and preferences. The weights can also be based on opinions, such as experts judgment or public opinion poll results. Finally, the third method, to avoid the subjectivity in the determination of the sub-indicators’ weights is to derive them endogenously. This can be preferentially attained by the statistical method, such as the Principal Component Analysis/Factor Analysis, and the deterministic method, such as the Data Envelopment Analysis.
2.2 Data Envelopment Analysis
The DEA is a non-parametric method proposed by Charnes et al. [19], that evaluates the relative efficiency of several decision-making units (DMU) based on linear programming. The DMU is the entity under assessment that uses multiple inputs to produce multiple outputs. The flexibility in the definition of the DMU allows it to be used on a wide range of applications [20]. Therefore, DEA measures the relative efficiency of each DMU, given observations on inputs and outputs values in a set of similar entities, without knowledge of the parametric production function [16,21]. By comparison with the best practices frontier, the DEA model enables to select the weights that are the most advantageous for DMU under assessment [13]. This means that the weights are derived from the data itself, avoiding a priori assumptions and computations involved in fixed weight choices [20].
The DEA enables to measure the DMUs efficiency in terms of Pareto-Koopmans concept, which is obtained when an increase in any output requires a decrease in at least another output or an increase in at least another input, or when a decrease in any input requires the increase of at least another input or the decrease in at least another output [19].
Thus, DEA is a popular method in the CI literature as it can solve the problem of subjectivity in the weighting procedure. Another well-known property of the original DEA model is its unit invariance. This is very interesting for the construction of CI as its final value is independent of the measurement units of the sub-indicators, which in turn makes the normalization stage redundant and unnecessary [22].
2.3 Benefit of the Doubt model
The Benefit of the Doubt (BoD) model, as proposed in [16] is one of the currently widely used DEA models for constructing CI [15]. This model is equivalent to the original DEA input-oriented model, with all sub-indicators considered as outputs and a single dummy input equal to one for all countries. The dummy input can be understood intuitively by regarding the model as a tool for aggregating several sub-indicators of performance, without referencing the inputs that are used to obtain this performance [23]. Since the BoD model only includes outputs, it measures the country’s performance rather than its efficiency.
As stated before, the objective is to aggregate the individuals sub-indicators (the outputs) for each country into a single composite indicator defined as the weighted average of m sub-indicators. Given a cross-section of m sub-indicators and s countries, with y ij being the value of sub-indicator (or output) i for the country j, and w i the weight attributed to the i-th sub-indicator. These weights are endogenously calculated using the BoD model (2) for each country under evaluation j 0. Thus, the optimum weights w i differ from unit j to unit j, each unit corresponds to a given country in a given year. The CI is computed for each country j 0, through the model presented in (2).
For each DMU under evaluation, the model chooses the w i for each sub-indicator y ij0 that maximizes its CI j0 score. The core idea is as follows: if a sub-indicator has a good relative performance it suggests that this country views this policy dimension as relatively important, so it deserves a higher weight. The opposite is also valid, i.e., a sub-indicator with a low relative performance indicates lower importance attached by the country in that context; therefore it receives a lower weight. Consequently, countries cannot claim that poor relative performance is due to a harmful or unfair weighting scheme, as the model (2) maximizes the CI for each country under assessment [16].
The model (2) has two kinds of restrictions. The first restriction imposes that no country can have a CI value greater than one, to ensure an intuitive interpretation of the indicator. The second restriction imposes that each weight attributed to the sub-indicators should be non-negative, which implies that the CI is a non-decreasing function of the sub-indicators. Consequently, the CI value obtained varies between zero and one for each assessed country j 0, where higher values indicate a better relative performance [22].
In fact, the conventional BoD model derives the composite indicator by aggregating forward sub-indicators, which capture the positive aspect of a performance, where their increasing values are desirable. Frequently, the performance assessment has to handle with anti-isotonic sub-indicators, which capture the negative aspect of a performance, where their increasing values are undesirable. There are many sub-indicators that fall in this category, for example, emission of a pollutant, traffic accidents, crime rate, among others. These sub-indicators need to be transformed before being incorporated in the conventional BoD model and treated as the forward sub-indicators [15].
Previous approaches used to deal with these anti-isotonic sub-indicators are the use of data transformation methods and directional distance function models. One of the most common data transformation methods is the inversion of the value of the anti-isotonic sub-indicator [24]. The subtraction of the sub-indicator from a sufficiently large constant and the rescaling normalization using the maximum-minimum method are also approaches that can be found in the literature. Some of these methods are presented and compared in [25] and [26]. Even though these transformation methods are simple, they can be problematic. Since the BoD model is derived from an input-oriented DEA model with constant returns to scale, it is not translation invariant for the output values. This means that, the use of translated or rescaled data will affect the CI results and, consequently, the ranking of the DMUs [15]. To avoid the transformation of the anti-isotonic sub-indicators, a new BoD model has been recently suggested [15], which directly incorporates the anti-isotonic sub-indicators in the CI. In the present study, this model is shortened by the authors’ names initials Färe, Karagiannis, Hasannasab and Margaristis, i.e., FKHM model. This model treats the anti-isotonic sub-indicators as reverse rather than as undesirable. This means that the model assumes that the reverse sub-indicators values can decrease or increase independently from the values of forward sub-indicators.
Given a cross-section of M sub-indicators and s countries, y ij is the value of sub-indicator i for the country j, and w i is the weight attributed to the i-th sub-indicator. The formulation for the FKHM model is presented in (3), where y ij (j = 1, ..., m) are the forward sub-indicators (i.e., capturing positive aspect) and y ij (j = m + 1, ..., M ) are the reverse sub-indicators (i.e., capturing negative aspect).
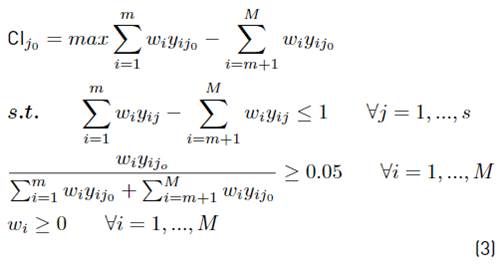
The main difference from the FKHM model to the conventional BoD model (2) is that (3) maximizes the difference between the weighted average of forward sub-indicators and the weighted average of reverse sub-indicators. Additionally, the presence of forward sub-indicators does not imply the presence of reverse ones. Thus, when there are no anti-isotonic indicators, model FKHM can be reduced to the formulation of the conventional BoD model [15].
The model (3) also incorporates a third restriction, the sub-indicator share restriction. It prevents the model from assigning zero weights to some sub-indicators, since zero weight means that the sub-indicator associated has no influence on global performance. By adding a sub-indicator share restriction, as proposed by [27], each sub-indicator is required to have a minimum percentage of contribution in the assessed composite indicator. It was defined that each sub-indicator share should have a contribution of at least 5%, α =0.05. This value was chosen as it was sufficient to prevent the attribution of zero weights at any sub-indicator, thus, guaranteeing the contribution of all sub-indicators in the final CI and increasing the countries’ discrimination in the performance assessment. The usual value for α =0.10 found on literature was not used, as this value ends up penalizing countries under-performing in a single sub-indicator, and, in these conditions, very few countries in the data set would be efficient.
3. Methodology
This paper intends to assess the transport environmental performance of EU countries through the aggregation of sub-indicators into a CI using the FKHM model (3). As the CI consists of the aggregation of several sub-indicators, their selection is of crucial importance to compute the overall performance. The proposed composite indicator is developed with the intention to achieve a balance between what is necessary to support a sustainable transport assessment and the available data for EU countries. Data and variables The selection of the sub-indicators was based on a literature review of CI with a similar conceptual framework, the goals of transport sustainability mentioned in the EU’s White Paper (Roadmap) [8], the Sustainable Development Goals [9], and the available data for all the EU countries in the time span under analysis. Besides, each sub-indicator must be of easy interpretation and should measure a specific dimension of the performance, ensuring a minimal number of sub-indicators that assure that the most important dimensions are reflected in the calculation of the CI. All the data used in this work were gathered from the Eurostat database [28].
To assess the transport environmental performance of EU countries, the CI was constructed based on three forward sub-indicators (i.e., capturing positive aspect) and four reverse sub-indicators (i.e., capturing negative aspect). The forward sub-indicators are the share of buses and trains in total passenger’s transport, the share of energy from renewable sources in transport and the share of rail and inland waterways in total freight transport. The reverse sub-indicators are people dead in road accidents, GHG emissions by fuel combustion in transport, the average CO2 emissions per kilometer from new passenger cars and the energy dependency on oil and petroleum products. These sub-indicators are described hereinafter.
The share of collective transport in total passenger transport (public transport) is expressed in percentage and measures the share of passenger’s transport made by collective transport in the total inland transport. Collective transport refers to buses (including coaches and trolleybuses) and trains, while the total inland transport includes these facilities and also passenger cars. Trams and metros are not included due to the lack of harmonized data collection methodology between the EU-28 countries. The public transport sub-indicator is related to two Sustainable Development Goals, in which it is highlighted the importance of building resilient and sustainable infrastructure and the necessity to renew and plan cities to provide access to basic services for all. This sub-indicator also relates to the necessity of improving the transport quality, accessibility and reliability, as discussed in the Roadmap.
The share of energy from renewable sources in transport (renewable fuels) is expressed as the percentage of renewable fuels in the total transport fuels. Energy by renewable sources consumed in transport is given by the sum of sustainable biofuels, renewable electricity, hydrogen and synthetic fuels of renewable origin and other reported forms of renewable energy [29]. With this sub-indicator, it is possible to understand how extensive is the use of renewable energy in the transport sector and how much it has been replacing fossil fuels. The Renewable Energy Directive promotes policies for the production and use of energy from renewable sources in the EU, which states, in the revised version from 2018, the target of 32% share of renewable energy in the transport sector for 2030 [30]. The Roadmap also suggests a regular phase out of conventionally-fueled vehicles from urban environments by halving their number in 2030 and phasing them out of the cities by 2050.
The share of rail and inland waterways in total freight transport (freight transport) is expressed in percentage. The total inland transport in the denominator of the sub-indicator includes freight on national territory made by road, rail and inland waterways transport. Sea and air freight transport are not represented in the sub-indicator. The freight transport sub-indicator was not applicable for Cyprus and Malta since these countries did not present values for railways or inland waterways. As an effort to have a complete database without excluding these countries from the evaluation in this work, the lowest values observed on the dataset were used for Cyprus and Malta, for every year. This method avoids that these countries become unintended benchmarks, and therefore, it will not affect the location of the best practice frontier. This method has been suggested in [31]. The Roadmap mentions the objective of shifting 30% of the road freight to other modes, such as rail and waterways, by 2030 and more than 50% by 2050. This sub-indicator also reflects the progress towards the Sustainable Development Goals focused on innovation and building resilient and sustainable infrastructure.
The people dead in road accidents (road deaths) sub-indicator measures the number of fatalities in road accidents per hundred thousand inhabitants. This sub-indicator includes passengers and drivers of motorized vehicles and pedal cycles, as well as pedestrians, that have died up to 30 days after the accident. This sub-indicator is aligned with two Sustainable Development Goals aiming at safer cities, health, and well-being status. As highlighted in the Roadmap, EU aims to reduce fatalities close to zero by 2050 with initiatives in the areas of technology, enforcement, and education.
The GHG emissions by fuel combustion in transport (GHG emissions) measure the transport’s fuel combustion contribution in the total greenhouse gas emissions inventory. The values are originally expressed in thousand tonnes and were normalized using the countries’ population on 1st January of each year, to take into consideration their dimension. Therefore, the sub-indicator data is expressed in thousand tonnes per hundred thousand inhabitants for each country. The GHG emissions from the transport by road and inland waterways accounted for 22% of the total European Union emissions in 2017 and reached 27% when including international aviation and maritime emissions [32]. The Roadmap sets out a target of 60% reduction in the GHG emissions by 2050 compared to 1990 levels.
The average carbon dioxide (CO2) emissions per kilometer from new passenger cars (new car emissions) is defined as the average CO2 emissions per kilometer in a given year for new passenger cars and expressed in grams of CO2 per kilometer. This is a target for the average of the manufacturer’s overall fleet, meaning that cars above the limit are allowed in the market as long as they are offset by the production of lighter cars. The Regulation (EU) 2019/631 sets a mandatory target for emission reduction for new cars of 95 grams of CO2 per kilometer by 2021 [33]. This sub-indicator reflects three Sustainable Development Goals related to ensuring an environmentally aware consumption, innovation in search of lasting solutions to environmental challenges and the call for climate action. The Roadmap also highlights the importance of the research and innovation on vehicle propulsion technologies and the improvement of energy efficiency performance of vehicles across all modes.
The energy dependency on oil and petroleum products (energy dependency) sub-indicator monitors to which extent the countries economy relies on imports of oil and petroleum products to meet their energy needs. It is calculated by dividing the net imports by the gross available energy, and it is used on a percentage basis. The net imports are the difference between the total imports and the total exports. The gross available energy is the sum of primary products, recovered and recycled products and imports, minus the sum of exports and stock changes. Regarding its metrics, energy dependency may be higher than 100% with regard to countries creating a stock in a given year, or it can be negative, for oil exporter countries. A negative value occurred only once in the dataset, and the value was close to zero (-4.701%) for the exporter country. To maintain the relative position of all units regarding the other countries, a constant of 5.701% was added for each score of energy dependency sub-indicator. Thus, the best score of 1% is assigned to the exporter country, avoiding the necessity of handling negative data in the model, and the relative position of the units are kept the same. This sub-indicator shows how the EU countries progress towards more resource-efficient policies. As oil becomes scarcer each year, the necessity of reducing EU dependency on oil imports, without reducing the transport system efficiency, is one of the objectives mentioned in the Roadmap. Imports expose the economy to volatile world market prices and the risk of supply shortages.
These seven sub-indicators are used to assess the transport environmental performance of EU countries, as presented in the next section.
4. Results
The transport environmental performance was assessed for the 28 EU countries, from 2015 to 2018. The study considers the United Kingdom data since during the time span of the assessment, the country still integrated the European Union. Table 1 shows the mean and the dispersion coefficient (DC) for the sub-indicators under analysis across countries. These statistics were calculated for the time span under analysis, from 2015 to 2018. The DC, given by the ratio between the standard deviation and the mean, was calculated to facilitate the analysis among sub-indicators. As it measures the degree of the data dispersion around the mean, the DC allows the comparison between different data sets with different measurement units. The last column in Table 1 presents the variation of the sub-indicator average between 2017 and 2018 in percentage.
In Table 1, a high DC value, or data dispersion relative to the mean, was observed in the renewable energy sub-indicators, which translates the difference among countries in available renewable energy. Some countries, such as Finland in 2015, had 24.8% of the fuel in transport from renewable sources while the average for this sub-indicator was 6.54%. However, the DC for this sub-indicator has been constantly decreasing and was 20% lower in 2018 when compared to 2015, reflecting a tendency to increase the homogeneity among EU countries. The share of freight transport had the highest DC value in the time span under study. As some countries have geographical locations and environmental conditions that facilitate the utilization of rail and inland waterways for transport more than others, this high variability is expected. Another high DC value was obtained by the GHG emissions sub-indicator, reflecting the different policies of EU countries for reducing emissions. For example, Luxembourg had 1013.489 thousand tonnes per hundred thousand inhabitants of GHG emissions in 2015, while Romania only had 79.080 thousand tonnes per hundred thousand inhabitants in the same year. The lowest DC was observed for the average CO2 emissions per kilometer from new passenger cars. This can be reflecting a higher homogeneity of EU regulations which have introduced CO2 emission performance standards for manufacturers operating in the EU market (for instance, Regulation (EU) No 333/2014 of the European Parliament and of the Council of 11 March 2014 amending Regulation (EC) No 443/2009 to define the modalities for reaching the 2020 target to reduce CO2 emissions from new passenger cars).
Analyzing the average variation of the forward sub-indicators between 2017 and 2018, it can be seen that there was an improvement in all of them. The share of public transport in total passenger transport had a slight increase of 0.08% between 2017 and 2018. The average share of renewable energy in transport presented the highest rate of improvement, increasing 11.64% in the last year. The share of freight transport had also a slight improvement in the last year in 2018, and was 0.46% above 2017 levels.
Regarding the reverse sub-indicators, that have a negative impact on transport sustainability, the EU countries have deteriorated their performance, on average. The average of road deaths for all countries had a 1.14% increase in 2018. The average of GHG emissions increased 1.51% in 2018. The average of new car emissions increased 0.46% in the last year but still remained 0.4% below 2015 levels. The average energy dependency of the EU countries had the lowest increase, and kept only 0.05% above 2017 levels.
4.1 Sustainable performance assessment
The sustainable transport performance for each country in a given year was computed by aggregating the seven chosen sub-indicators into a CI using the variant BoD model (3) proposed [15] that does not require any transformation on the reverse sub-indicators. The CI of the sustainable transport performance was calculated using the data from the time span of four years, from 2015 to 2018, and it is assessed by comparison to the best practices observed during this complete time period. The CI average is summarized in Figure 2.
The average of the sustainable performance had only small variations through the years. It decreased by almost 3% in 2016 when compared to 2015, but began to increase in 2017. By 2018 the CI average was 4.09% above 2015 levels. Twelve units were efficient in this analysis, i.e., have a CI score of one: Denmark (in 2017), Latvia (in 2015 and 2018), Hungary (in 2015, 2016 and 2017), Netherlands (in 2015, 2017 and 2018), Romania (in 2015) and Sweden (in 2017 and 2018).
Table 2 shows the CI results from the top five countries, which had the highest CI score in 2018, and the last five countries, which had the lowest CI scores in the last year. Latvia and Sweden were already efficient in 2015, decreased their CI score in the following years, but by 2018, both were efficient again. Sweden increased its CI score by 14% between 2015 and 2018. Romania and Hungary decreased their CI score when compared to 2015 but still had high CI results. The highest improvement was observed in Spain and Greece, which increased their CI scores in 2018 by 34.9% and 27.6% above 2015 levels, respectively. Although, they still ranked among the five lowest performance countries. Malta had an improvement of 4% between 2015 and 2018. A high decrease of 16.1% was observed during this time frame for Ireland. Cyprus was the most inefficient country in this analysis and had no improvement during this time frame.
Cyprus was the most inefficient country in this analysis and had no improvement during this time frame.
4.2 Benchmark analysis
Using the dual formulation of the FKHM model (3), it is possible to perform a benchmark analysis for each assessed country j 0 by retrieving the dual variables λ j . For each country j 0, a score of λ j different from zero identifies its benchmark j (efficient countries that compose the frontier) with which it is compared to obtain its CI. The score of λ j represents the degree of intensity of each benchmark j in the CI score of the country j 0. The number of times that each benchmark was used by the inefficient units is summarized in Table 3.
Sweden in 2018 was the benchmark unit most used by the inefficient countries to obtain their performance, followed by Hungary and Latvia in 2015. The other benchmarks were used in a much lower frequency.
4.3 Radar analysis
This study also compares the performance on the forward and reverse sub-indicators between the efficient and the inefficient countries. The benchmarks are the efficient units, that obtained a CI score of one, while the inefficient countries have a CI score below one. The average for each sub-indicator is calculated for both groups (benchmarks and inefficient countries). The radar analysis compares the average of the sub-indicators between efficient units (benchmarks) and the inefficient ones. To simplify the comparison, the average of the sub-indicators of inefficient units are normalized by the average of the sub-indicators in the benchmarks. Figure 3 shows a comparison between each sub-indicator between the benchmarks and the inefficient countries. The reverse sub-indicators were highlighted in red and the forward ones in green.
Analyzing Figure 3, it is possible to identify the areas where the inefficient countries need improvement by setting out policies and/or redefine output standards, for instance. Except for the number of road deaths and new car emissions sub-indicators, in which both groups had a very similar performance, the inefficient countries were always outperformed by the benchmarks. Analyzing the forward sub-indicators (green colored), the inefficient countries had about 86% of the share of public transport presented by the benchmarks and 64% of the renewable energy share presented by the benchmark group. In the freight transport sub-indicator, the inefficient countries have less than 55% of the value presented for the benchmarks. Considering the reverse sub-indicators (red colored), the inefficient countries had a value of GHG emissions almost 40% higher than the benchmarks. The average energy dependency sub-indicator of the inefficient countries was 10% higher than the benchmarks.
Most of the work to improve transport sustainability should be done to reduce the GHG emissions from fossil fuel, improve the infrastructure and promote policies to increase the share of freight transport that uses rail and inland waterways and also increase the share of energy from renewable sources in transport. There is still a margin to increase the use of public transport of the inefficient countries by improving its accessibility and quality to allow a larger share of passengers to benefit from it and reduce the oil and petroleum dependency through changes in the transport energy consumption.
5.Conclusions
This study aimed to evaluate the environmental performance of the transport sector in the 28 countries of the European Union, from 2015 and 2018, towards the policy agenda established in strategic documents. Based on the literature review, the targets set on transport strategic documents, and the data available for all the EU countries, seven transport sub-indicators were selected for the assessment. Three sub-indicators are forward, measuring a positive aspect: the share of buses and trains in total passengers’ transport, the share of energy from renewable sources in transport, and the share of rail and inland waterways in total freight transport. The remaining four sub-indicators are anti-isotonic or reverse, measuring a negative aspect: people dead on road accidents, the GHG emissions by fuel combustion in transport, the average CO2 emissions per kilometer from new passenger cars and the energy dependency on oil and petroleum imports.
Based on the results achieved with the FKHM model, it is possible to conclude that, in general, the transport environmental performance of the EU countries has improved in the last two years and by 2018 was 4.09% above 2015 levels. This result points out that EU countries are making efforts in the right direction, and the countries are strengthening their ability towards sustainable mobility.
The performance assessment identified 12 efficient units: Denmark (in 2017), Latvia (in 2015 and 2018), Hungary (in 2015, 2016 and 2017), Netherlands (in 2015, 2017 and 2018), Romania (in 2015) and Sweden (in 2017 and 2018). By using these units as benchmarks and comparing their performance in each sub-indicator with the remaining units (the inefficient ones), it is possible to identify the areas that need improvement. Most of the work to improve transport sustainability should be done by drastically reducing the greenhouse gas emissions from fossil fuel combustion, increasing the share of freight transport that uses rail and inland waterways, and also the share of transport energy from renewable sources.
Future work should explore other models for treating anti-isotonic sub-indicators in order to allow results comparison among different models. Furthermore, some other sub-indicators can be taken into account, to calculate the composite indicator for each country. A life cycle analysis of transport systems and fuel production should also be developed. Besides, the study can be expanded to include more countries and regions.

