


 Inglés (pdf)
 Articulo en XML
 Referencias del artículo
 Enviar articulo por email
 Citado por SciELO
  Citado por Google
  Similares en
SciELO
Similares en
SciELO  Similares en Google
 Permalink
Introduction
In 2012, 4.6 million tons (t) of strawberries were produced worldwide, with the United States being the main producer with 1,366,850 t, followed by Mexico with 360,426 t, Turkey with 353,173 t, Spain with 289,900 t and Egypt with 242,297 t (Wu et al., 2015). The principal importing countries for 2013 were the United Kingdom (470,770 t), Canada (123,463 t), the United States (110,457 t), France (90,587 t) and the Netherlands (28,937 t) (Camara de Comercio de Bogota CCB, 2015). In Colombia in 2013, 42,453 t of strawberries were produced, with Cundinamarca being the province with the highest production with 22,562 t, followed by Antioquia with 12,545 t, Norte de Santander with 3,360 t, Cauca with 2,808 t and Boyaca with 542.2 t (CCB, 2015), to date these amounts have not been significantly improved.
This fruit stands out because of its content of vitamin C, tannins, flavonoids, anthocyanins, catechin, quercetin and kaempferol, organic acids (citric, malic, oxalic, salicylic and ellagic) and minerals (Κ, P, Ca, Na and Fe), as well as pigments and essential oils (Özcan and Haciseferogullar, 2007; Pinto et al., 2008). It has a unique taste that makes it desirable, a pleasant aroma and an immense source of sugars (Sharma and Sharma, 2004). However, the strawberry is a highly perishable product because of its high respiration rate (Manning, 1993). Its postharvest life is very short and very susceptible to microorganisms and physical damage during handling, storage and commercialization (Sistrunk and Morris, 1985). The market and distribution over long distances is restricted because of its perishability and senescence, as well as the appearance of postharvest diseases that can cause significant economic losses. This short shelf-life is related to the reduction of characteristics such as aromatic properties, flavor and brightness, which cause early deterioration (Cuncha, 2011).
Many studies have been carried out evaluating the effect of different factors on sensory and nutritional treatments of fruits and their products (Shin et al., 2012). Information on the physical, mechanical and chemical properties of the strawberry are of great importance in the design of harvesting equipment and postharvest technology, such as transportation, storage, cleaning, sorting, packing and processing (Martínez-Soto et al., 2008).
In order to know the properties of harvested fruits from different strawberry producing municipalities in the province of Cundinamarca, Colombia, the main goal of this study was to provide useful information in order to establish quality standards for national and international markets.
Materials and methods
Location
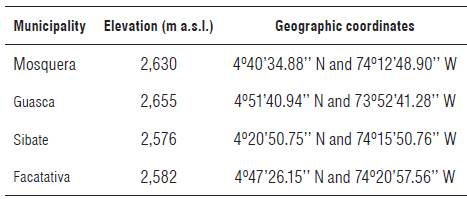
This study was conducted in four representative producer areas of the province of Cundinamarca, shown in Table 1. These zones were strategically chosen because of their agro-climatic potential, which promotes better plant growth, fruit development and a larger strawberry crop tradition.
Environmental data
Recorded data for the mean day temperature and relative air humidity of the producer municipalities were obtained from the database of the "Instituto de Hidrologia, Meteorologia y Estudios Ambientales (IDEAM)" from the Ministry of Environment and Sustainable Development of Colombia for the plant development period of 12 months (January 2015 to December 2015). Additionally, the relative air humidity and average day temperature in each crop area where the fruits were collected for this study were registered with data loggers (RHT10, Extech Instruments® Waltham, MA) (Fig. 1 and 2).
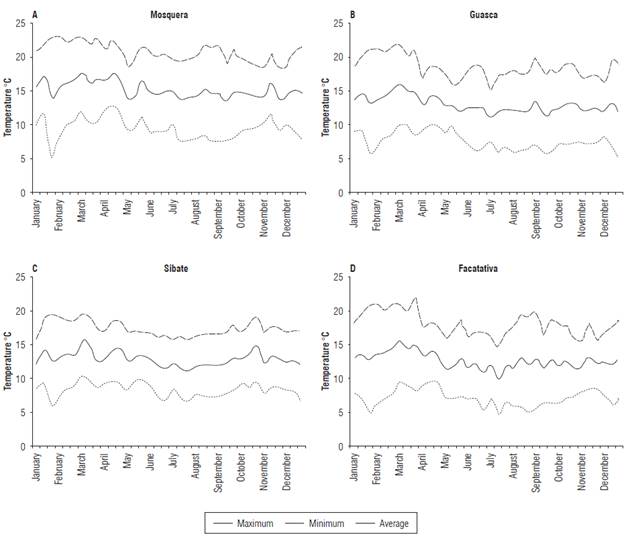
FIGURE 1 Temperature in the growing areas of each municipality for one year, obtained with the IDEAM database.
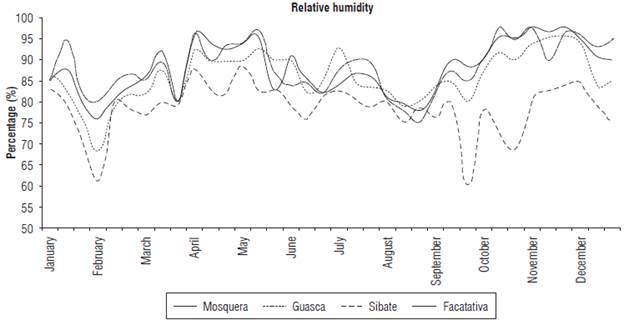
FIGURE 2 Average relative air humidity in the growing areas of each municipality for one year, obtained with the IDEAM database.
To carry out this study, a representative sample of fruits of the Albion variety was collected and classified in three quality states (1, 2 and 3) and three maturity stages (4, 5 and 6) according to the Colombian Technical Standard (NTC 4103). From each sample, fruits of each state were taken for variable evaluation. The tests were performed one day after harvest in the postharvest laboratory of the Agricultural Engineering Department of the Universidad Nacional de Colombia, Bogota campus, following the guide for postharvest analysis of perishables (Herrera, 2010), using 5 samples for data collection for each of the variables explained below:
Dry mass
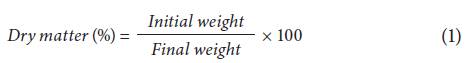
In order to obtain the dry weight of the fruits, samples were taken, differentiating them by quality grades and maturity stages. Then the fruits were dried in an oven at 90°C, recording weight measurements every 24 h, taking as the final dry weight the stabilized weight used to obtain a percentage with the following formula:
Consistency
To determine the consistency, a CT3 texturometer (Broo-kfield Engineering, USA) was used with an accessory punch with a 0.2 cm diameter, using the final load as the reference.
pH and total titratable acidity (TTA)
The TTA was determined with a TitroLine® WA20 potentiometer (SI Analytics, Weilheim, Germany). To obtain a 1:1 solution, 10 g of pure fruit extract and 10 g of distilled water were prepared. A computer showed the pH and the volume of reagent required for titration in millimeters (mm), and the percentage of acidity (citric acid for strawberry fruits) was calculated with the following formula:
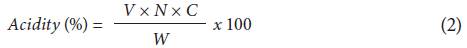
where:
V: NaOH volume (mL) used
N: NaOH normality (0.1 mol/L)
C: Citric acid constant (0.064 g meq-1)
W: Sample weight (g)
Total soluble solids (TSS)
For the TSS determination, a J357 refractometer (Rudolph Research Analytical, Hackettstown, NJ, USA) was used with one pure strawberry juice extract as the sample, and results were expressed in percentage units. Additionally, the reading was corrected for acidity using the formula obtained by Herrera (2010):

Color
For the color measurement, the Hunter Lab system and a Chroma meter CR 400 (Konica Minolta Sensing Europe, Bremen, Germany) were used. After calibration, the readings were taken at three different sites of each fruit.
Statistical analysis
All statistical analyses were performed with R software (v 2.15.2) (R Development Core Team 2012). The data were analyzed using a mixed lineal effect model, with Tukey test for variance and homogeneity with a reliability level of α = 0.05 to identify significant differences between the evaluated variables.
Results and discussion
Three maturity stages of the Albion variety for the 4 producer municipalities were evaluated. Production in Guasca is focused on obtaining stage 6 fruit maturity fruits for industrial use. Production in Sibate and Facatativa does not reach stage 6 of maturity in order to avoid losses from deformation or mistreatment of fruits during the harvest, packing and transportation process. Finally, in the municipality of Mosquera, the production process is carried out in order to make comparisons in terms of applied technology versus traditional strawberry treatments.
Length and width
As the quality decreased, so did the size. The strawberry fruits from these municipalities showed significant differences for both length (Fig. 3) and width (Fig. 4). Mosquera presented a length average of 5.02 cm, Guasca had 4.99 cm and Facatativa showed 4.57 cm. The most contrasting difference occurred between the municipalities of Mosquera and Sibate. All measurements were higher than the NTC 4103 standard, in which strawberries of the Chandler variety were used; the largest measured width (A) was 3.4 cm.
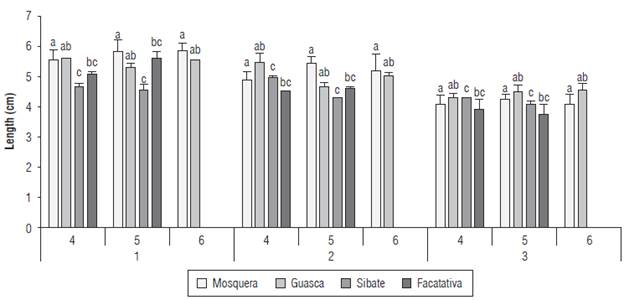
FIGURE 3 Average length of Albion fruits selected by degree of quality and maturity stage. Error bars indicate standard deviation. Means with different letters indicate significant differences according to the Tukey test (P≤0.05).
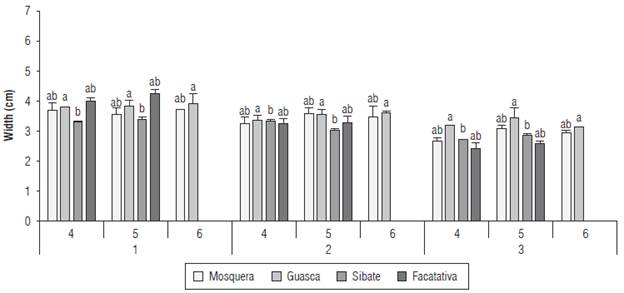
FIGURE 4 Average width of Albion fruits selected by degree of quality and maturity stage. Error bars indicate standard deviation. Means with different letters indicate significant differences according to the Tukey test (P≤0.05).
A study carried out by Casierra-Posada et al. (2011), in which the development of strawberry plants with different color coverings was analyzed, showed that the highest length average with red coverage results in 3.16 cm in final products. On the other hand, Martinez-Soto (2008) evaluated the physicochemical properties of six different varieties of strawberry, in which the average length of the Albion variety was 3.56 cm; these results were similar to those established by the NTC 4103 standard. Finally, a study conducted in India by Pandey et al. (2015), in which different growth environments were evaluated, showed that the 'Winter dawn' variety planted in open fields presented an average length of 4.77 cm, which is closest to that obtained in the four evaluated municipalities; however, the municipality of Mosquera, for quality 1 and stage 6 of maturity, presented an average length of 5.87 cm, a size of commercial interest.
The width of the fruits had a behavior that was very similar to that of the length, but in this case, the differences had less contrast between the municipalities. As the quality decreased, so did the size, resulting in an average of 3.29 cm for Mosquera, of 3.51 cm for Guasca, of 3.07 cm for Sibate and of 3.27 cm for Facatativa. The greatest difference was obtained between the municipalities of Guasca with the highest average and Sibate with the lowest average.
Dry matter of fruits
Dry matter is a representation of chemical compounds of plant tissue such as carbohydrates, nitrogen and lipid compounds, minerals, vitamins, fiber and organic acids (Ayala et al., 2013). So, it was important to determine their percentage accumulation within the total weight of each strawberry fruit.
The results obtained in this study showed statistically significant differences (Fig. 5); the fruits of the municipality of Mosquera had higher percentages of dry mass than the other production areas, with a total accumulated average of 11.88%, in comparison to 8.47%, 9.58%, and 7.11°% accumulated for the municipalities of Guasca, Sibate and Facatativa, respectively. Studies by Ávila and Soler (2001) showed that the water content in fruits was 85.2%, which left a cumulative dry matter of 14.8%. Thus, the results obtained in this study agree with normal fruit development.
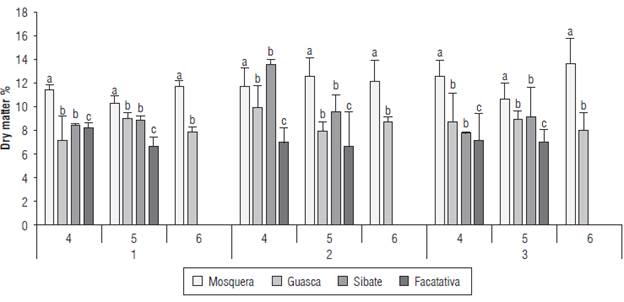
FIGURE 5 Percentage of dry matter of Albion fruits selected by degree of quality and stage of maturity. Error bars indicate standard deviation. Means with different letters indicate significant differences according to the Tukey test (P≤0.05).
Hence, the greater accumulation of differentiated dry matter by the fruits from the municipality of Mosquera may have resulted from the crop system established inside greenhouse conditions. As shown in Figure 1, it had the highest temperature among the municipalities, which improved the development of plants and harvestable organs by accelerating plant metabolism (Opstad et al., 2011). Likewise, plastic with a UV filter can generate a more assimilable wavelength and the arrival of more uniform and stable light to the foliage of plants. Estrada (2011) commented in his study on the positive correlation that is generated in the photosynthetic apparatus on the production of fresh and dry matter in strawberry crops.
The weight variation was not determined directly with the biomass, but with the amount of water contained in the cells. Water is the most abundant component in fruits and vegetables, comprising about 90% of the mass. Water content values vary according to the structure of products (Vicente et al., 2009), which is why fruits and vegetables are highly perishable, since they can easily generate the development of microorganisms.
Consistency
The consistency assessment in this study had an interesting behavior that demonstrated two important aspects: first, a greater resistance to deformation in third quality fruits, in which smaller sizes showed a more compact and rigid cellular order in the fruits, and second, a lower deformation resistance as the degree of maturity advanced. Figure 6 shows how, at the municipality level, Guasca and Sibate presented 10.32 and 10.34 mm, respectively, whereas Mosquera and Facatativa showed averages of 8.96 and 7.92 mm, respectively. Fruit texture changes as a result of hydrolysis of starch and pectin, reduction of fiber content and degradation processes in cell walls, so that fruits become soft and more susceptible during post-harvest management (Arias and Toledo, 2000).
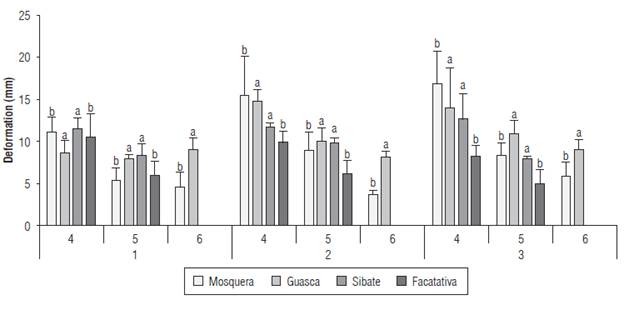
FIGURE 6 Resultant deformation on Albion fruits selected by degree of quality and stage of maturity. Error bars indicate standard deviation. Means with different letters indicate significant differences according to the Tukey test (P≤0.05).
As the physiological and organoleptic maturity of fruits proceeds, they lose resistance to penetration because of the degradation of polymeric carbohydrates, especially peptic substances and hemicelluloses. This is why cellular walls and the cohesive forces that keep cells united weaken, resulting in disintegration of the cellular structure and the internal movement of water that is related to the processes of osmosis (Agón et al., 2006).
The strawberry also suffers problems of softening during maturation and senescence processes. Softening is related to biochemical alterations by enzymes such as polygalac-turonases and pectin methyl esterases, which degrade the peptic structure of the cell wall of the middle lamina as a result of the decrease of levels of extracellular calcium seen in mature fruits (Ferguson et al., 1995). The firmness of fruits, an important attribute of quality, is affected by these enzymes, which cause the softening of fruit tissues, making them susceptible to fungal contamination (Hernández-Muñoz et al., 2008).
pH, TTA and TSS
The values of pH, TTA and TSS (Tab. 2) showed significant differences in each municipality. The pH had a different value in Sibate, with an average of 3.37; the other municipalities did not present significant differences, with average results of 3.53, 3.51 and 3.47 for Mosquera, Guasca and Facatativa, respectively. The slight increase in pH in the three municipalities resulted from a reduction of the acidity generated by the use of organic acids as an energy source to support the normal process of fruit ripening (Chitarra and Chitarra, 2005).
TABLE 2 Results of pH, TTA and TSS in Albion fruits evaluated by degree of quality and stage of maturity.
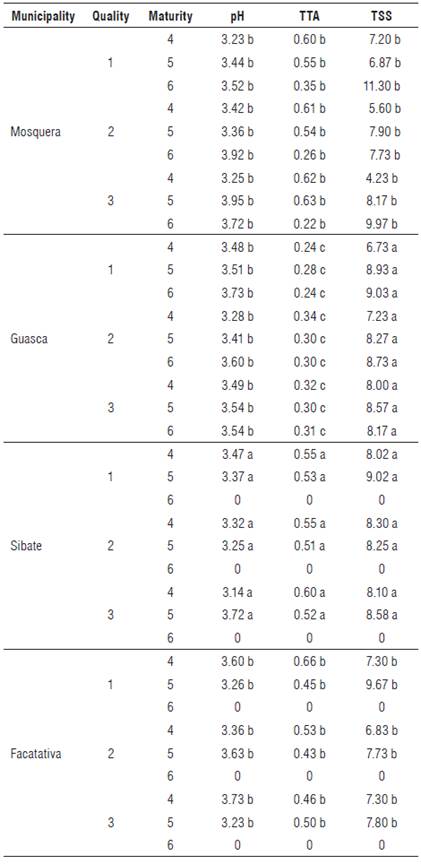
Means with different letters indicate significant difference according to the Tukey test (P≤0.05).
The municipality of Sibate presented the highest average TTA value (expressed as a percentage of citric acid), with a total of 0.55% differing significantly from the other municipalities; Mosquera showed a value of 0.49%, Facatativa had a similar value with 0.51% and Guasca showed the lowest average value with 0.55%. The highest TTA single value was detected in Facatativa (quality 1, maturity stage 4) with 0.66%. This value is very different from 0.83%, which is the minimum standardized value in maturity stage 4 of NTC 4103.
However, Kader (1999) recommended a maximum concentration of citric acid of 0.8% in order to achieve an acceptable flavor since less acidic fruits are preferred for fresh consumption, while those with a higher concentration of citric acid can be used for processed products of higher quality (Quian et al., 2005). On the other hand, Cordenunsi et al. (2002) found that citric acid contributes to 92% of strawberry acidity, which is why it is established in terms of percentage. Pinto et al. (2008) stated that the acids contained in fruits are consumed in the respiratory process over time, giving place to new compounds, which explains their decrease during the ripening process.
As for the TSS, the municipalities of Guasca and Sibate were significantly different, with averages of 8.19 and 8.38, respectively, while Mosquera and Facatativa presented 7.66 and 7.77, respectively. Compared to NTC 4103, these values are appropriately adjusted to those proposed by the standard.
The TSS measurement is associated with the dissolved sugars in the cellular juice (Osterloh et al., 1996). These authors stated that the amount of sugars in a fruit is determined by the variety. A recent study with seven different varieties supports this statement, where the authors clearly showed significant differences between seven different strawberry varieties, cultivated in very similar regions of the country (López-Valencia et al., 2018).
Previous studies have shown that °Brix increases if starch is completely hydrolyzed and then decreases as a result of respiration, which increases as maturation progress does (Salamat, 2013). According to Kays (2004), sucrose is translocated from leaves to fruits and, during the development of fruits, sugars are transported to growing fruits, where they are turned into starch. Accordingly, total soluble solids increase in the maturation process, so that expected TSS values would tend to increase °Brix (Manning, 1993).
Color
In order to evaluate this parameter, quality 1 fruits were analyzed because of the high similarity in the color of the of the three different quality stages. Figure 7 shows the behavior L, a and b parameters based on the Hunter Lab scale for the four evaluated municipalities. Component L represents the variation between black and white, where black is = 100 and white is = 0. Parameter a does not have a defined numerical limit, and its positive value indicates a tendency towards the red tone, while its negative value indicates a tendency towards the green one. Parameter b also has no defined numerical limit; its positive value indicates a tendency towards the yellow tone, while its negative value indicates a tendency towards the blue tone (Hunterlab, 2012).
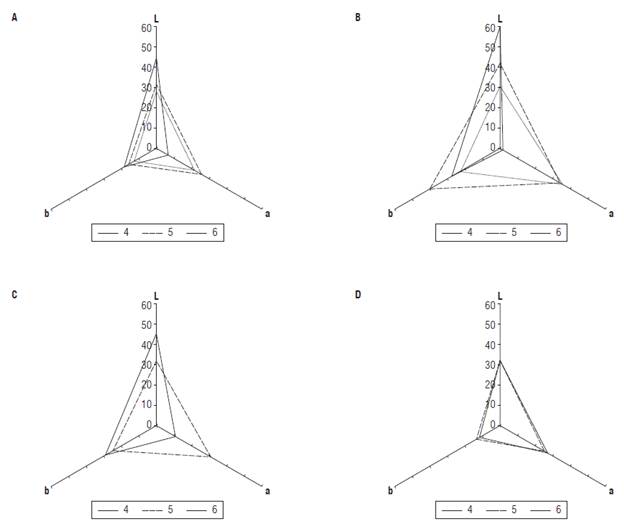
FIGURE 7 Hunter Lab graphs obtained from the Albion fruits selected for first quality and by stage of maturity (4: black line, 5: segmented line and 6: grey line) of each municipality: A) Mosquera, B) Guasca, C) Sibate and D) Facatativa.
A clear decrease of the L parameter was observed as the maturity stage progressed, indicating the tendency of the fruits to become darker, just as the value b was abruptly reduced, showing a trend towards the blue tone. In the graphs, no negative values were observed, eliminating the green color in the evaluated fruits because of their advanced maturity stages. However, this indicates a positive decrease, turning the fruits towards the red tone, as expected. This reduction was explained by the change in the purple red hue of the fruits during maturation because of the appearance of pigments such as anthocyanins and carotenoids (García, 2012).
The color change tendency in the harvested fruits was the same; however, significant differences in color intensity were evidenced. The Guasca and Sibate fruits were the most attractive because they had more striking and intense red colors. Terry et al. (2007) demonstrated that an absence of irrigation results in strawberries with a higher concentration of anthocyanin and antioxidant capacity. On the other hand, the fruits from Mosquera and Facatativa presented a lower color intensity, showing lighter and less attractive reds. However, compared to the color scale suggested by NTC 4103 standards, the four municipalities easily meet the minimum requirements for gaining access to a high-quality commercial field.
Conclusions
The sizes, volumes and densities of the fruits measured in the present study were even higher than those proposed by the current standard for gaining access to a high quality fresh trade; however, this may present some drawbacks because of the care that must be taken at the time of packing or storing fruits because of the standard measurements. Large sizes can be very attractive for national and international marketing. These characteristics should be included in the generation of a new standard for strawberry quality in Colombia.
As for the organoleptic characteristics, the fruits with a sugar content were suitable for fresh consumption. However, a market based on industrial transformation requires higher citric acid percentage values. According to this research, this is the only parameter in which more work is needed to improve the minimum levels required by the Colombian technical standard (NTC 4103).
Although the fruits from Mosquera presented favorable results compared to the other producer areas, work is under way to improve the infrastructure and technology applied in order to obtain representative crops with high quality standards that can be used as a demonstration and reference example for the producers of Cundinamarca and, of course, the whole country.


