


 Inglés (pdf)
 Articulo en XML
 Referencias del artículo
 Enviar articulo por email
 Citado por SciELO
  Citado por Google
  Similares en
SciELO
Similares en
SciELO  Similares en Google
 Permalink
Introduction
Heliconia sp. is an herbaceous species of the family Heli-coniaceae that is distributed mainly in Brazil, Colombia, French Guiana, Guyana, Surinam, Trinidad and Venezuela. The genus Heliconia L. grows in neo-tropical habitats in warm protected areas in temperate climates. This genus has an important commercial application because of its ornamental uses, with 93 species preliminarily recognized in Colombia. Heliconia psittacorum grows between 0.5 m and 1.5 m tall, preferably under both full sun and partial shade, with moist and well-drained soil that is rich in organic matter. This tropical species is particularly important because of its use in phytoremediation studies in environments affected by a variety of pollutants, such as Chemical oxygen demand (cOD), nitrogen, Hg+2, Cd+2, Cr+6, and Pb+2 (Madera et al., 2014; Wood, 2015).
The water status of ornamental plants influences their flower production. The water requirement in an irrigation level of the species Heliconia psittacorum (He) varies around 10 cm d-1, depending on the vegetative stage of the crop, the soil type, and the climatic conditions (Sosa, 2013). Water deficiency in plants can cause water stress, resulting in growth inhibition, decreased production, and death (Lisar et al., 2012; Etesami and Jeong, 2018). A plant under wáter stress reduces its photosynthetic activities by decreasing the leaf area and the exchange of gases and by rejecting light energy that is useful for the photosynthetic process; other effects include the inhibition of growth cells, decrease in stomatal opening, mainly caused by an increase in the concentration of gaseous carbon in the leaves, and decrease in the water potential (Akinci and Lösel, 2012; Kögler and Söffker, 2017). Water status is estimated using traditional methods, such as direct measurement, water potential and relative water content; however, it is also estimated indirectly with variables, such as stomatal conductance, photosynthetic activity, chlorophyll fluorescence, and gas exchange (CO2 assimilation and transpiration). The measurement of water potential and relative water content, in general, are destructive and require a lot of time (Farifteh et al., 2013). There is, therefore, an evident need to develop non-invasive and non-destructive techniques that monitor, in real time, the water status of plants and crops.
Remote sensing techniques provide tools to monitor water status, using information on the spectral response of the plants. The first advances in this subject were made in the 1980s with studies on low spatial and spectral resolution, using the vegetation response in bands of the visible spectrum (VIS) and the near infrared (NIR) (Wójtowicz et al., 2016). In recent years, remote sensing techniques have made significant progress because of the development of hyper-spectral sensors, which make it possible to carry out detailed studies of pigment content (Uiboupin et al., 2012; Fan et al., 2014; Li et al., 2015), leaf tissue structure and water content in plants (Shimada et al., 2012; Farifteh et al., 2013; Genc et al., 2013; Ge et al., 2016).
In several studies, the thermal response of foliar tissue of plants and crops has been associated with indirect effects caused by water deficit. The development of low cost thermographic cameras has allowed an important advance in the study of the water status of plants, providing spatial resolution. Because of the alteration in the transpiration and the opening of stomata in leaf tissue, thermal variations are produced that can be measured in images using thermal indices, such as the stomatal conductance index (GI) or the crop water stress index (CWSI). Several studies have found high correlation between thermal indices and measurements of physiological parameters, such as stomatal conductance, water potential and gas exchange (Fuentes et al., 2012; Gómez-Bellot et al., 2015; Yuan et al., 2015; Lima et al., 2016; Mangus et al., 2016). The main objective of this study was to determine variations in the spectral response in the VIS, NIR and Long-wave infrared (LWIR) bands of the He species in response to water stress induced by different irrigation levels.
Materials and methods
Experimental design
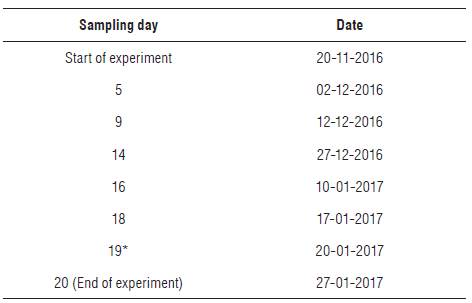
This experiment was carried out in a greenhouse located in the Experimental Station of the Agricultural Water and Soils Laboratory of the Universidad del Valle, Cali, Colombia, where the variables ambient temperature and relative humidity were monitored (average temperature of 24.5°C, 79% relative humidity, and 30% poly shade). Young individuals of the plant species Heliconia psittacorum (He), not more than 0.15 m tall, were taken from a sub-surface wetland of horizontal flow from the was-tewater treatment plant of Ginebra-Valle, Colombia. The plants were acclimated for two months under saturated substrate conditions. The experimental design was completely randomized with one factor (irrigation). Three levels of the irrigation factor were established (100% Field Capacity (FC), 50% FC and 10% FC). The FC value of the substrate was estimated using the sand box method (Jaramillo, 2002). Three treatments were performed with 4 replicates and 12 experimental units (EU). Each EU was an individual of the He species planted in 6 L pots with the substrate, which provided nutritional support, composed of soil with organic fertilizer, to which macro and micronutrients were added according to the requirements of nitrogen, phosphorus and potassium reported by Sosa (2013). Tests of analysis of variances (ANOVA) and Honestly Significant Difference (HSD) of Tukey (P<0.05) were used prior to the normalization and verification of homoscedasticity to determine if there were significant differences between the treatments. The experiments began on November 20, 2016 and ended on January 27, 2017. Statistical tests were performed to evaluate significant differences between treatments on the days shown in Table 1.
Irrigation control
The substrate moisture of each EU was measured using time domain refractometry (TDR) equipment (MPM160 ICT-International, Armidale-Autralia) three times per week at a distance equal to the effective root depth (0.07 m). Each measurement was taken three times in random points, and the average value was recorded. According to the volumetric moisture value of each EU, the moisture of the substrate was adjusted according to each treatment. The FC value of the substrate was estimated using the sand box method (Jaramillo, 2002). All the EUs started at FC; treatments T2 and T3 were drained until reaching the respective depletion level for each group, while T1 was maintained at FC throughout the experiment.
Measurement of spectral reflectance
The leaf tissue reflectance (%) of each EU was measured using an STS-VIS Mini-Spectrometer (Ocean Optics®, Florida, USA). The equipment has a measurement range between 350 and 800 nm, with an integration time of 100 ms and a spectral resolution of 1 nm. The measurements were taken at a distance of 0.05 m from the leaf tissue, between 10:00 am and 12:00 midday. One measurement was taken per leaf in the central part and to one side of the midrib. The calibration was done using the reflectance blank prior to each measurement. A medium low pass filter was used to eliminate high frequency and noise components before the calculation of the spectral indices. The Normalized Difference Vegetation Index (NDVI) and the Variation of NDVI in the range 705-750 nm (NDVI705) spectral indices were estimated using Equations 1 and 2, respectively. The maximum value of the first derivative of the reflectance curve (Dmax) between 700 and 750 nm (Eq. 3) was also calculated:
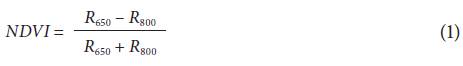
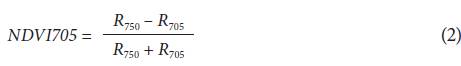
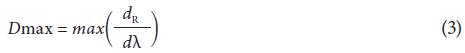
where R650, R705, R750 and R800 are the percentages of light reflected with respect to the calibration blank at wavelengths 650, 705, 750 and 800 nm, respectively (%), and  is the first derivative of the reflectance with respect to the wavelength (% nm-1).
Measurement of thermal indices
The CWSI and GI values were calculated according to the model described by Leinonen and Jones (2004) (Eq. 4 and 5).
where Tleaf is the temperature of the leaf (°C), Twet is the reference temperature of wet tissue (°C) and Tdry is the reference temperature of dry tissue (°C). The temperature measurement was taken with thermographs of each EU, using the FLIR E40® camera (Oregon, USA), with a thermal sensitivity of 0.07°C at 25°C, 160x120 pixels resolution, and a spectral range from 7.5 to 13 μηι. The images were taken at a height of 1.5 m directly above each EU. Two reference temperatures were used: T dry (dry tissue) and T wet (wet tissue). Tdry was obtained by taking 5°C above air temperature (Rud et al., 2014; Mangus et al., 2016). The value of the reference temperature T wet was measured using the most frequent value of the histogram of the thermography in wet leaf tissue. The thermal information of the images (Raw-Data) was exported in the .csv format using the FlirTools© (Oregon, USA). The data were then processed for the calculation of the thermal indices in free software developed by the main author in C++ using image processing libraries from OpenCV2.0.
Results and discussion
Soil moisture
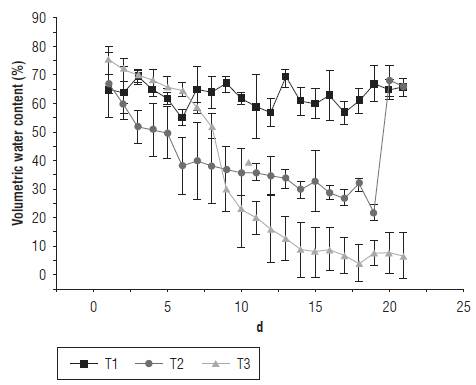
All EU started with the volumetric moisture of the substrate at FC (76% volume content). The substrate moisture was monitored and adjusted three times per week until it reached the values of each treatment T1, T2 and T3. Figure 1 shows the variation of the average substrate moisture (volume-basis) throughout the experiment. On d 19, the moisture of the T2 treatment was restored to 100% FC in order to determine if the changes in the thermal and spectral response of the EUs corresponded to the variation in the irrigation.
Spectral reflectance and spectral indices
The leaf tissue reflectance of the EUs presented the typical response of plant tissue, in which the percentage reflected in the NIR band (around 800 nm) was higher than the percentage reflected in the visible band (400-700 nm). However, it was found that the NIR reflectance for the T2 and T3 treatments was lower than for the T1 treatment. Changes in morphology of the leaf and the structure of the mesophyll have a strong influence on the spectral properties of leaves in this range (Wójtowicz et al., 2016). Decrease in reflectance in the near infrared could occur because of the structural modification of mesophyll, which is possibly related to a strong water deficit (Semenova et al., 2014). Figure 2 shows the average of the reflectance curves for each treatment at d 14 of the experiment. These results are in agreement with those obtained in other species subjected to a water deficit. In a study with Zea mays L., Genc et al. (2013) found similar results for four treatments (100% FC, 66% FC, 33% FC and 0% FC). In the species Spinacia oleracea under water stress, Corti et al. (2017) reported the same effect of a decrease on NIR reflectance measured on green leaves.
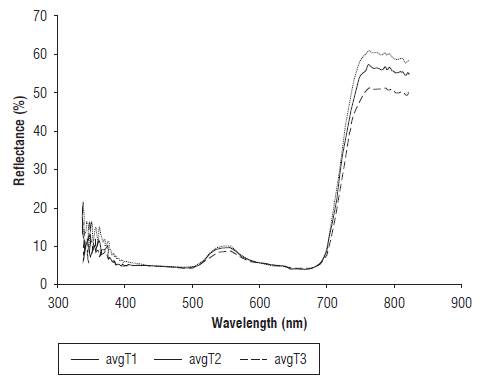
FIGURE 2 Average reflectance for treatments T1 (100% FC), T2 (50% FC) and T3 (10% FC) at d 14 of the experiment.
No significant differences were found (P>0.05) between any of the treatments for the NDVI and NDVI705 vegetation indices (Tab. 2); Shimada et al. (2012) reported that there were no significant differences between the NDVI index and the water potential of the species Hibiscus rosasinensis subjected to water stress. Elvanidi et al. (2017) conducted an experiment to study the water status of Solanum lycopersicum in an environment with a controlled microclimate. They found no significant differences in treatments using the NDVI index. However, the normalized difference indices showed greater sensitivity in changes generated by the structure at the canopy level (Duan et al., 2017), especially when the leaf area index was low and in the face of lengthy follow-up times (Gamon et al., 2013; Morgounov et al., 2014).
The vibrational modes of water molecules have associated wavelengths of 1,405 nm (2v1) and 1,896 nm (v1+v2); some weak vibrations are associated with the bands 1,150 nm (v1+3v2) and 960 nm (v1+4v2), the latter being the weakest (Yang et al., 2011; Steidle et al., 2017). These wavelengths are all outside the range of the spectrometer used in this study. As such, it was not possible to directly associate the spectral indices in this range with the water status of the plants. However, one effect water stress produces is the inhibition of the synthesis of chlorophyll (Lisar et al., 2012; Etesami and Jeong, 2018), a pigment that does have optical activity in the visible spectrum.
Red edge variations
The treatments with a water deficit showed a decrease in the slope between 700 and 750 nm. As a consequence, the maximum value of the first derivative of the reflectance curve (Eq. 3) decreased for T2 and T3. Figure 3 shows the average behavior for d 14 of the measurements in the three treatments.
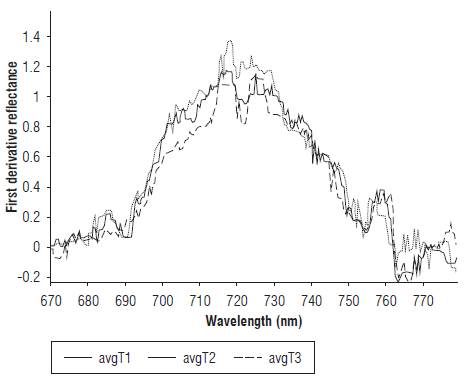
FIGURE 3 First derivative curve of reflectance treatments T1 (100% FC), T2 (50% FC) and T3 (10% FC).
Significant differences were found between the T1 treatment and the T2 and T3 treatments from d 9 of the measurements for values with a significance of P<0.05 (Tab. 2). The inhibition in chlorophyll synthesis in plants subjected to water stress can explain the statistically significant difference in the spectral response in the 700-750 nm range between the T1 treatment and the T2 and T3 treatments. Authors such as Mielke et al. (2012), Dian et al. (2016), and Liu et al. (2016) have considered spectral indices in the red edge band as good indicators of the leaf chlorophyll content of different plant species. Yang et al. (2015) established a correlation model for chlorophyll content that considers the maximum of the first derivative of the reflectance in the range 670-780 nm as one of its variables.

Leaf temperature and thermal indices
The temperature of the leaf tissue was found to increase for treatments with a water deficit (T2 and T3). Figure 4 shows the leaf tissue temperature of the EUs in the three treatments on d 14 of the measurements. The data from 1 to 4 correspond to the EUs of T1, data 5 to 8 to T2, and data 9 to 12 to T3.
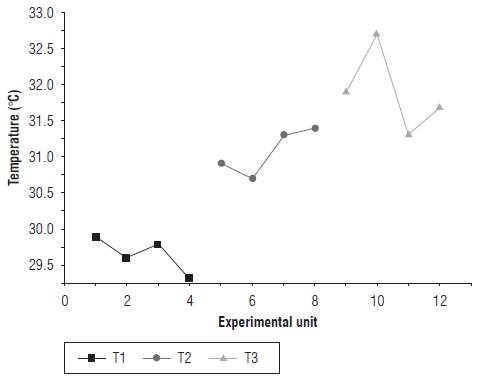
The mean temperature difference between treatments T1 and T3 was 2.2°C, for which there were significant differences. A similar result was presented by Farifteh et al. (2013), who found that the difference between the control group and the treatment with induced water stress was 2.7°C after 22 d, a time period in which significant differences were found between the treatments. The increase in leaf temperature of the treatments with a water deficit may correspond to stomatal closure, a decrease in gas exchange and a reduction in transpiration, which occur in response to low water availability (Lisar et al., 2012; Etesami and Jeong, 2018). All these phenomena, in principle, contribute to a lower water circulation and contribute to a process of raising the temperature of the tissue since the rate of heat transmission to the environment is reduced. Authors such as Lima et al. (2016) correlated measurements of stomatal conductance (gs) and transpiration (E) with increased leaf temperature. The above is valid if it is assumed that leaf temperature is not strongly influenced by variations in wind speed, resistance to heat flow and vapor pressure deficit. In this way, the stomatal resistance model described by Jones (1999) has an inverse relationship with leaf temperature, which would explain the relationship between leaf temperature and a possible stomatal closure resulting from water stress.
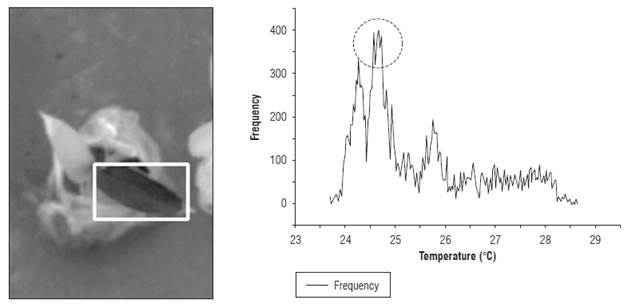
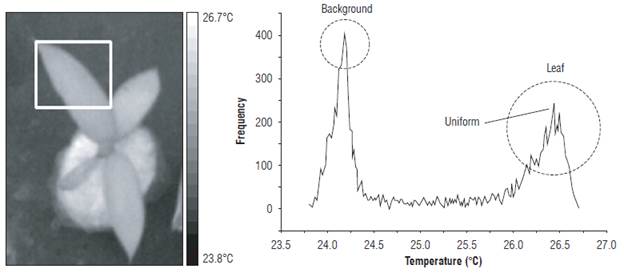
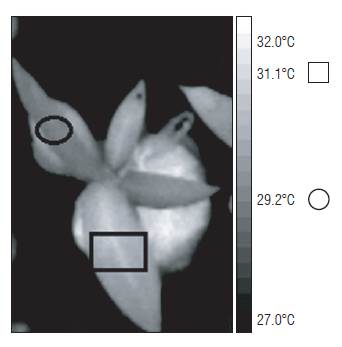
The T wet reference was calculated using the most frequent value of the histogram in the region of interest (ROI). Figure 5 presents the ROI for measurement of the Twet and its histogram. The circle shows the most frequent value of the histogram of the ROI temperature field. Similarly, the leaf temperature of the EUs was estimated with the temperature image.
The CWSI and GI showed significant differences between the T1 treatment and the T2 and T3 treatments. After restoring irrigation to FC for T2, no significant differences were obtained between T1 and T2, which shows that the thermal response of the leaf tissue of the EUs was influenced by the irrigation levels (Tab. 2). Figure 6 presents the estimated thermal indices for the thermographs taken for the three treatments on the 14th d of experiment.
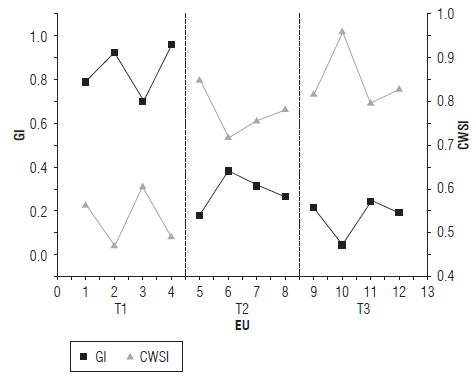
The CWSI and GI made it possible to obtain greater statistical differentiation between the T1 treatment and the T2-T3 treatments than the NDVI, NDVI705 and Dmax spectral indices studied in the 350-800 nm range (Fig. 7).
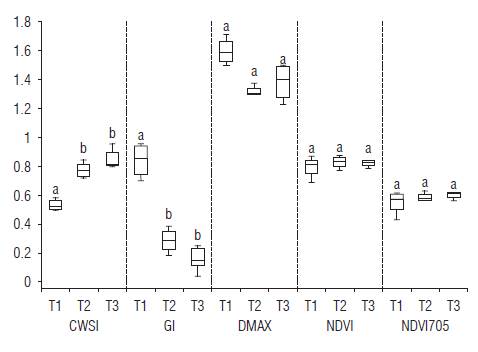
Figure 8B shows the histograms associated with the ROIs of the thermographs shown in Figure 8A, taken on experiment d 14. Information was obtained on the thermal indices of the plant species for each pixel associated with the leaf tissue of the EUs using Equations 4 and 5, whose gray level is proportional to the value of the index in each pixel (Fig. 8 C and D).
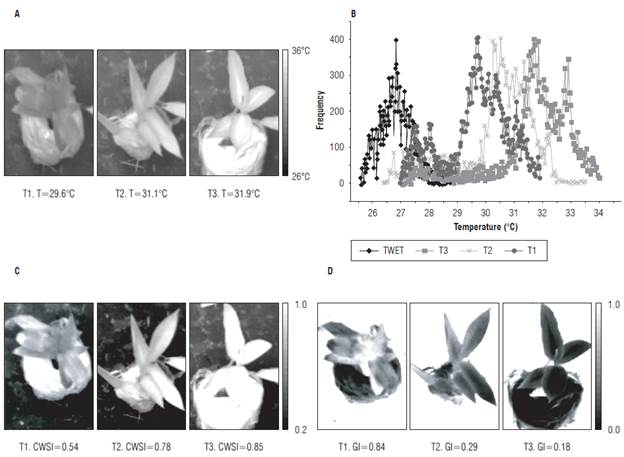
FIGURE 8 Thermal response of He to induced water stress in treatments T1 (100% FC), T2 (50% FC) and T3 (10% FC). A) Gray scale image of the temperature of the experimental units, B) Thermography histogram, C) Gray scale image of the CWSI thermal index, and D) Gray scale image of the GI thermal index.
From the image analysis, it was found that the higher intensity values in the CWSI images and the lower intensity values in the GI images were associated with the treatments with a water deficit. Similar results were found by Rud et al. (2014), Gómez-Bellot et al. (2015), and Bellvert et al. (2014). The EUs of the T2 treatment, once they were taken to field capacity, had higher stomatal conductance indices and lower water stress indices than those seen when there was a water deficit (Fig. 9).
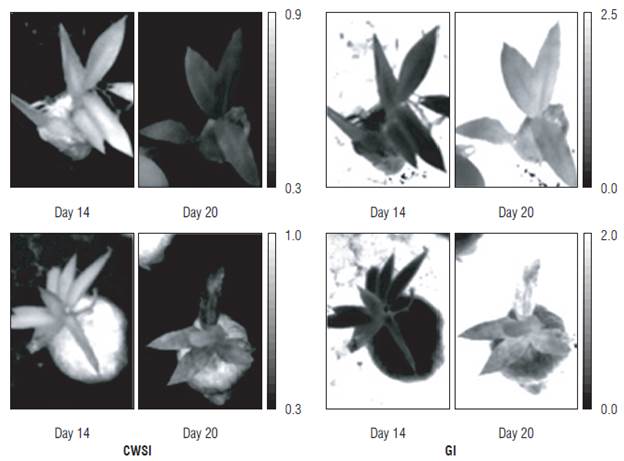
FIGURE 9 CWSI and GI thermal indices of two experimental units of treatment T2 before (d 14) and after (d 20) restoring the moisture of the substrate to field capacity.
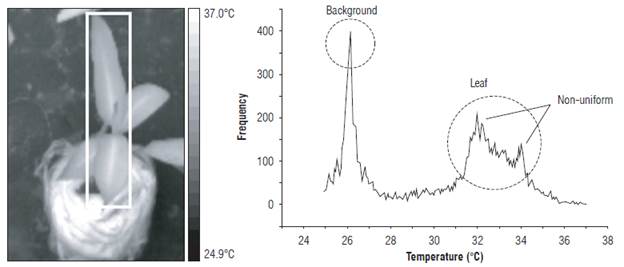
It was also found that the response of the plants to a water deficit was not uniform. It was observed that the EUs under a water deficit showed an increase in leaf temperature, an increase in the CWSI and a decrease in the GI, initially in the central part and then spreading to the rest of the leaf. Figure 10 shows an EU with a water deficit and non-uniform temperature field, in which the histogram did not have a single defined maximum. Figure 11 shows a control EU and uniform temperature field. The associated histogram had a single maximum in the area of the leaf. The evidence shows that, under water stress, plants have an anisotropic warming in the tissue of their leaves, which, as mentioned above, would be related to the characteristic of thermal instability when there is a low rate of evapotranspiration and stomatal closure as a physiological state of response to water stress.
Faced with an increase in temperature, the plants showed temporary wilting as a natural adaptation mechanism, decreasing the effective area and the temperature in the leaf tissue (Fig. 12).
The CWSI and GI made it possible to differentiate the EUs at FC and those subjected to a water deficit because of the fact that they have a relationship with the thermoregulation affected by variations in transpiration and gs, which, in turn, is associated with the water status of the plant. Bellvert et al. (2016), Egea et al. (2017) and Santesteban et al. (2017) found a relationship between thermal indices and gs. Figure 13 shows the average value of the thermal indices between d 5 and 20 for each treatment. For d 19, the moisture was restored to FC for T2.
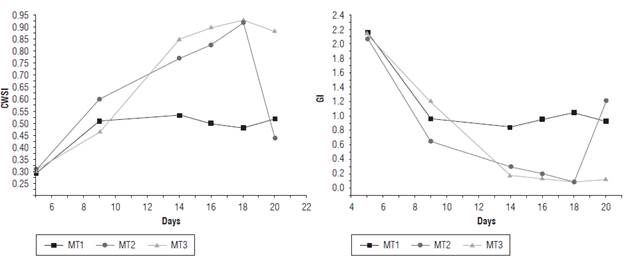
The maximum values of the CWSI index were associated with the treatments with a water deficit, which is related to the tendency of leaf temperature to approach the reference temperature, inhibiting the transpiration process. On the other hand, the maximum values associated with the GI were related to the EUs at FC. This corresponds, according to Equation 4, to the tendency of leaf temperature to approach the reference temperature, favoring the process of perspiration. The CWSI went from a mean value of 0.9 for d 18 to 0.45 for d 20, after resetting the moisture of the EUs of T2 to FC. Likewise, the GI went from an average value of 0.1 to 1.2, showing that restoring irrigation in the EUs of T2 favored stomatal conductance and decreased water stress in the plants.
Conclusions
The CWSI, GI and Dmax variables showed significant differences between T1 and T2-T3. The thermal indices offered a greater capacity for statistical discrimination between the treatments.
The CWSI and GI were successful indicators of the effect on transpiration caused by the water status of the He species. The thermal response in the leaf tissue, when faced with variations in the water status was not uniform for the He species. The imaging technique was, therefore, a valuable tool because it provided sufficient spatial resolution to evaluate the response of the plants.
The spectral measurements in the range 350-800 nm did not allow for evaluation of the water status of the He species directly. Secondary effects, such as chlorophyll content or changes in the mesophyll structure, may be associated with variations in this range. The NDVI and NDVI705 did not present significant differences between the treatments; however, the maximum value of the first derivative of the reflectance in the 700-750 nm range showed significant differences between the treatment at FC and the treatments under a water deficit.
The thermal imaging technique allowed us to estimate the variations in the transpiration capacity of the He species in the face of variations in its water status in a non-invasive way, and, for future studies, it is suggested that an automated thermography processing system be implemented for the calculation of thermal indices in real time. This technique would thereby be strengthened compared to conventional measurements.
Important fieldwork would look at the role of thermal regulation that the evapotranspiration process plays on the receiving surfaces of direct solar radiation (i.e., leaves) and how thermal equilibrium is a necessary condition for good physiological performance, which, in turn, is related to the water state or the adequate presence of water in the substrate.


