


 Inglés (pdf)
 Articulo en XML
 Referencias del artículo
 Enviar articulo por email
 Citado por SciELO
  Citado por Google
  Similares en
SciELO
Similares en
SciELO  Similares en Google
 Permalink
1. INTRODUCTION
Due to the inability to perform measurements on each node of a network of primary distribution, to characterize the loads it feeds during the analysis of these networks different modeling methods have been developed to get as close as possible to their real values, as being the load the most influential elements in the results of a study in these circuits. The methods developed are generally based on the determination of the characteristic behavior of groups of customers, classifying them into layers, starting from the sum of the load curves of the clients associated with a distribution transformer to obtain the characteristic of the load on the node primary network [1], [2]. Such an approach is presented in reference [3] to a study of the behavior of residential, industrial and commercial customers by field measurements and through a methodology for the addition of load curves to determine the expected load on a part of the distribution network. A similar analysis is presented [4] specifically for industrial customers, where statistical methods are also used to determine the variations of the parameters of the curves of daily and monthly load stations.
Another approach used is to consider that residential loads can be made from any possible and relevant equipment, a given power demand, the frequency of use and the operation time, as a potential correlation equipment through a synthetic probabilistic time series [5]. An element to consider in the evolution of techniques of customer classification and load profiling is the incorporation of the infrastructure of automatic measurement AMI that permits obtaining measurements in real time [6]-[8]. One of the most developed directions is the use of clusters techniques for customer classification [7], [9], [10]
The use of artificial intelligence has also been treated as a tool for the stratification of load curves using fuzzy cluster techniques (Fuzzy K-Means), Self-Organizing Maps and Artificial Neural Networks [11]- [13]. However, all these methods only allow the establishment of a standard curve, usually per unit, by customer type. To determine the load curve of the distribution transformer, it is not only necessary to know the characteristic of each type of customer but also the number of customers in each layer associated with it and their maximum demands.
In the articles consulted load curves are treated as a perfect Gaussian and parametric statistics is used, which is based on the assumption that random samples were selected from populations that follow a normal distribution, but this is not the case of the load curves because customers do not have a normal distribution and their behavior is given according to each client's customs; for this reason a new approach from nonparametric statistics for the characterization of customers is proposed, since this is responsible for the study of samples that often do not pose any knowledge about the distributions of key populations, except if they are maybe continuous.
2. METHODOLOGY
Based on the fact that most of the loads analyzed in the study are of the residential type, there is no mistake considering the high probability of coincidence of the peaks of customers (85-90%) thus the sample size can be determined by equations (1) and (2):
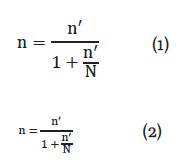
Where:
p: Probability of coincidence of the peaks.
se: Standard error.
N: Population size.
Considering the probability of coincidence of the peaks equals 0,9 (p=0,9) with a standard error of 0,05 (se=0,05) a statistically and significant sample is obtained from the total study population, which will be 36 customers, a value lower than the value samples taken from this study (52 customers).
A. Kendall matching coefficient (W)
Within nonparametric statistics there is a very important factor that measures the degree of association between various sets (k) of N entities. It is useful to determine the association between three or more variables utilized in several areas of knowledge like the economy, the evaluation of risks or medical studies [14-16]. This factor is called Kendall concordance coefficient and it is expressed by equation (3).
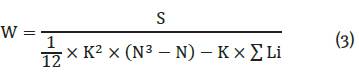
Where:
W: Kendal matching coefficient.
S: Sum of the squares of the differences observed with respect to an average. N: Sample size.
K: Number of variables included.
Li: Sum of links or ties between the ranges.
The value of W ranges between 0 and 1. The value of 1 means a concordance of all agreements and zero total disagreement. This coefficient is calculated to see the degree of similarity between all residential customers (110 and 220 V) which were most of the measurements performed. If the calculus of the coefficient might provide a value above 0,5 (≥0,5 W), it is assumed that there is an acceptable similarity between customers of that layer, hence the average curve is taken as the characteristic of this layer, otherwise (W <0,5) does not have a desired similarity and then customers are separated in two groups, by voltage levels such as residential consumers can be separated into two groups by voltage levels, one for which their average consumption is above the ensemble mean and another for those who consumed below the average.
The corresponding calculations yielded the following results shown in Table 1:
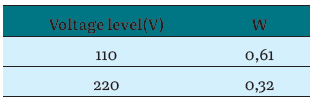
As seen in the case of customers 220V Kendall matching criterion is below the target, therefore as indicated above customers are separated based on their average consumption. After this is done, the calculation of W starts, resulting in a level even lower than that of the whole (W xupward =0,271 and W xdownward =0,269) match, which leads to the conclusion that the set curve is much more accurate that the ones separated by average consumption.
B. Spearman Correlation Coefficient Rank (rs)
This ratio is used to compare the curve resulting from the sum of the characteristic curves obtained in the circuit under study measurement on a time period for the already-mentioned circuit.
Spearman correlation coefficient rank is used which is a measurement of association that requires both variables to be measured, at least, on an ordinal scale, so that the objects or individuals being studied can be placed in two ordered series [17], [18].
To calculate rs , a list of N subjects is made. After each subject is registered, its range is entered in the variable X and variable Y
Now different values are defined below, the difference between the two ranges (di =Xi -Yi).
Each is squared and all its values are added.
The value of the sum of the previous step and N (number of subjects) is replaced directly in equation (4).
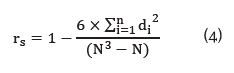
Similar to Kendall matching coefficient rs value ranges between 0 and 1. The closer it is to one, the bigger the similarity between the variables compared will be, the opposite will occur when the value is close to zero.
The ranges are determined by organizing joint variables ascending and assigning value to each of its place within the total set.
3. RESULTS AND DISCUSSION
For the database to be used, a network analyzer was placed in different points of the circuit C-41 of the city of Camaguey, taking the consumption of various types of electricity customers (mainly residential) over a period of 11 days. The instrument took samples every second of different electrical parameters.
To obtain data curves the measurements made for each type of client were processed, the active (P), reactive (Q) and apparent powers (S) were averaged at intervals of 15 minutes.
The characteristic curves are determined by adding all the curves of the measured customers [19] of the same layer and it is divided by the number of customers, as shown in equation (5).
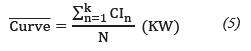
Where:
CI: Individual clients
N: Number of clients
After this curve is obtained, it is divided by its maximum value to obtain the curve per unit (p.u) that will be the load curve characteristic of each consumer. This characteristic load curve will remain in the database of the electric company so they can make predictions and studies related to the loads they provide service with.
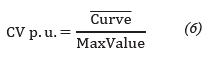
Bearing load curves characteristics of each client, if you want to know the actual behavior of any client, just multiply the maximum value of that customer demand for the characteristic curve (in p.u) that corresponds.
A. Comparison of the result
Using Spearman correlation coefficient rank, the curve resulting from adding up all the characteristic curves obtained was compared with the load curve measured in the C-41 circuit, yielding satisfactory results considering the criteria explained about this coefficient. The level of correlation between these two curves was 0,855.
For greater certainty that the results obtained were correct, it was decided to make the same comparison but in another circuit of the same city, the C-31. For this aim, the characteristic curves of customers from C-41 that coincided with this one were taken as reference.
For the types of consumers that did not match the sample taken for the study on circuit C-41, existing curves in other databases of the utility were taken and the results were equally satisfactory. The Spearman correlation coefficient rank in this case was 0,973.
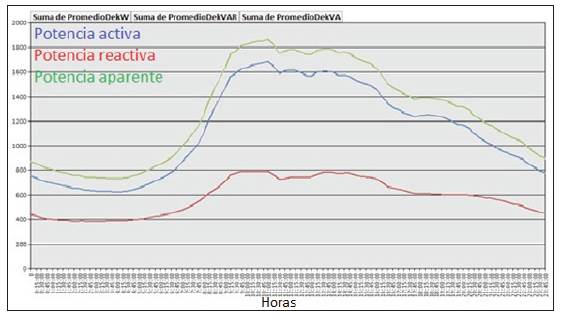
The results of the comparison are shown in figures (1), (2), (3) and (4).
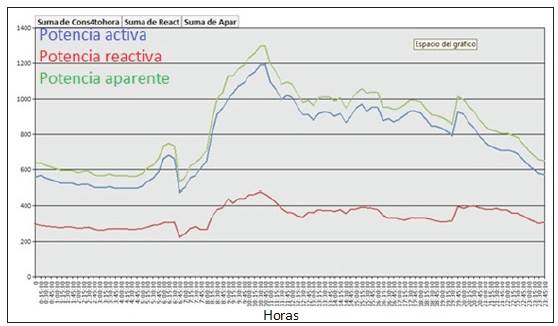
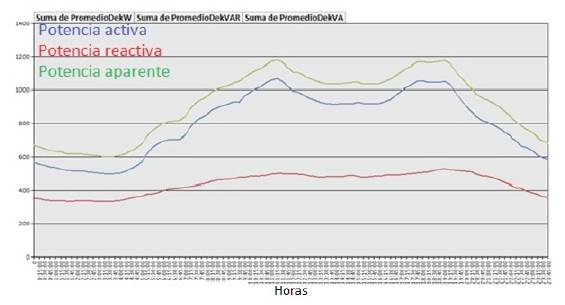
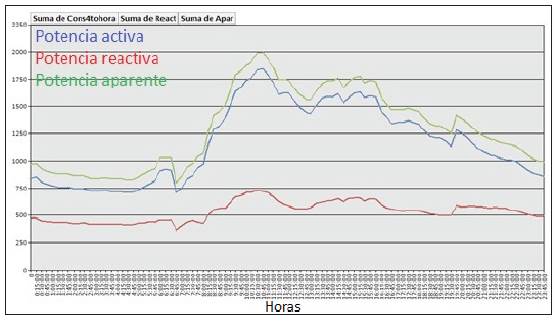
In regards to circuit C-41 both curves show the same peaks, differing in the fact that the peak of the late afternoon/evening of the measurement curve is bigger. The behavior of this circuit is like this because although there are a considerable number of commercial customers with a high consumption mainly between 9:00 and 16:00 hours, they also have a significant number of residential customers, which make a well-defined peak consumption in the afternoon.
In C-31 circuit both curves show a sustained peak form 9:00 to 16:00 hours, tending to decrease in the curve resulting from the sum of the customers. Such a peak consumption is caused by the influence of connected commercial consumers to the circuit, which virtually lead their behavior since they have a higher weight in the load and also because on it there is no influential residential representation that can significantly raise the consumption in the peak hours in the afternoon.
4. CONCLUSIONS
The current statistic approaches for the characterization of consumers in distribution networks are based on parametric statistics, however the different layers of costumers do not correspond to a normal distribution and their behavior differ, at first, depending on the habits of each client, it makes nonparametric statistics to be suitable to use in this case.
The method shown using the Kendall matching coefficient is characterized by its simplicity and effectiveness to measure the degree of association of different sets, in this case, of the load curves obtained by sampling the layers from networks of distribution in which customers are classified.
The obtained results support the above statement with Spearman coefficient correlation ranks made possible to corroborate the similarity between the curve obtained by the method proposed and the one obtained by measurements in the distribution substation.
The robustness of the method was found when inducing the results of the curves obtained in C-41 to circuit C-31 where a high degree of similarity is found, as shown by Spearman correlation coefficient ranks between the sum of the load curves from the customers' circuit and the load curve measured at the distribution substation.

