


 texto en
  Inglés (pdf)
 Articulo en XML
 Referencias del artículo
 Enviar articulo por email
 Citado por SciELO
  Citado por Google
  Similares en
SciELO
Similares en
SciELO  Similares en Google
 Permalink
Introduction
The rubber tree Hevea brasiliensis (Willd. ex A. Juss.) Müll. Arg. (Euphorbiaceae) is a perennial plant of tropical origin, cultivated and used by an extractive industry of natural rubber production (Campelo-Júnior, 2000). Its economic exploitation is based on rubber tapping for latex extraction. When the latex vessels of the bark are reached, natural rubber is released (Rajagopal, Vijayakumar, Thomas, & Karunaichamy, 2004). In commercial planting, in general, grafting is the most commonly used method in the propagation of seedlings, aiming to maintain the genotypic integrity of the clones (Cardinal, Gonçalves, & Martins, 2007a).
The interaction between the GT 1, IAN 873, PB 235, RRIM 600, RRIM 701 rootstocks and unselected seeds influenced the production of dry rubber of the grafts/crown in the clones GT 1, IAN 873, PB 235, PR 107, RRIM 600 and RRIM 701 (Cardinal, Gonçalves, & Martins, 2007b). To date, research detailing this relation from the point of view of root metabolism have yet to be conducted. Therefore, based on the aforementioned interaction, the roots of the rootstock may probably be influenced by the graft and, consequently, reflect on the infestation of soil pathogens.
The rubber tree cultivated in monoculture has become a species that is vulnerable to various micro-organisms, such as the fungi Microcyclus ulei, Colletotrichum gloeosporioides and C. acutatum, Oidium hevea and Tanatephorus cucumeris (Furtado, 2010), and the root-knot nematode - Meloidogyne exigua (Santos, 1995). Species of the genus Meloidogyne are characterized by the induction of roots thickening, denominated “root-knot galls”, resulting in low seed production, reduced growth, withering and increased susceptibility to other pathogens (Randig, Bongiovanni, Carneiro, Sarah, & Castagnone-Sereno, 2002). In Brazil, the most important pest species for the rubber tree is M. exigua Goeldi (Santos, Matos, Barré, & Ferraz, 1992). Muniz et al. (2008) classified this nematode into three races; race 1: infects bell peppers and coffee trees; race 2: infects tomato plants, bell peppers, and coffee trees; and race 3: parasitizes rubber trees only. Since the nematode population has a clustered distribution (Ferris & Wilson, 1987), the geostatistical methodology may be used, in which the main principle is that, theoretically, samples that are close in time and space will be more similar to each other than those which are distant (Isaaks & Srivastava, 1989). Geostatistics go through the following steps: 1st - experimental variogram survey; 2nd - adjustment of variograms and cross-validation of the model to be used for kriging; 3rd - interpolation by the kriging method (Landim, 2006).
The spatial distribution of nematodes is influenced by the presence of food and is determined by the plant physiology of the host (Yeates, 1987). Spatial analyses of nematodes have been carried out by Webster and Boag (1992), Wallace and Hawkins (1994) and Farias, Barbosa, Vieira, Sánchez-Vila and Ferraz (2002), in which the results demonstrated a spatial relation between populations. The present study aimed at conducting the analysis of the infestation of M. exigua race 3 in commercial rubber tree plantations and, subsequently, at finding the spatial distribution of the population on crown roots of clones GT 1 and RRIM 600, in two periods of the year.
Materials and methods
Area of study
The area of study is located in the municipality of Itiquira, Mato Grosso do Sul, Brazil, in a total area of 6,646 ha planted with 22 rubber tree clones, aged between 12 and 34 years in 2013, with the geographic coordinates of 17°17'40,29" and 17°26'17,73" south latitude and 54°44'28,6" and 54°44'43,55" west longitude in the Paraguay River basin. After mapping the population of nematodes in all 22 clones, the total map was cut based on the plots of the clones GT 1 and RRIM 600. The clone/graft GT 1 represented a total area of 1,529 ha (May) and 1,441 ha (November); the RRIM 600 represented 880 ha in the two months. The soil of the site is classified as typic Dystrophic Red Latosol - LVd, as reported by the Brazilian Agricultural Research Corporation (Empresa Brasileira de Pesquisa Agropecuária [Embrapa]) (2013). According to Köppen (1923), the climate of the region is classified as Aw with a dry winter between June and August. Due to the history of infestation by the nematode M. exigua race 3, the purpose of evaluating the plantations was to examine its populational level in the studied clones.
Sample collection and nematological analysis
Sample collection was determined based on the phenology of the plant during the year. In May, the plant is ending the period of maximum productive potential, and this month precedes the annual natural defoliation of the plants, which regionally occurs between May and July. The rainy and warm period of the year before May might favor the increase in the population of nematodes. In November, the period after natural defoliation, the plant is completely refoliated, and the population of nematodes is possibly reduced.
In the months of May and November of 2013 264 and 227 sampling points were collected, respectively, for the 22 grafts, and these data were used for the interpolation by kriging. The number of sampling points of the clone GT 1 was 29 in May, and 27 in November, and the number of samples for RRIM 600 was 26 in May, and 25 in November. The rootstock clones were not identified. The sampling points were distributed throughout the experimental area in an irregular grid, due to infestation occurrence over the entire planting area. At each sampling point, rubber tree roots were collected at a depth of 0.10 m. For each sampling point its location and definition was recorded using a GNSS device with precision of 4 to 5 m, datum WGS 84, zone 21 South, and projection UTM.
Nematological analysis of the root samples was performed according to the methodology proposed by Coolen and D’Herde (1972), considering the number of individuals in 10 g of roots. After the samples were processed, the nematodes were determined in Peters counting chamber, and the population in the sample was estimated proportionally to the suspension volume in the total sample.
Statistics and geostatistical analysis
Descriptive statistics of the nematodes infestation data was carried out, where the mean, the standard deviation, the sample variance, the coefficient of asymmetry, and the kurtosis were calculated. Castrignanò (2011) stated that if the data presented a positive coefficient of asymmetry and greater than or equal to 0.5, they should be transformed.
Subsequently, the variographic data analysis was conducted based on the intrinsic hypothesis and is presented in equation 1, according to Vieira, Hatfield, Nielsen and Biggar (1983). For this purpose, the adjustment of the experimental and theoretical model was carried out, and the variogram component values were obtained: range (a), sill (C0 + C), structural component (C), and nugget effect (C0) (initials follow Portuguese text).
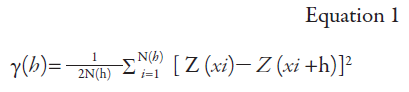
Where: γ (h): estimated semivariance between point pairs; N(h): number of pairs of measured values; Z(xi), Z(xi + h): pairs of points separated by a distance h.
Interpolation, by means of ordinary kriging, was conducted for the total area (6,646 ha in May and 5,604 ha in November) disregarding the clone differences between plots. According to Landim and Strabo (2002), ordinary kriging uses information from the variogram to find optimal weights to be associated to the samples with known values that will estimate unknown points. For ordinary kriging, the calculations described in equations 2 and 3 were performed according to Thompson (1992):
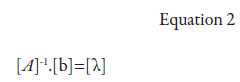
[A]-1: semivariance inverse matrix between the localities of a point’s vicinity, determined by the variogram model based on the Euclidean distances between localities; [b]: semivariance matrix between neighboring localities (with the estimated variable) and the point at which the variable will be interpolated, which is also determined by the variogram model, based on the distances between neighboring localities and the point to be interpolated; [λ] - kriging weight matrix.
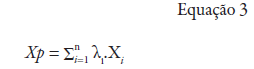
Xp: interpolated variable; λ1: i-th weight of neighboring locality; Xi: variable value for the i-th locality; n: number of neighboring localities used for point interpolation.
Finally, the spatial distribution map of M. exigua race 3 in the total area was elaborated, and plots with clones of interest were cut. The infestations of nematodes in this study were divided into five categories, the largest infestation interval ranged from 0 to 100,000 and was distributed into four categories, and the interval from 100,000 to 200,000 nematodes comprised the last category. Due to the high populational level found in all clones in both periods of the year, different populational classes were placed into the following categories: I (0 to 25,000 nematodes), II (25,001 to 50,000 nematodes), III (50,001 to 75,000 nematodes), IV (75,001 to 100,000 nematodes), and V (100,001 to 200,000 nematodes), with a unit of nematodes in 10 g of roots.
Results and discussion
Descriptive analysis
The results of descriptive statistics for M. exigua race 3 in the months of May and November of 2013 are shown in table 1. The mean (m) infestation found in May was 41,401.21 nematodes, while in November it was 5,566.737 nematodes (table 1), demonstrating a sharp drop in population, a fact explained by rubber tree annual defoliation, called “hibernation” by Moraes (1982). The water deficiency that occurs during the hibernation period also influences infestation, as it affects the metabolism of the nematode and the root system of the rubber tree.
Table 1 Descriptive analysis results for the infestation of M. exigua race 3 in the months of May (05) and November (11) of 2013
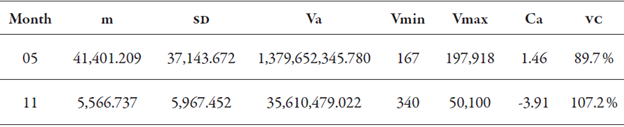
m = mean; SD = standard deviation; Va = sampling variance; Vmin = minimum values and Vmax = maximum values of nematodes in 10 g of roots; Ca = coefficient of asymmetry; VC = variation coefficient.
Source: Elaborated by the authors
The variation coefficient (VC) found in May was 89.7 %, and in November it was 107.2 %. These values demonstrate the increased amplitude of specific infestations found in those months. The coefficient of asymmetry of the data in May presented a positive value, greater than 0.5, and the transformation in log x was applied. In November, the coefficient of asymmetry presented a value of - 3.91; therefore, there was no need to transform the data. The methodology of Castrignanò (2011) was used for the two months.
Cross-validation of the estimations
This data analysis was carried out to later choose the best adjustment and to perform the interpolation by kriging. According to Isaaks and Srivastava (1989), the function of cross-validation (CV) is to evaluate estimation errors by comparing the estimated values with the sampled ones (coefficient of determination − R2). In this way, a certain value at a given geographical point is temporarily discarded from the dataset and, at that location, its value is estimated by kriging using the remaining samples.
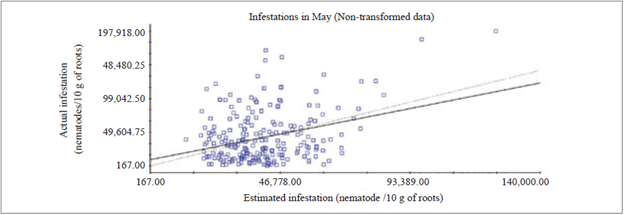
In May, raw data was used because it was not possible to adjust the variogram with the transformation into log x. When using the raw data, there were many discrepancies found between the estimates, due to the high amplitude of infestations - the factor responsible for the low coefficient of determination - R2 = 0.104 (figure 1) of CV and with a value of the coefficient of regression equal to 0.805.
In November, the data used for the CV was transformed into log x to adjust the variogram, since it was not possible to perform the adjustment with raw data. For the CV, a value of R2 = 0.109 was obtained, which was considered low due to the large amount of estimated values that were discrepant in relation to the actual infestation (figure 2), and the value of the coefficient of regression was equal to 0.618.
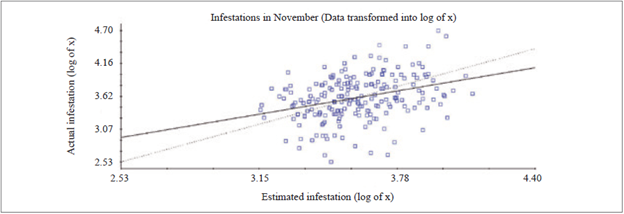
Cross-validation of May and November data demonstrated the discrepancy between estimated and actual infestation data, since a certain percentage of the data estimated by kriging was lower or higher than the real infestation value (figures 1 and 2). This fact might be correlated with the high values of the VC, with 89.7 % and 107.2 %, in May and November, respectively (table 1), because within the same crown clone there were very high infestation intervals that, consequently, hinder cross-validation.
Variographic analysis
For the months of May and November, the models used were exponential and spherical, respectively. Although the coefficient of asymmetry (Ca) for May had a value of 1.46 (table 1) that culminated in the data transformation, this transformation was not considered since the variogram did not have an adequate adjustment when the transformation was applied. Therefore, the variogram for May was obtained considering the original data (table 2).
Table 2 Variographic analysis of the infestation of M. exigua in May and November of 2013
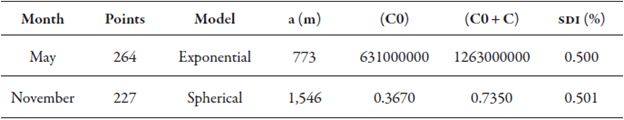
May: data was not transformed into log of x; November: data transformed into logarithm. a = reach; C0 = nugget effect; C0 + C sill; SDI (%) = Spatial Dependence Index
Source: Elaborated by the authors
Among the variogram’s components, the range (a) of May and November was 773 and 1,546 meters, respectively. The smallest range was in May (table 2), and the most accepted explanation is that this is due to the wide interval of infestation in neighboring points. In other words, geographically close locations had populations with high variation, higher than 10,000 individuals in 10 g of roots between two neighboring samples, which is reflected in the descriptive statistics data listed in table 1.
In November, the infestation difference between close points was lower than in May because a significant percentage of the samples, 87.23 % of the infestations found in November, ranged from 0 to 10,000 nematodes in 10 g of roots. Under the experimental conditions in the evaluation, the samplings performed at more than 773 meters, in May, and at more than 1,546 meters, in November (table 2), were not influenced by the distance between them and, consequently, were not considered in the preparation of the final infestation map.
In the variographic analysis, the range found (773 m in May and 1,546 m in November) indicate that the higher the population of M. exigua race 3, the greater the influence on the spatial analysis of the infestation, since this variogram’s component (range) has significant importance, as stated by Journel and Huijbregts (1978). These authors described that, in the interpolation by kriging, the distance between sampling points has considerable influence on the degree of statistic reliability on variographic modeling.
In the present study, the nugget effect (C0) was high and may be explained by the distance between the collected points, which presented a high footage, where some were higher than 10 km. This occurred due to the plantation extension, where the distance between the plots’ edges of clones GT 1 and RRIM 600 reached 13.05 km. Another factor that may have influenced the nugget effect is the high amplitude of infestations data.
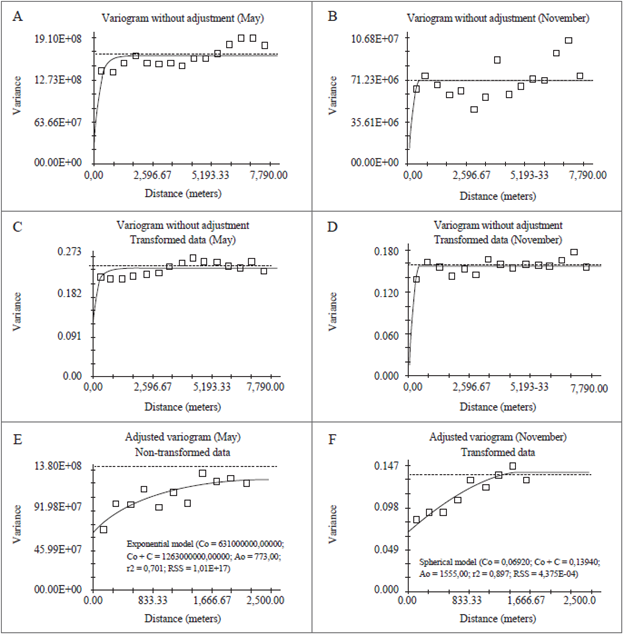
The nugget effect (C0) of 45.45 % and 54.57 %, in May and November, respectively, indicate that the site effect was almost equal to the data randomness (figures 3E and 3F). These percentages show that, in future sampling in the same area, it is recommended to perform the sampling grid with smaller distances between the points to obtain a measurement that is closer to the actual infestation, thus obtaining more accurate results. According to Landim (2003), the nugget effect occurs due to uncontrollable factors, such as measurement errors and data collection that is not carried out in smaller spaces, without obtaining a real diagnostic of the phenomenon spatial behavior.
Source: Elaborated by the authors
Figure 3 Variograms without adjustment and with data without transformation: Variogram - May (A) and November (B); Variograms with data transformed into log of x - May (C) and November (D); Adjusted variograms in May (E) and November (F).
In November, the logarithmic transformation of the data fitted in a satisfactory interval, adjusting the variogram with the data in log x (figure 3F). For the months of May and November, the models used were exponential and spherical, respectively. The spherical model presented adequate use, as noted by Trangmar, Yost, Wade, Uehara and Sudjadi (1987) and Paz, Taboada and Gómez (1996), being the most recommended to demonstrate the behavior of the variograms of plant and soil attributes, as found in the present study (table 2). Webster and Boag (1992) verified that the spherical model best represented the spatial distribution of the nematodes Heterodera avenae and Globodera rostochiensis. Wallace and Hawkins (1994) also used the spherical model for infestations of the nematodes Tylenchorhynchus spp. in forage grasses.
The sill (C0 + C) of November presented a stabilization of the variographic model that is closer to the sampling variance (s2) than that of May, since the data had not been transformed into log x and exhibited a high nugget effect. The sill demonstrates the distance between sampling points which have influence over each other, as found by Vieira (2000); in other words, when the distance between sampling points increases, variance also increases up to a maximum value at which it stabilizes.
Cambardella et al. (1994) stated that the sill (C0 + C) has importance in determining of the range (a); that is, it is a component that limits the spatial dependence and independence between the samples (samples with and without influence over each other). The radius used in the kriging procedure was 2,319 meters and 1,546 meters for the infestation in May and November, respectively. In this calculation, the maximum number of neighboring samples used for interpolation was 16, yet it is possible that fewer samples could be present according to the geographical region of the geostatistics calculation. Thus, the maximum range of the stationary effect of the infestation phenomenon by M. exigua race 3 was reached.
The Spatial Dependence Index (SDI) exhibited values of 0.500 % and 0.501 % (table 2) in May and November, respectively, in which, according to the classification of Zimback (2001), the SDIs found were moderate. The variograms without adjustment, with non-transformed data, and data transformed into log x (figures 3A, 3B, 3C, 3D) were obtained using distances between sampling points equal to 7,790.00 m between samples and a calculation interval between sampling points of 519.00 m, for the months of May and November.
Spatial distribution of infestation
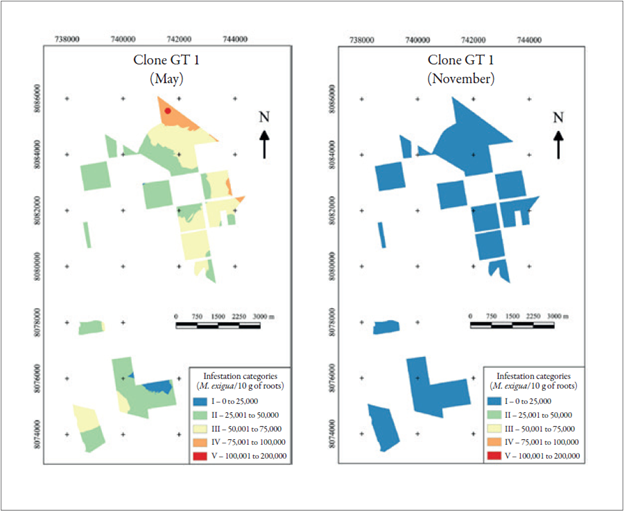
The spatial distribution map of the infestation in clone GT 1 showed the maximum population with 159,840 nematodes (colored red on the map) and the smallest population with 2,640 nematodes M. exigua race 3 (colored blue), both in the month of May. In November, the population was classified only during the first class of the infestation, colored blue, between 0 and 25,000 nematodes, ranging from 300 up to 13,860 nematodes (figure 4).
Source: Elaborated by the authors
Figure 4 Infestation mapping of the clone GT 1 in May and November.
In an evaluation in May, clone GT 1 showed data that is similar to that presented by Bernardo et al. (2003), in which they found an infestation of 61,824 juveniles of M. exigua in 5 g of roots in an unidentified clone in a survey carried out in the municipality of São José do Rio Claro, MT. Between May and November, there was a 91.41 % drop in average infestation. The smallest population was found in November, and the most acceptable explanation for this drop is the rubber tree hibernation, when it ceases or reduces its root metabolism. Soong (1976), in an experiment in Malaysia, indicated that root development varied seasonally at different depths. In the topsoil, the largest growth was during the plants’ natural refoliation period, after hibernation (February and March), and the smallest development occurred before the annual natural defoliation (August to December). For the conditions of the present experiment, a similar situation may have occurred, changing only the hibernation months (May to July), which may have favored the reduction of infestation due to the smaller root system.
During the rubber tree hibernation period, part of the plants’ roots die, followed by the reduction of the population of M. exigua race 3. After the refoliation of the plants, the roots that remain alive, infested with M. exigua nematodes that are in a latent stage in the soil, become inoculum sources of new infestations. Additionally, the new juveniles that developed from eggs, stimulated by the presence of favorable conditions (humidity and root exudates), start to infest the roots that grow after hibernation. In that way, the population of nematodes begins to increase again. The prevailing infestation level in May was within categories II and III; however, in November, only the population from category I (figure 4) occurred. The distance between the sampling points was 34.3 to 15,576.78 meters, with an average area of 25.17 ha per sampling point in May and 24.69 ha in November. Since this is a native nematode from the region of Itiquira (Santos, 1995), certainly the area had a moderate population before planting; however, over the years, the number of infestations neared the number found in 2013, among plots of the same clone. This was due to cultural practices performed for planting management, where there was a permanent transit of agricultural machinery in the planted area, disseminating M. exigua race 3 in places where it was absent before. According to the history of this area, the use of grids to clean the interlines was a common procedure.
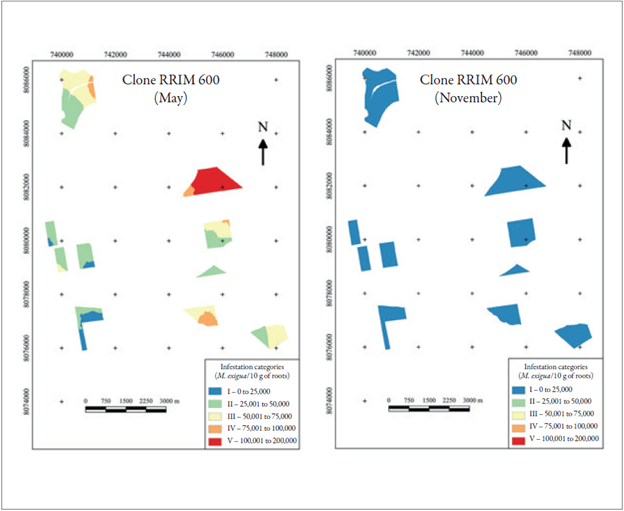
For the clone RRIM 600, the maximum infestations were 197,918 nematodes and 27,690 nematodes, in May and November, respectively, showing a sharp drop of 86 % in periods that, according to the average yearly rainfall, have the lowest and highest precipitation, respectively. Nonetheless, in November, there was a classification of a specific infestation with 27,690 nematodes in 10 g of roots to the category I of infestation, due to the reduction of the values used in the kriging interpolators (figure 5). These data agree with Souza, Souza, Santos and Silva (1998), who observed that M. exigua in coffee plants (probably races 1 and 2) presented the largest infestations and number of galls in the roots during rainy season and a drop in the juvenile population in the soil.
Source: Elaborated by the authors
Figure 5 Infestation mapping of the clone RRIM 600 in May and November.
For the infestations means, the values found in May and November were 46,284 and 6,170 nematodes, respectively, with a reduction of 86.67 % in the infestation. The susceptibility of the clone RRIM 600 to the nematode was shown by Fonseca, Ferraz and Machado (2003), who inoculated 1,000 J2 juveniles in seedlings in a greenhouse and, after 10 days, verified the presence of giant cells responsible for the nematode’s nutrition.
The largest population of nematodes occurred at the coordinates UTM 21S 8082000 E/744000 N, within the range of 100.001 to 200.000 nematodes, prevailing in more than 90 % of the plot. The infestation with the largest area was from category II, which was only absent in two out of the ten studied plots. In the total planting, in November, the infestations classified only in category I (colored blue on the map) since the largest specific infestation was 50,100 nematodes (figure 5), but due to the reduction caused by kriging, this sampling point fitted the stated category.
Silveira (1992) reported that the clone RRIM 600 is highly susceptible to gall nematodes. Santos et al. (1992) and Fonseca, Jaehn and Silva (1999) stated that this clone is susceptible to M. exigua race 3 and resistant to Meloidogyne javanica (Treub) Chitwood. Such susceptibility was reconfirmed with the analysis performed in the present experiment with 197,918 nematodes in 10 g of roots.
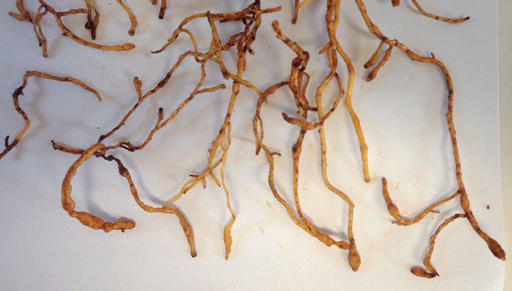
The infestations in May and November showed susceptibility to M. exigua race 3, a fact highlighted by Fonseca et al. (1999) in the clone RRIM 600. The plants of the clones GT 1 and RRIM 600 that were evaluated in the planting at Itiquira showed severe symptoms of the disease, with large amounts of galls in the roots (figure 6). The intensity of its presence among the clones varied but was found to be present in all of them, thus indicating that the pathogen has a high level of aggressiveness and hinders the control of this phytoparasite.
Source: Elaborated by the authors
Figure 6 Rubber tree roots with the presence of galls, symptoms of Meloidogyne exigua race 3.
The occurrence of the largest quantity of nematodes was observed in May, because this month succeeds the high temperatures and rainy season, which is favorable to the reproduction of the nematode. Thus, the population remained high due to both the lack of natural enemies and lack of chemical control. Additionally, the rubber tree monoculture naturally selected a small number of the nematodes that were present in the soil, among them M. exigua race 3, whose population began to grow.
The lack of identification of the rootstock has great influence over the infestation evaluation. However, this nematode is highly aggressive toward the rubber tree, as evaluated by Paes-Takahashi et al. (2015), where they report intolerance and susceptibility of rootstocks GT 1, PB 235, PB 217, RRIM 501, PR 255, IAN 873, RRIM 600 and TJ 1 to M. exigua and Pratylenchus brachyurus Filipjev & S. Stekhoven.
Assuming that only one clone was used as rootstock in the planting examined in this evaluation, the high variability of infestations among the different clones could be due to: the exchange of metabolites between the grafts; the nematode population previously established in the area, which parasitized native plants; differences in soil humidity between the plots, among other factors.
Conclusions
The infestations of M. exigua race 3 in May, in the clones GT 1 and RRIM 600, are larger than the infestations in November.
The spatial variations of infestations within the same clone are high, exhibiting what is considered moderate SDI in May and November.
The infestation randomness was high in both evaluated months and clones, due to the high populational amplitude present in these clones, which is reflected in data cross-validation.
In May, clones RRIM 600 and GT 1 had 197,918 and 159,840 nematodes/10 g of roots, respectively, and both crown clones exhibited high infestations.

