


 Inglés (pdf)
 Articulo en XML
 Referencias del artículo
 Enviar articulo por email
 Citado por SciELO
  Citado por Google
  Similares en
SciELO
Similares en
SciELO  Similares en Google
 Permalink
Introduction
Selection by the resistance trait is challenging in plant breeding programs in semi-arid regions, as many genetic factors control it (Nizamani et al., 2020; Oulmi et al., 2014; Salmi et al., 2019; Smutná et al., 2018). It reduces grain yield under stressful conditions (Sallam et al., 2019), being less significant for resistant genotypes than susceptible genotypes and appearing more frequently in late generations of breeding programs (Benmahammed, 2005).
Selection of Durum wheat (Triticum turgidum L. var. Durum) by resistance involves the evaluation of progenies through the late segregating generations under prevailing conditions for several years. The most stable races that excel in grain yield and drought tolerance are those isolated and selected (Fellahi et al.,2018). In bread wheat (Triticum aestivum L.), Fellahi et al. (2020) found that direct selection based on grain yield is just as effective as indirect selection based on the number of spikes/unit area. Direct and indirect selection based on yield components and pheno-morpho-physiological traits can be effective, except when there are genotype-environment (G * E) interactions. In the case of G * E interactions, late direct selection and, to a lesser extent, indirect selection based on grain yield traits suggest little efficacy in improving yield, which is the end of all products of the selection process. In such cases, more importance should be given to the traits contributing to adapting the variety to the environment without forgetting aspects related to productivity (Benmahammed, 2005; Benmahammed et al., 2010; Salmi et al., 2019).
This research aimed (1) to assess the effectiveness of direct and indirect late selection based on grain yield components and pheno-morpho-physiological traits in durum wheat populations and (2) to study the phenotypic correlations of each genotype across generations and extrapolate the efficiency of its application to identify performing genotypes in semi-arid regions.
Material and Methods
Experimentation Site
Experiments were carried out during three consecutive cropping seasons (2012/2013 to 2014/2015) on the experimental site at the Cropping Research Station of the Technical Institute of Field Crops (TIFC) located 4 km to the South-West of Sétif (1081 m a.s.l., 05°21′N, 36°05′E), in the highlands of northeastern Algeria.
Plant Material
The Durum wheat plant material comprised three crosses (Ofanto/MBB, Ofanto/Mrb5, Ofanto/Waha) representing all the late generations (F5, F6, F7). These crosses were cultivated at the Cropping Research Station mentioned above. Durum wheat varieties Ofanto, MBB, Mrb5, and Waha, representing the crossed parents were taken as plant material and the Bousselam variety as a control. Among these varieties were landraces, including those introduced by the International Center for Agricultural Research for Dry Areas (ICARDA) in Syria as part of the cooperation with the TIFC in Algeria.
Measurements
Measurements were made on all lines (parents and individuals of generations) during the heading stage, as follows:
Canopy temperature (CT), measured by the infrared thermometer (Model AG-42-, Teletemp Corp, Fullerton, CA) Gautam et al. (2013) used. A mean of three readings was taken for each genotype.
Drought Susceptibility Index (DSI) is calculated using Bajji et al.’s (2001) Equation (1):
 (1)
(1)
Where EC1 = electric conductivity 1 and EC2 = electric conductivity 2 before and after the water bath consecutively.
Leaf area (LA) is calculated using Fellahi et al.’s (2020) Equation (2):
 (2)
(2)
Where L = length of the flag leaf and l = width of the flag leaf.
Relative water content (RWC) was calculated using Equation (3) mentioned by Barrs (1968) and Salmi et al. (2019):
 (3)
(3)
Where FW = fresh weight, DW = fry weight, and TW = total weight.
Precocity (PREC) at the heading stage is reported by Laala et al. (2017), who considered that January 1 is the first calendar day until the emergence of 50% of the spikes from their sheath.
Plant height (PH) was measured at maturity, from ground level to the base of the ear, just before the mechanical harvest of trials. A row of 1 m long was manually harvested from all the internal experimental rows of the parents and generations to estimate the number of spikes (NS) per unit area and the economic yield (Ec.YLD). The grain yield (Gr.YLD) was determined following the mechanical harvest of the trial. The following Equation (4) reported by Annichiarico et al. (2005) provides the economic yield:
 (4)
(4)
Statistical Data Analysis
The gain was calculated relative to the mean of the parents (Gain/XPar), which is the difference between the mean of the selected part (µ’) and the mean of the parents (µPar), as shown by Mather and Jinks’s (1982) Equation (5):
 (5)
(5)
The response to selection (Rs) representing the difference between the mean of selected lines (µ’) and the mean of the population (µpopulation) was calculated using Al-Aswd et al.’s (2014) Equation (6):
 (6)
(6)
Statistical analyses were performed by CropStat.7.2.3. (2009) software and the mean of variables were compared relative to the least significant difference (LSD) at the 1% level.
The late selection was applied to the F5 generation. The direct and linked response and relationships were investigated on subsequent F6 and F7 generations using the previously presented graphical and descriptive statistical estimates to isolate resistant lines adapted to drought conditions, according to the study on late generations of barley reported by Benmahammed (2005) and Benmahammed et al. (2010). They found that late generations are more stable for phenomorpho-physiological traits, which allowed the breeder to isolate performing lines derived from cross parents.
Results and Discussion
Sixth-generation (F6) and Seventh-generation (F7) Response to late Selection of the Fifth-generation (F5)
Analysis of variance in cultured parents between the F6 and F7 generations shows significant differences between parents for all traits studied; these results perfectly agree with the studies conducted by Fellahi et al. (2020) and Zeeshan et al. (2014). It suggests the efficiency of late selection due to the diversity of the genetic base among individuals of the cultivated generations (table 1).
F6 Generation Individuals’ Response to Direct and Indirect Late Selection
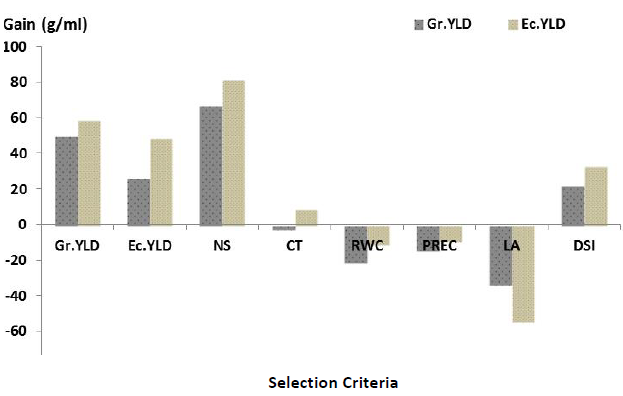
It is crucial to monitor and understand the behavior of late generations in plant breeding programs to isolate desirable traits, especially in semi-arid regions with strong climatic fluctuations from one cropping season to another (Adjabi et al., 2014; Benmahammed, 2005). The response of Durum wheat genotypes of the F6 generation selected by direct late selection in F5 for grain yield was above the population average, where a significantly significant increase in grain and economic yield was observed at 49.4 and 58.9 g/linear m, respectively, and compared to the parent average. The response was also positive, with an increase of 44.0 and 66.4 g/m linear (table 2). Direct selection based on grain yield resulted in a significant increase in NS (10 spikes/linear m).
Table 1. The mean squares of ANOVA on the traits measured in the parents cultivated in the F6 and F7 generations
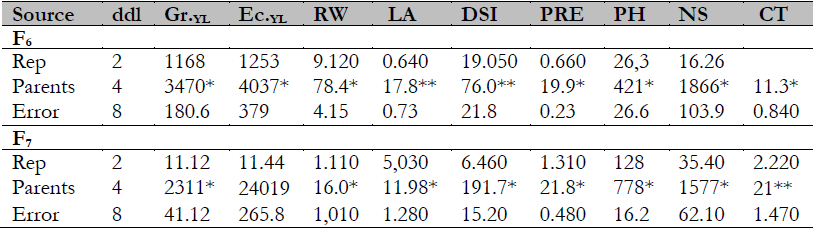
**Significant effect at the 1% level
CT: Canopy temperature (°C), Gr.YLD: Grain yield (g/linear m), Ec.YLD: Economic yield (straw) (g/linear m), RWC: Relative water content (%), LA: Leaf area (cm2), PREC: Precocity in calendar days, DSI: Drought susceptibility index (%), PH: Plant height (cm), NS: Number of spikes per linear meter.
Source: Elaborated by the authors
These results indicate a positive correlation between these three traits and that it is possible to select one of them. This conclusion confirms the results in the previously recorded response and the selection based on economic yield and NS, both of which affected a significant increase in grain and economic yield of the lines selected in F5 (table 2, figure 1). Among these three traits, we find that NS/linear m was the most influential in the increase in grain yield, with a difference of +16.9 g/ linear m compared to grain yield itself. When combining them with other traits, we find that they are non-correlated with any trait, especially resistance traits, except for the 11.4 cm PH increase for the selection based on economical yield (table 2).
These results corroborate those of Laala et al. (2009). They found that grain yield, biomass, and NS applied in the breeding process to improve the grain yield of Durum wheat give better results than others, such as Ph and the earliness of spikes.
The response of the selected lines did not achieve the desired increase in grain and economic yield compared to resistance-related traits (CT, RWC, PREC, LA) (figure 1), but rather a regression, particularly in the lines selected for the LA where the decrease was significant (-33.6 g/linear m) (Table 2) due to the lack of correlations with the generations of these traits for grain and economic yield. The correlation coefficient between the two generations F6/F5 was estimated for grain yield with CT (r = -0.036), RWC (r = -0.095), PREC at the heading stage (r = -0.006), and LA (r = -0.222) (Table 3). This is consistent with Adjabi et al. (2014), who indicated no inter-population correlation in Durum wheat cultivars due to the influence of environmental factors in semi-arid regions.
Table 2. The performance response of F6 lines selected from F5 directly and indirectly for the traits measured
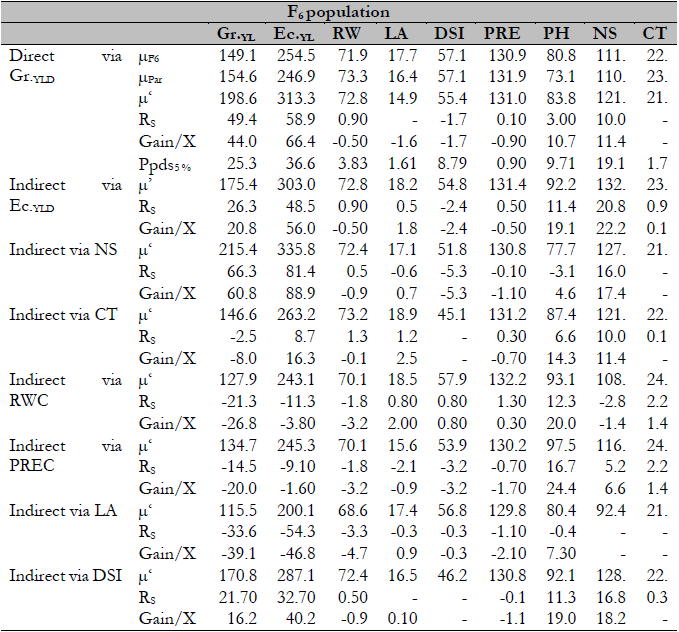
RS: Response to the selection, µPar: Mean of parents, µ’: Mean of the lines selected, Gain/XPar: Gain compared to average parents, CT: Canopy temperature (°C), Gr.YLD: Grain yield (g/ linear m, Ec.YLD: Economic yield (straw) (g/ linear m), RWC: Relative water content (%), LA: Leaf area (cm2), PREC: Earliness (precocity) at the heading stage in calendar days, DSI: Drought susceptibility index to stress (%), PH: Plant height (cm), NS: Number of spikes per linear meter.
Source: Elaborated by the authors
Source: Elaborated by the authors.
Figure 1. The response of F6 generations to Gr.YLD and Ec.YLD under direct and indirect selection of the selected part (i) of the F5 generation (i = 30% = five lines per group).
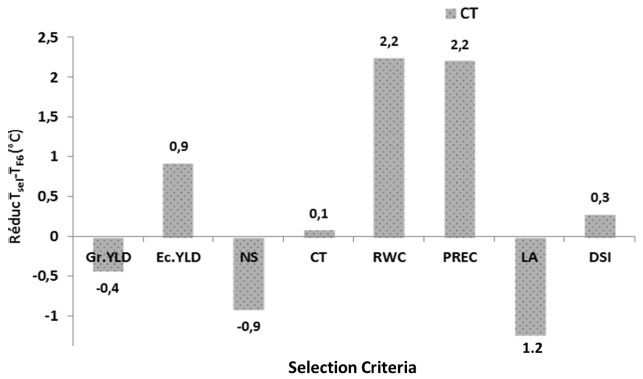
The effect of grain and economic yields on DSI was positive, with a respective increase of 21.7 and 32.7 g/linear m (table 2). This increase is accompanied by an increase in PH of 11.3 cm and NS of 16.8. The response of the selected lines to DSI at the F5 generation was positive only at the F6 generation. The significant contradiction of DSI by -10.9% confirms the negative correlation for these two traits (PH, NS) between F6 and F5 (r = -0.242) (table 3). Figure 2 shows that the response of the traced lines of the F6 generation selected from the F5 generation could not maintain their superiority of CT, as shown by the correlation coefficient between F6/F5, which appears very low (r = -0.037) (table 4). This result may be due to the effect of the semi- arid environment, corroborating Bouzerzour and Benmahammed’s (2009) findings. They discovered that the environment of semi-arid regions affects the adaptation and production of cultivars, mainly physiological functions such as CT control.
Source: Elaborated by the authors.
Figure 2. Response of the F6 generation to canopy temperature (CT), under direct and indirect selection (i) of the F5 generation (I = 30% = five lines per group).
Table 3. The phenotypic correlations between measured traits and grain yield in generations F5, F6, and F7
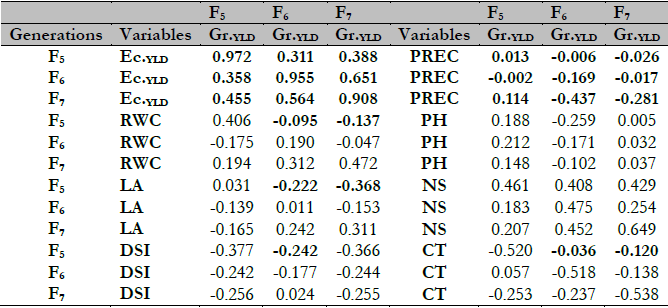
n-2 = 43, r5% = 0.2942
Source: Elaborated by the authors.
F7 generation individuals’ response to direct late selection
In the selection and improvement of cereals, Benmahammed et al. (2010) and Benmahammed (2005) suggested that, follow up the late selection method, whether direct or indirect because early selection seems inefficient due to the effects of the G * E interaction, which nullifies any genetic progress. In this study, late direct selection based on grain yield showed that a response from the selected lines increased grain and economic yield over the mean of the F7 generation, 35.1 and 33.3 g/linear m, respectively (table 5). Direct late selection improved water stress resistance by decreasing the DSI significantly by -13.2%, but also a non-significant decrease of -1.4 °C in CT. Among the variable traits linked to yield, an increase in the NS was recorded by 15.8 spikes and PH by 10.1 cm. Regarding LA, RWC and PREC were not affected by late selection based on grain yield (table 5).
Table 5. Performance of the F5 selected lines to F7 by direct and indirect selection of the traits measured
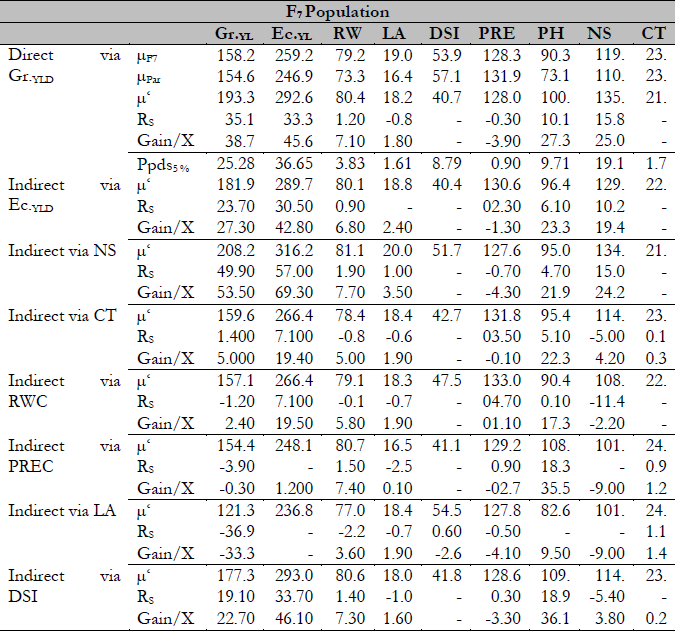
RS: Response to the selection, µPar: Mean of parents, µ’: Mean of the selected lines, Gain/XPar: Gain compared to parents, CT: Canopy temperature (°C), Gr.YLD: Grain yield (g/linear m), Ec.YLD: Economic yield (straw) (g/linear m), RWC: Relative water content (%), LA: Leaf area (cm2), PREC: Earliness at the heading stage in calendar days, DSI: Drought susceptibility index (%), PH: Plant height (cm), NS: Number of spikes per linear meter.
Source: Elaborated by the authors
F7 generation individuals’ response to indirect late selection
By the indirect late selection applied to the fifth generation (F5), the selected lines were improved compared to some of the measured genotypes, such as a grain and economic yield chosen based on economic yield by 23.7 and 30. 5 g/ linear m and NS of 49.9 and 57.0 (Table 5). These results consolidate those of Laala (2018), who found in a study on three Durum wheat populations that the response to selection was better in economic yield and NS, in addition to grain yield itself even. Besides the gain in grain yield when selecting based on economic yield and NS, the selected lines respond by increasing the NS in both traits of 10.2 and 15.0 spikes/linear m and the RWC over the mean parent gain (gain/XPar) by 6, 8, and 7.7%, respectively (table 5).
The responses of the selected lines based on the CT were the same as the previous generations (figure 4). It did not decrease compared to the population’s and the parents’ average (table 5), which demonstrates as a non-significant correlation for this trait across generations (r (F5/F7) =0.032) due to the G * E interaction effect (table 4). Also, the lines could not respond by increasing the yield in the seventh generation, although it was significantly higher in the fifth generation for the same lines (table 5, figure 3).
For the selection based on the CT and at generation F5, a significant and negative correlation is observed between grain yield and CT; this is not valid for generation F7 (r = -0.120) (table 3). This result is consistent with Adjabi et al. (2014), where the effect of environment and climate on the production of Durum wheat varieties was proven because their output was different and variable from one cropping season to another. What is remarkable when selecting by CT is that the DSI decreased significantly by -11.3% (table 5). This opens the way to designing lines resistant to abiotic stress, which could be hybridized in the future with lines with high grain yield that combine resistance and productivity traits, as suggested by Bouzerzour and Benmahammed (2009) due to the specificity of the semi-arid climate. Among the traits (RWC, PREC, DSI, and LA), only DSI affected the grain and economic yield in the seventh generation, recording 19.1 and 33.7 g/ linear m, respectively (table 5).
By selecting based on LA, the answer was to decrease the grain yield (-36.9 g), the economic yield (-22.4 g), RWC (-2.2%), PH (-7.7 cm), and NS (-18.2 spikes). It shows the pointlessness of selection vy large LA in semi-arid regions since if it coincides with drought, it leads to deep imbalances in plant morphology and physiology and a decrease in grain yield (Sadeghzadeh & Alizadeh, 2005). In this study, the LA, PREC, and RWC were most affected by the G * E interaction, so selection did not improve most of the characters studied. This is shown by the correlations of these two characters for grain yield between generations F5 and F7, as shown in Table 3, where the correlation coefficient was insignificant for Gr.YLD/PREC (r = -0.026) and Gr.YLD/RWC (r = -0.136).
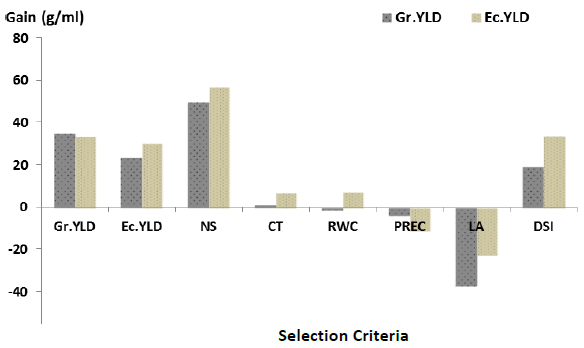
Source: Elaborated by the authors.
Figure 3. The response of the F7 populations to Gr.YLD and Ec.YLD. under direct and indirect selection of the selected part (i) of the F5 generation (i = 30% = five lines per group).
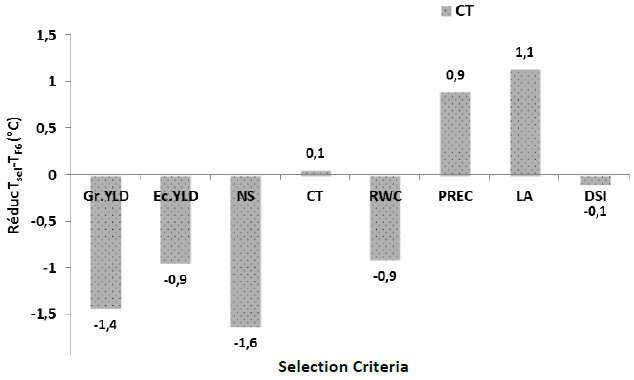
Source: Elaborated by the authors.
Figure 4. The response of the F7 generations to canopy temperature (CT) under direct and indirect selection (i) of the F5 generation (i = 30% = five lines per group).
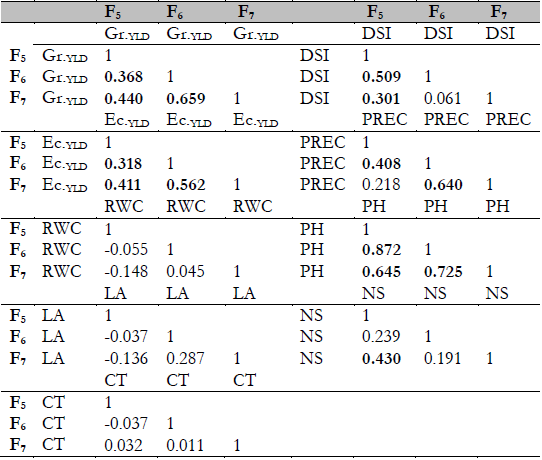
Monitoring the response to direct selection for each trait studied showed that the grain yield at the F5 generation is positively correlated with that of the F6 generation (r (F5/F6) = 0.368) and the F7 generation (r (F5/F7) = 0.440). The grain yield of the F6 generation is positively correlated with that of the F7 generation (r (F6/F7) = 0.659) (table 4). The same observations were recorded for both economic yield and PH. This shows that these traits are not affected by G * E interaction and that the strong correlation between them does not change from one cropping season to another. These results agree with Benmahammed et al.’ (2004) work, who found that grain yield is correlated to itself from one generation to another in a study on three barley populations. Furthermore, NS had a significant and positive correlation between the F5 and F7 generations (r (F5/F7) = 0.430). An absence of correlation was observed between the F5 and F6 generations (r (F5/F6) = 0.239) and the F7/F6 generations (r (F6/F7) = 0.191). The same observations concerned the PREC of the heading stage and the DSI (table 4). On the other hand, some traits are not correlated between themselves and between generations, such as RWC, LA, and CT (table 4).
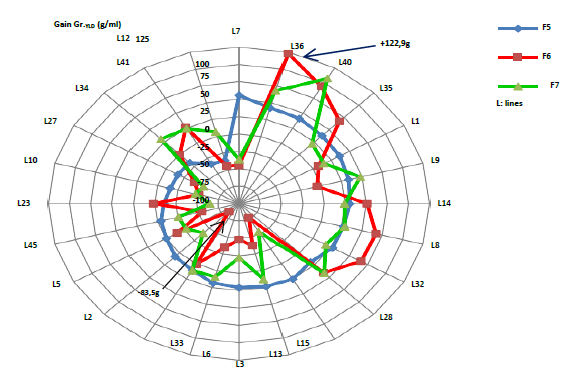
Late selection, whether direct or indirect, showed that the lines L1, L8, L14, L28, L32, L35, L36, and L40 in the F5 generation had a higher cereal yield than the average these lines have kept their production in the future generations. A tremendous increase in yield was observed in the L36 line at the F6 generation (122.9 g) (figure 5). Table 6 shows that all these superior lines were selected based on characters linked to productivity (grain yield, economic yield, and NS). These traits correlate with grain productivity and provide the same information as breeding programs. These results agree with Benmahammed’s (2005) findings in a study of three barley populations that were selected under semi-arid conditions and with Belkharchouche et al.’s (2009), who also advise selection for these traits, as they contribute to increasing the grain yield of Durum wheat in these semi-arid regions of the high plains of eastern Algeria.
Lines selected based on resistance did not increase grain yield from one generation to another, except for line L8, selected based on CT and DSI (table 6, figure 5). This line showed an exceptional response to grain yield, which did not drop below the average population over all generations. The emergence of a single line among many lines selected based on different resistance traits proves how difficult it is to improve resistance and productivity in semi-arid areas. Benmahammed (2005) and Sallam et al. (2019) found that selection for resistance leads to lower yields under challenging circumstances. However, some lines, like the L1, brought together many selection traits (table 6).
These results demonstrate how important it is to apply late selection in plant breeding programs since G * E interaction is reduced, paving the way for genetic progress (Ahmed et al., 2014; Benmahammed, 2005). In the future, these lines can be isolated and monitored to study further their behavior in semi-arid climatic conditions that characterize our regions to extrapolate genotypes that are both highly productive and resistant to abiotic stresses.
Table 6. High-performing lines at late selection for various traits studied in F5 populations
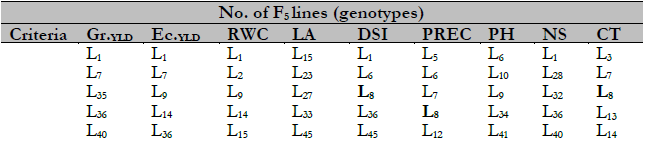
Source: Elaborated by the authors.
Conclusions
In the present study, late selection in the F5 generation gave more efficiency in responding to genotypes regarding resistance to abiotic stresses. The study of the means for the fifth generation showed significant differences for the variables measured. The frequency distribution curve showed some lines superior to their parents used in the study. Among the traits measured, the most significant number of lines surpassing the parents has been recorded for the traits Gr.YLD, Ec.YLD, LA, DSI, and PH.
The response of genotypes selected by late selection in F5 in both generations F6 and F7 was above the population average, where there was a significant increase for grain yield and economic yield by selection based on the Gr.YLD, Ec.YLD, NS, and to a lesser extent, DSI. Late selection in the F5, F6, and F7 generations showed lines that exceeded the grain yield at the generation level, which maintained their high yield throughout the different cropping seasons, namely, L1, L8, L14, L28, L32, L35, L36, and L40. All these high-performance lines were selected based on the three characteristics: grain yield, economic yield, and NS out of the 10 characters studied.
In contrast, lines selected based on resistance did not progress in grain yield across generations except line L., which was selected based on CT and the DSI. By following the response to direct selection for each trait studied and its link between generations F5, F6, and F7, it was found that grain yield is linked between generations. It was also found that some traits seem to be related to a single generation, which is due to the G * E interaction effect that often limits the production capacity of cultivated cultivars.
Authors’ contributions
Abelmalek Oulmi: registration of information in the field, construction of databases, preparation of manuscript; Nadjim Semcheddine: design of methodologies, supervision of activities; Ali Guendouz:, analysis of information and preparation of manuscript; Benalia Frih: analysis of information and preparation of manuscript; Noureddine Laadel: supervision of activities and preparation of manuscript; Abdelhamid Adjabi: supervision of activities and preparation of manuscript.

