


 Inglés (pdf)
 Articulo en XML
 Referencias del artículo
 Enviar articulo por email
 Citado por SciELO
  Citado por Google
  Similares en
SciELO
Similares en
SciELO  Similares en Google
 Permalink
1. Introduction
Microalgae constitute a very diverse group that are primary producers in aquatic environments, and these photosynthetic microorganisms are useful in applications such as the production of metabolites, in bioremediation 1,2 and as biofertilizers 3. Algae, depending on the species, are capable of growing under different types of trophy (nutrition), autotrophy, heterotrophy and mixotrophy 4-6. Autotrophy is the type of nutrition given in nature through photosynthesis, but its bitechnological development presents technical and physiological difficulties associated with the supply and distribution of light and CO27. Certain microalgae such as those of the genus Chlorella and Scenedesmus can develop heterotrophically, using an organic carbon source 8,9. Heterotrophy allows an increased cell concentration and productivity, but not all the products of interest occur under this nutritional condition. Mixotrophy represents the use of light as an energy source coupled with a simultaneous assimilation of CO2 and organic carbon, therefore, this process can be more efficient to produce biomass as well as some metabolites of interest 10.
The cultivation of microalgae, three key elements are required: 1. a source of carbon (inorganic or organic), 2. a culture medium with sufficient nutrient concentration (nitrogen, phosphorus), and 3. a source of energy, in this case light referred as photosynthetically active radiation 11,12. One drawback of microalgae cultures is the high cost due to the energy required for growth and production of different metabolites of interest 13 . In the last years, the technical and economic feasibility has been explored to use sources with a high content of nitrogen (N) and phosphorus (P) such as domestic and industrial wastewater 14,15 as indicated on Table 1.
Table 1 Production of biomass and carotenoids using wastewater.
| Strain | Type of wastewater | Biomass content | Carotenoids | Reference |
|---|---|---|---|---|
| Chlorella pyrenoidosa | Olive oil | 2400 mg/L | 6.1 μg/mg | 16 |
| Dunaliella salina | Dairy industry | 440 mg/L | 16.8 mg/L | 17 |
| Spirulina sp. | Domestic | 1080 mg/L | 3.4 μg/g. | 18 |
| Scenedesmus sp. | Domestic | 6.7 g/L/d | 4.06 mg/g | 19 |
| Botryococcus braunii | Domestic | 2.687 g/L | 442 mg/L | 18) |
| Chlamydomonas bioconvexa | Vinasse | 222.22 mg/ L | 805.26 μg/ g | 20 |
| Micractinium sp. | Vinasse | 177.78 mg/ L | 669.85 μg/ g | 18 |
| Scenedesmus sp. | Olive oil mill | 1.8 g/L | 92.75 % | 21 |
| Consortium: Scenedesmus sp, Chlorella sp and Ankistrodesmus s.p | DAM | 0.7 g/L | N.R | 22 |
Source: own elaboration
Coal mine acid drain water (MAD) are characterized by low pH values and contain dissolved heavy metals such as Fe, Mn, Zn, Cu, Pb, Cd, among others 16, generate serious negative impacts on the different resources that receive their discharges without prior treatment, mainly on water resources, causing loss of the fauna present, acidification of the resource and decrease in the concentration of oxygen. This problem is caused by mines that do not treat MAD, given the high cost of treating these effluents, as well as the lack of technologies that take advantage of these effluents so they could be reincorporated into the process. Some authors have reported the potential of microalgae to grow using MAD, although there is still not much work in this area 22 Therefore, the objective of this work is to evaluate the effect of three different nitrogen sources under autotrophic and mixotrophic conditions using DAM, generated in a mine in northeastern Colombia, to determine if there is an effect on the production of biomass and carotenoids using Scenedesmus sp.
2. Methodology
2.1 Study organism
The green algae Scenedesmus sp of the Chlorophyceae class and Chlorococcales order was used, obtained from the INNOVALGAE Laboratory of the Universidad Francisco de Paula Santander (UFPS), Colombia. The inoculum was kept in basal BOLD medium 23 1 g/L of sucrose was added for the inoculum under mixotrophic condition. The inocula of the autotrophic and mixotrophic conditions were cultured for 20 days in 1 L photobioreactors (0.6 L working volume) under a light intensity of 200 µmol/m2s1, a photoperiod of 12 h light/12h dark (12/12 h) and an air flow of 0.6 vvm.
2.2 Culture media and operating conditions
Undiluted autoclaved MAD was used as medium, which was characterized physiochemically in the Water Laboratory of the UFPS, as established by the method’s standard edition 23 (Table 2). Nitrogen sources: sodium nitrate, urea, and ammonium phosphate were evaluated. The nitrate concentration provided by the BOLD medium was calculated and the necessary sucrose concentration was determined for the mixotrophic condition, to maintain a carbon/nitrogen (C/N) ratio of 6: 1 for each nitrogen source to be evaluated. The BOLD medium was used as a control for each condition.
Table 2 Physicochemical parameters measured
| Parameter | Method | Parameter | Method |
|---|---|---|---|
| COD (mg/L) | Standard Methods 5220C | pH | Standard Methods 4500B |
| BOD (mg/L) | Standard Methods 5210B-4500-OG | Conductivity (µS/cm) | 2510B |
| Nitrates (mg/L) | Colorimetric | Total Suspended Solids (mg /L) | Standard Methods 2540D |
| Nitrites (mg/L) | Colorimetric | Heavy Metals (Pb, Mn, Zn, Ca, Fe, Ni, Cd, Cr, Mg, Cu y K) (mg/L) | Standard Methods 3111D |
| Ammonia nitrogen (mg/L) | Colorimetric | Sulfides (mg/L) | Standard Methods 4500- |
| Phosphates (mg/L) | Colorimetric | Chlorides (mg/L) | Standard Methods 4500-ClB |
Source: own elaboration
The cultures were carried out in 1 L photobioreactors stirred at 125 rpm, an air flow rate of 1 vvm, a temperature of 30 ± 2ºC and a pH of 7 ± 0.3. For the autotrophy and mixotrophy conditions, the light was 200 μmol/m2s1 provided by fluorescent lamps. An inoculum in exponential phase was used to inoculate the reactor (10% of the total operating volume). The photoperiod used was 12/12 h. To monitor the different parameters, samples were taken every 24 hours for the 10 days of the process.
2.3 Analysis Methods
2.3.1 Biomass
For dry weight (DW) biomass quantification, 5 mL of sample were taken, vacuum filtered on nitrocellulose membranes of 0.22 μm pore diameter (Millipore®) and dried at 80 °C for 72 h. Previously, these membranes were brought to constant weight by keeping them at 80 °C for 24 h.
2.3.2 Pigments and carotenoids
The pigment specific concentration (mg of pigments/g dry biomass) was quantified using a sample volume of 2 ml. The samples were centrifuged at 3500 rpm for 10 min at room temperature. The pellet from each tube was resuspended in 2 ml of acetone 100% pure. The mixture was vortexed at maximum speed for 10 min. Subsequently, it was centrifuged again at 3500 rpm for 10 min at room temperature. The supernatant from each tube was removed and added 5 ml with acetone 100% pure, then read the absorbance at wavelengths: 662, 645 and 470 nm, in a GENESYS 10S UV-Vis spectrophotometer from Thermo brand. The concentration of chlorophyll a, b, and total carotenoids was determined according to the Eq.1, 2 y 3 reported by Wellbur 24) :
2.3.3 Nitrogen quantification
Nitrogen quantification was performed by the brucine method for nitrates 1, the potassium persulfate method and the phenol method for ammonium according to methods standard edition 23. Sucrose concentration was measured by the DNS method. Data were analyzed with NSCC data and SigmaPlot 11 ed. software.
2.4 Data analysis
The nitrogen source influence on biomass and carotenoids production was evaluated by an analysis of variance (one-way ANOVA). Post hoc tests (LSD test) were used to determine the statistical differences (P <0.05), R software 4.0 version for windows was used. The analyzes were carried out in triplicate. Calculations and graphs were performed using the SigmaPlot 11 ed.
3. Results
3.1 MAD physicochemical characterization and biomass production under each condition
Table 3 shows the MAD physicochemical characterization, these are average values obtained during the monitoring time. MAD is known very its acidic pH values, as evidenced in this work. The average pH values obtained were 3.59 ± 0.1, this can be attributed to the oxidation reactions of Fe2+ to Fe3+ that obtain a higher acid intensity 18,25. The pH affects metabolism associated with growth, including ionization of biochemical metabolites, solubility, as well as CO2 bioavailability and assimilation of nutrients, mainly nitrogen. Very acidic pH can affect this process, so optimum pH can be in the range of 6 to 8 26. The concentrations of COD and BOD show the low concentration of organic matter in the MAD, these effluents contain inorganic compounds, mainly iron salts, sulfur, chlorides, and some heavy metals, which generate extreme environments where only some microorganisms can exist with the ability to assimilate these compounds 19. Also, a low concentration of nitrogen compounds was detected. It is possible that the nitrogen present is rapidly assimilated by the microorganisms present to carry out various metabolic activities, the above evidenced the need to add nitrogen for the biomass and carotenoids production stages.
Table 3 MAD physicochemical characterization.
| Parameter | Average value | Parameter | Average value |
|---|---|---|---|
| COD (mg/L) | 185 ± 0.865 | Chlorides (mg/L) | 160.37 ± 1.4 |
| BOD (mg/L) | 128.53 ± 1.2 | pH | 3.59 ± 0.1 |
| Nitrates (mg/L) | 10.23 ± 0.46 | Conductivity (µS/cm) | 893.2 ± 2.5 |
| Nitrites (mg/L) | 0.142 ± 0.04 | Total Suspended Solids (mg/L) | 3128.4 ± 3.2 |
| Ammonia nitrogen (mg/L) | 2.5 ± 0.6 | Sulfides (mg/L) | 0.52 ± 0.02 |
| Phosphates (mg/L) | 2.81 ± 0.25 |
Source: own elaboration
Figure 1 shows the concentration of ions and heavy metals. The presence of Ni, Cd and Cr was not detected. It was found that the concentrations of Fe and Zn are above the permissible discharge value in Colombia, mainly Fe concentration is considerably high. This can be explained by the chemical characteristics of the soil in the study area, which is clayey and has iron. High iron concentrations can alter the natural balance of ecosystems, it can cause loss of vegetation, desertification, and can impact strongly on the biological component in water sources 20. The remaining parameters are within the permissible limits established, although the high calcium and magnesium concentrations can increase the hardness of the receiving water resource.
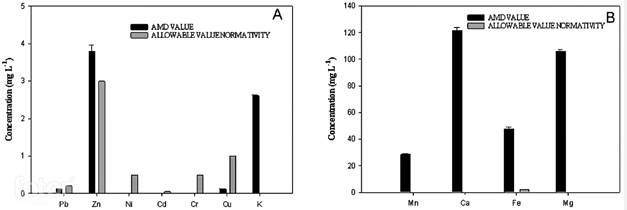
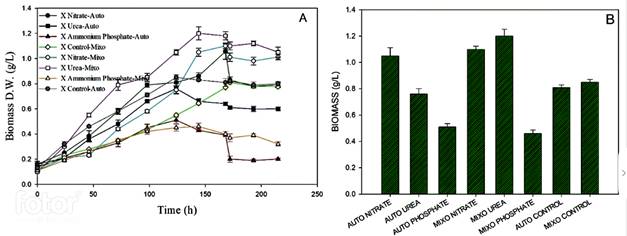
Figure 2 shows the biomass production in autotrophy and mixotrophy conditions with each nitrogen source. The highest biomass concentration occurred in autotrophy, it was reached with sodium nitrate (1.06 g/L ± 0.06), followed by the culture with urea (0.76 g/L ± 0.04). In the mixotrophic condition, the highest concentration was reached the culture with urea (1.18 g/L ± 0.0321), followed by the culture with sodium nitrate (1.1 g/L ± 0.023). For the culture with ammonium phosphate, it was found that growth was low in both conditions, and it was evidenced by the low nitrogen consumption by the microalgae. The assimilation of nitrogen by the culture with sodium nitrate was 100% in both conditions, the highest assimilation occurs in the first 60 hours. Finally, the cultivation with ammonium phosphate showed low growth in terms of biomass and is corroborated by the low consumption of this nitrogen source.
Source: own elaboration
Figure 2 Biomass production on different nitrogen sources using MAD under autotrophic and mixotrophic conditions. A. Growth kinetics and B. Maximum biomass concentration reached.
Various studies have been carried out in order to increase the productivity of microalgae and it has been found that different aspects can limit their growth such as light availability, and the availability and assimilation of nutrients, mainly nitrogen 27,28. This nutrient is what limits growth and carotenoid production. Based on the results, the nitrogen source seems to exert a growth limitation, particularly in the case of ammonium phosphate. It is possible that it exerts toxicity since it is a neutral molecule and easily crosses the membrane, upsetting the balance in the oxidation-reduction reactions for electron transference, which triggers a mismatch in cellular metabolism 29,30.
3.2 Carotenoid content in each condition
Figure 3 shows carotenoid production under autotrophy and mixotrophy conditions with each nitrogen source.
Source: own elaboration
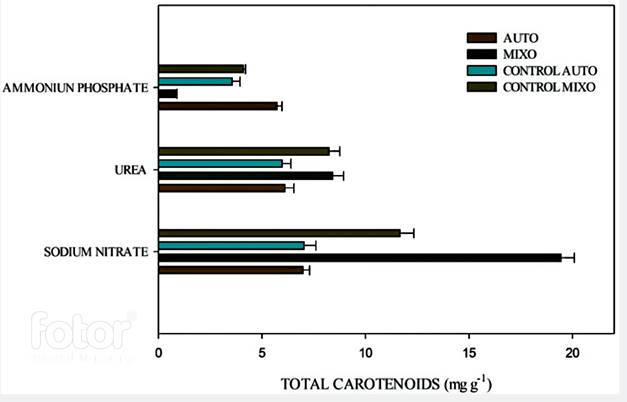
Figure 3 Total carotenoid concentration under autotrophic and mixotrophic conditions with each nitrogen source.
The highest total carotenoid concentration was obtained in the culture with sodium nitrate in mixotrophy (19.53 mg carotenoids/g biomass). The analysis shows that this concentration has significant differences (P˂0.05) when compared to the control in both autotrophic and mixotrophic conditions. In the culture with urea, the carotenoid concentration did not show significant differences when compared the control and the mixotrophic culture (P˃0.05). In the culture with ammonium phosphate, there was a lower carotenoid concentration in both autotrophic and mixotrophic cultures. In the mixotrophic culture, the specific carotenoid concentration was 60% lower when compared to the autotrophic culture. High nitrogen concentration in the culture medium inhibits the growth and carotenoid production 18, because the enzyme nitrate reductase, which introduces nitrogen to the cell, acts at a higher speed when the concentration of this element are low 31. In the case of ammonium phosphate, the limitation it exerted on the pigment production was 70%. Which can be explained because ammonium unbalances the electrochemical gradient in the thylakoid membrane, which is the organelle where the electron transfer reactions. When this equilibrium is broken, the ATP synthesis in the light phase is affected and, therefore, the reactions of the dark phase are not efficient, thus there is not enough energy for growth and pigment production 32. As observed in the culture with ammonium phosphate and the culture with urea for the mixotrophic condition.
3.3 Kinetic parameters estimation and nutrient removal
The specific growth rate of the different cultures was calculated when the cultures were in exponential phase. The pigment concentration shown relates to the maximum pigment concentration reached in each condition. The data obtained are shown in Table 4.
Table 4 Kinetic parameters of the Scenedesmus culture in MAD.
| Culture | Nitrogen source | Biomass productivity (g DW / L-d) | Growth rate (h-1) | Carotenoid productivity (mg/g- biomass) |
|---|---|---|---|---|
| Mixotrophy | Sodium nitrate | 0.183±1.9e-4 | 0.0081 | 19.45±6.5e-2 |
| Urea | 0.2±1e-4 | 0.0076 | 8.42±7.2e-2 | |
| Ammonium phosphate | 0.077±3.2e-4 | 0.0025 | 0.87±6e-3 | |
| Autotrophy | Sodium nitrate | 0.151±4.8e-5 | 0.0054 | 6.98±3.5e-4 |
| Urea | 0.148±5.3e-5 | 0.0052 | 6.11±5.4e-4 | |
| Ammonium phosphate | 0.099±6.1e-5 | 0.0025 | 5.73±8.6e-4 |
Source: own elaboration
The culture with sodium nitrate had the highest growth rate for the mixotrophic cultures (0.0081 h-1). The lowest growth rates were in the cultures with ammonium phosphate. Regarding the autotrophic culture, the observed rates for the cultures with sodium nitrate and urea were similar. Wang and collaborators 25) reported growth rates in a range of 0.1 - 0.2 d-1 using DAM under autotrophic conditions and sodium nitrate as nitrogen source, like those achieved in this work, it should be noted that for the other sources and under mixotrophic conditions no data have been reported yet 26. According to the statistical analysis, it was found that the cultures with sodium nitrate and urea do not have significant differences when using DAM, and there are significant differences when compared to the culture with ammonium phosphate, as shown in Table 5. Regarding the control culture (BOLD medium), the cultures with sodium nitrate and urea do present significant differences, evidencing that there is a greater growth rate and carotenoid production using the DAM, when compared to the control culture.
Table 5 Growth rate statistical analysis of cultures under mixotrophic and autotrophic conditions.
| Comparison | Mean Diff | p | Q | P | P<0.05 |
|---|---|---|---|---|---|
| NO3 vs. A.P. | 0.00510 | 4 | 38.052 | <0.001 | Yes |
| NO3 vs. CONTROL | 0.00230 | 3 | 17.161 | <0.001 | Yes |
| NO3 vs. UREA | 0.000400 | 2 | 2.984 | 0.057 | No |
| UREA vs. A.P. | 0.00470 | 3 | 35.068 | <0.001 | Yes |
| UREA vs. CONTROL | 0.00190 | 2 | 14.176 | <0.001 | Yes |
| CONTROL vs. A.P. | 0.00280 | 2 | 20.891 | <0.001 | Yes |
A.P.: Ammonium Phosphate. Source: own elaboration
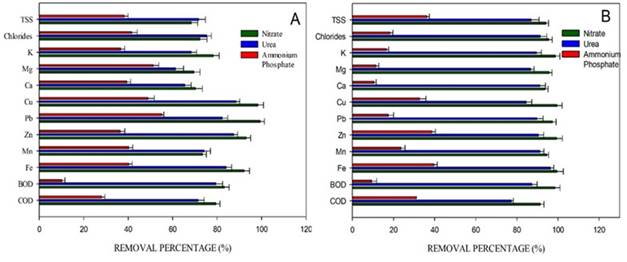
The pollutant removal is shown in Figure 4. It is evidenced that the treatments with the best pollutant removal percentages were the cultures with sodium nitrate and urea. Iron was removed by 98% under mixotrophic conditions, while under autotrophic conditions, the removal was 92%. Regarding COD and BOD, the removal percentages were 94% and 98%, respectively, for sodium nitrate under mixotrophic conditions. For the culture with urea, the removal percentages were between 70 and 80%. For the culture with ammonium phosphate, the removal percentages were low when compared to the other cultures. The values of TSS, chlorides, zinc, iron, BOD, and COD removal percentages measured at the end of the process do not comply with the Colombian regulations for these parameters.
Microalgae have the metabolic capacity to remove iron and heavy metal compounds 22. It has been reported that for microalgae to carry out this process, they follow two mechanisms: absorption (active/passive) and adsorption, mainly through physical adsorption, chemical adsorption and chelation 33. The acidic pH characteristic of MAD causes the metal ion displacement and complicates absorption and adsorption in the case of microalgae. This phenomenon is solved by the ability of these organisms to alkalize the solution pH, which facilitates ion precipitation. In addition to this, microalgae can act as a selective and absorbent agent for pollutant treatment, managing to remove metals such as Fe, As, Zn, Mn, Cd and Cu and reduce COD and BOD concentrations 34). In this work, similar results were found for the Scendesmus sp strain, the microalgae managed to alkalize the medium (6.9) for the culture with nitrate and 6.6 for the culture with urea), and, therefore, remove the contaminants. Although in the case of the culture with ammonium phosphate, the pH only reached values of 5.5 which may explain the low removal and growth in this culture.
4. Conclusions
Based on the results, the Scenedesmus sp strain proved to be an attractive alternative for biomass and carotenoid production using DAM in its culture medium. It can grow under the different trophy conditions and the nitrogen sources proposed. Sodium nitrate was the most suitable nitrogen source for biomass production and for carotenoid accumulation under the mixotrophic condition. In the present study, the operating culture conditions under mixotrophy and autotrophy conditions were determined, and obtained the kinetic parameters for each condition, as well as the pollutant removal percentages achieved in the evaluated treatments. This will allow different works in this area, since there are few works reported for this microalga using MAD.

