


 Inglés (pdf)
 Articulo en XML
 Referencias del artículo
 Enviar articulo por email
 Citado por SciELO
  Citado por Google
  Similares en
SciELO
Similares en
SciELO  Similares en Google
 Permalink
Introduction
From an ecologic-transactional perspective, adolescents’ development and adaptation depend on interaction of diverse factors across multiple systems, including adolescents themselves, family, school, neighborhood and other systems involving macrostructural factors (Cicchetti 2013). Adolescence represents a stage of growth, opportunities and resources, however, to some adolescents can be a process accompanied by stress impacting their well-being, physical and emotional (Romero, Silva, Villasmil, Bermúdez, & Madueño, 2017).
According to general theories on stress, the latter may be conceptualized as an external stimulus that alters an individual’s homeostasis, but also as a response of the individual to such stimulus, generally of a non-adaptive character, which leads to the identification of an “objective” stress and a “subjective” stress, which involves the perception (Yan, Li, & Sui, 2014). Stress is an important issue form the developmental psychopathology during since is related to psychological and physiological problems during adolescence (Xu et al., 2019).
Coddington (1972) was one of the first to make a list to assess the most common stressors in children and adolescents, aimed at identifying objective stress. On the basis of the transactional model of stress (Lazarus, 1993) adolescent stress models (e.g. Grant et al., 2014; Seiffge-Krenke, Aunola, & Nurmi, 2009) take into consideration both objective and subjective stress. The environmental events could be stressors and objective threat to adolescent development (Grant et al., 2014), however, features such as temperament and personality (Hewitt, Caelian, Chen, & Flett, 2014; Yan et al., 2014); for example, when the adolescent perception of control situation and self-control are low the stress responses arise (Galla & Wood, 2015).
At contextual level, parental conflicts and family economic hardship (Santiago, Torres, Brewer, Fuller, & Lennon, 2016), problems with parents (Persike & Seiffge-Krenke, 2016), damaging child-rearing practices (García-Linares, De la Torre, de la Villa, Cerezo, & Casanova, 2014), or family functioning issues (Sheidow, Henry, Tolan, & Strachan, 2014) are the most frequent stressors for adolescents, associated with psychopathology (Santiago et al., 2017).
On the other hand, the situation characteristics, the type and frequency of the event, or the level of perception of stress over the situation, are issues that influence the adolescent psychological adjustment. Major or critical life events (e.g. a parent’s death or having an accident), and minor or daily life events (e.g. failing an exam, losing a class competition) may also potentially cause high stress levels, however, they are less frequently studied (Compas, Davis, Forsythe, & Wagner, 1987; Hewitt et al., 2014; Morales, 2017). There is evidence that daily stressors may predict both internalized and externalized problems (Sheidow et al., 2014). Conflicts with parents and peer, and social relationships, are the most commonly reported in different cultures (Encina & Avila, 2015; Rowe, Zimmer-Gembeck, & Hood, 2016) and may be the best predictors of antisocial behavior (Cicchetti, 2013), whereas those related to friends may predict depression (Persike & Seiffge-Krenke, 2016). Family problems economic pressures are considered as daily stressors frequently associated with adaptation problems as depression, somatic complaints, and aggressive behavior (Santiago et al., 2016; Williams, Lund, Liang, Mousseau, & Spencer, 2018). In the school context, everyday activities like submitting homework or open presentations are considered as academic stressors associated with low performance (García-Ros, Pérez-González, & Fuentes,.2015; Serrano & Vaillo, 2016; Sun, Dunne, Hou, & Xu, 2012), poor psychological adjustment (Escobar, Blanca, Fernández, & Trianes, 2011), depression and anxiety symptoms (Anniko, Boersma, & Tillfors, 2019; Jaureguizar, Bernaras, Soroa, Sarasa, & Garaigordobil, 2016), as well as, increase of cortisol (Xu et al., 2019). Social relations, in general, are another source of stress (Serrano & Vaillo, 2016) and have been considered the two primary sources of perceived stress by adolescents related to different kinds of internalized and externalized symptoms (Williams et al., 2018; Xie, Li, Yi, & Deng, 2014).
In view of negative impact of stress on adolescents’ mental health and the cultural influences, many instruments have been developed in different countries. Some of them are check list and were developed from an objective perspective of stress, for example, the Coddington’s Life Event Scales (CLES: Coddington, 1972) which has been adapted in some countries as Spain (Villalonga, Valderas, Palacio, Herdman, Rajmil, & Alonso, 2008). The Adolescent Perceived Events Scale (APES: Compas, et al., 1987) is other check list, which include positive or negative adolescent’s perception regarding events. The Problem Questionnaire (PQ) is a Likert scale with six factors, developed in German adolescents, frequently used in European population (Seiffge-Krenke, et al., 2009). Perceived Stress Scale, (PSS-10), developed in 1983 by Cohen, Kamarck and Mermelstein, is a brief instrument composed of two dimensions, and is still used in diverse contexts and was adapted in Mexican adolescents (González & Landero, 2007). Taking into account cultural differences, Adolescent Stress Questionnaire (ASQ) was developed to assess stress sources in ten domains in Norway population and also used with Scandinavian youth (Byrne, Davenport, & Mazanov, 2007; Moksnes, Byrne, Mazanov, & Espnessm, 2010). Lately was developed the ASQ-Short version (Anniko, Boersma, van Wijk, Byrne & Tillfors, 2018) with nine factors, three of them of academic issues. Other scales evaluate a particular domain such as the Student Stress Inventory-Stress Manifestations (SSI-SM), adapted in Spanish youth by Escobar et al. (2011) to assess sources of stress in the school setting, as well as, the Academic Stress in Secondary Education Questionnaire (García-Ros et al., 2015) which assess specific academic stressors as do homework, relationships with peers and teachers. Likewise, the Educational Stress Scale for Adolescents (ESSA) recently developed in Chinese adolescents. It is a 30 Likert items in five factors focusing with five factors focusing in academic stressors (Sun et al., 2012). The Daily Stress in the School is another measure developed with Chilean children and adolescents (Encina & Avila, 2015) and also explore everyday stress related with school setting including academic stress, stress of relational violence and environmental stress (Östberg, Låftman, Modin, & Lindfors, 2018).
Regarding Mexican population, there are few instrumentsspecifically designed to adolescents. The Life Events Questionnaire for Adolescents (Lucio & Durán, 2003), is a measure mainly on positive and negative stressful life events in seven areas (e. g. family, school, social, behavior problems, achievements and failures) that can be perceived as good, bad or indifferent. Other measures used in Mexican adolescents, were adapted from those aimed to adults, for example PSS (Cohen et al., 1983) with general population and university students (González & Landero, 2007).
Summarizing, some measures only cover a range of age and stage of adolescence (e.g. early adolescence), most of them are focused on a particular type of event (e. g. everyday stress) and domains (e. g. school, family); moreover, most of them including major events, an only a few assess the level of adolescent stress. According to evidence it is necessary evaluate both, minor and major events, in different areas (Rowe et al., 2016) frequently perceived as stressful by adolescents in an updated comprehensive measure and suitable the cultural context. Based on previous recommendations (e. g. Compas et al., 1987; Grant et al., 2014; Sheidow et al., 2014) the purpose of the present study was to develop a valid and reliable measure, to identifying major and minor potentially stressful events in multiple domains and assess the level perceived stress in adolescents aged 13 to 18 years old. Identifying types and sources of stress, including the level of stress it is an important issue due its clinical implications for the mental health, as well as, for designing school-based intervention from a preventive perspective.
Method
Participants
The total sample was intentionally composed by 991 adolescents, 51.6% male and 48.41% female, aged 13 to 18 years old (M age = 14.76; DE= 1.43). The study involved voluntary participation of students attending public high schools from five regions or states of Mexico: Mexico City, State of Mexico, Jalisco, Yucatán, and Oaxaca (Table 1).
Table 1 Distribution by sex, age, and schooling of the overall sample
| States | ||||||
|---|---|---|---|---|---|---|
| Mexico City | State of Mexico | Jalisco | Yucatán | Oaxaca | Total sample | |
| n=296 | n=167 | n=216 | n=180 | n=132 | N=991 | |
| f (%) | f (%) | f (%) | f (%) | f (%) | f (%) | |
| Sex | ||||||
| Boys | 148 (50) | 118 (70.1) | 101 (46.8) | 88 (48.9) | 56 (42.4) | 511 (51.6) |
| Girls | 148 (50) | 49 (29.9) | 115 (53.2) | 92 (51.1) | 76 (57.6) | 480 (48.4) |
| Age | ||||||
| 13 | 55 (18.7) | 26 (15.6) | 36 (16.7) | 8 (4.4) | 64 (48.5) | 189 (19.1) |
| 14 | 107 (36.6) | 30 (18.0) | 46 (21.3) | 2 (1.1) | 35(26.5) | 240 (24.2) |
| 15 | 96 (32.8) | 14 (8.4) | 100 (46.3) | 52 (28.9) | 26 (19.7) | 298 (30.1) |
| 16 | 17 (5.5) | 29 (17.4) | 29 (13.4) | 79 (43.9) | 7 (5.3) | 151 (15.2) |
| 17 | 11 (3.3) | 55 (32.9) | 4 (1.9) | 29 (16.1) | - | 89 (9.0) |
| 18 | 10 (3.1) | 13 (7.8) | 1 (0.5) | 10 (5.6) | - | 24 (2.4) |
| Schooling | ||||||
| Junior High School | 232 (78.2) | 68 (40.7) | 151 (69.9) | 62 (36.4) | 132 (100) | 655 (66.1) |
| High School | 64 (21.8) | 99 (59.3) | 65 (30.1) | 118 (65.6) | - | 336 (33.9) |
Instrument
The Perceived Stressors Global Scale for Adolescent (PSGS-A) was constructed in order to provide a valid and reliable measure aimed to identify potentially stressful major and minor events in multiple domains occurring during the last year, and to assess how stressful the event was for adolescents. The initial or pilot was integrated by 96 Likert 6-point items (0= No (did not happen); 1=Not at all stressful ; 2=A little stressful; 3=Much stressful; 4= Very much Stressful; 5=Extremely Stressful) and one open question aimed to explore any other stressful event reported by the adolescent.
Procedure
An instrumental study was carried out (Ato, López, & Benavente, 2013) involved three broad steps: I. Instrument design: 1. 669 answers to open questions concerning to stressful life events occurred during the last year were obtained and content analysis was carry out; 2. On the basis of this analysis, we elaborated a pilot version of 96 Likert items; 3. A panel of ten psychologists adolescence experts was asked to assess the adequacy of the items. 4. Pilot testing of this version with an open question was performed to refine the wording and format of the scale in school adolescents. Responses of the pilot test were analyzed in order to retain the items with better properties. 4. After that, 13 items were added, resulting the analysis of the answered to open question, so 109 Likert items version, plus an open question were applied in the general study. II. Initial examination of structure: The psychometric properties of 109 items were explored and adequacy of data was examined, then, factor structure analyses were carried out, and III. Test of the structure initial solution: A confirmatory analysis was conducted.
Authorization was requested from school directives for the evaluation, which was conducted by group in classrooms and lasted for 35 minutes. Considering ethical issues and standards stablish of Belmont Report (1979), all participants were informed about the purpose of the evaluation and informed assent and consent were requested from adolescents and their parents, respectively, whom accepted collaborate voluntarily without any kind of payment.
Data analyses
Descriptive, correlational, reliability, and factor analyses were conducted using (IBM, 2009). A concordance analysis (Cohen’s kappa) among psychologist experts was conducted to examined content validity. The psychometric properties of items were analyzed by assessing skewness and kurtosis, item-correlation and item-scale correlations (r-Pearson), as well as, its discrimination capability by comparing extreme groups using t-Student for independent samples. Criteria to retain items were: a) skewness and kurtosis values between + 1.50; b) r <.300 or >.800; c) t values with p≤.05. In order to analyze the PSGS-A’ factor structure, the sample was randomly split into two parts has been recommended (Izquierdo, Olea, & Abad, 2014). The factor analysis using principal component analysis (PCA) method extraction with promax rotation was conducted with the first part or sample one (N1=497; Mage=14.95; SD=1.34), since the assumption was the variables are correlated (Brown, 2009). Previous to PCA, an analysis of sample adequacy was tested, using Kaiser-Meyer-Oklin (KMO) and Bartlett’s sphericity test indexes. Data from a second part or sample two (N2=494; M age =14.56; SD=1.22) was used to perform a confirmatory factor analysis (CFA) to stablish the initial construct validity of PSGS-A, using maximum likelihood estimation (ML) method using AMOS 21.0 (Arbuckle, 2012). The goodness- of-fit of the model was established through the following indexes of fit: X 2 values (CMNI); X 2 ratio/degrees of freedom (CMNI/DF) as parsimony measures of less than 2.00; the Goodness of Fit Index (GFI), with values ≥0.90 indicating good fit; the root mean square of error approximation (RMSEA) value ≤ .05 can be considered a good fit, values between .05 and .08 is an adequate fit, however values <.06 is also considered a good fit index (Hair, Black, Babin, & Anderson, 2014). Incremental indexes like AGFI or adjusted goodness of fit index; the Tucker-Lewis Index (TLI), and the comparative fit index (CFI), with values close to 1, indicating a good fit (Thompson, 2004). The reliability was assessed testing the internal consistency; values <.60 were considered acceptable in exploratory analysis (Hair et al., 2014).
Results
Content validity and analysis of ítems
Content validity was examined by expert judgment method, obtaining that 70% of judges agreed that 79.76% of the items were relevant and belonged to the initial corresponding dimension and determined based on the literature about adolescent stress. Kappa concordance coefficients were obtained (p <0.05); degree of agreement between judges showed that 86 of 109 items ranging from moderate (k=0.4-0.6) to very high (k=0.8-1.00) values, according the proposed theoretical dimension (Escobar & Cuervo, 2008). Taking account, the analyses of psychometric properties of items, 15 items were removed (Table 2). Regarding skewness and kurtosis ten items with positive or negative values >1.50 were eliminated. Three items with r <.300 or r >.800 were eliminated too. In addition, two items with non-statistically significant t-values (p >.05) should be removed (66. “being sexually harassed”; 72. “having a disabled sibling” and 84. “thinking about being kidnapped”), but since in non-normal samples could be significant, they were retained
Table 2 Properties of items removed according criteria previous the factor análisis
| Items | Elimination criteria | ||||||
|---|---|---|---|---|---|---|---|
| M | SD | Skewness | Kurtosis | r | t Student | ||
| 6. | Have to drive | 1.17 | 1.48 | 1.135 | .277 | .200* | 1.909 |
| 13. | See that they mistreat a friend | 2.15 | 1.71 | .207 | -1.599 | -.249* | 4.345* |
| 29. | Having abused drugs | 1.94 | 1.54 | 1.543 | 1.088 | .577** | -15.217** |
| 30. | That they screw me up mistreating school | 1.10 | 1.41 | 1.529 | 1.002 | .381** | -5.862* |
| 42. | Having abused alcohol | 1.08 | 1.54 | 1.578 | .940 | .187* | -5.214* |
| 48. | Caring for my grandparents | 1.07 | 1.32 | 1.242 | 1.502 | .155 | .994 |
| 60. | Suffer a violation | 1.35 | 1.93 | 1.033 | -.632 | .239 | -.961 |
| 61. | Unwanted Pregnancy | 1.29 | 1.87 | 1.084 | -.459 | .200* | 1.405¨* |
| 72. | Having a disabled sibling | 1.08 | 1.56 | 1.557 | .305 | .144 | -4.675* |
| 77. | That my friends pressure me to use alcohol or drugs | 1.03 | 1.58 | 1.593 | 1.043 | -.058 | 3.299* |
| 85. | Unwanted Abortion | .99 | 1.71 | 1.518 | .717 | .324** | .3.567** |
| 86. | Suffer some sexual dysfunction | 2.07 | 1.64 | 1.536 | .363 | .388** | -12.019** |
| 88. | Death of a family member and / or friend | 1.48 | 1.91 | -.021 | -1.562 | .318** | -5.989* |
| 107. | Go to camp only with classmates or friends | 1.07 | 1.34 | 1.559 | .818 | .299* | -6.004* |
| 108. | Go exchange to study outside the country | 1.02 | 1.49 | 1.522 | .552 | .219 | 4.108* |
* p ≤ 0.05; ** p ≤ 0.01
Factor structure analysis
Prior to factor analysis, a normality test was conducted with Kolmogorov-Smirnov statistics, with values at d = 1.258 and d = 1.457 (p>.05), which indicated a normal distribution. The Kaiser-Meyer-Olkin index (KMO=.943) and the Bartlett’s sphericity test (X2 = 29815.346; gl = 5460; p<.001), confirmed the adequacy of data to conduct factor analysis. A principal component analysis (PCA) method, with promax rotation was carried out. The item selection criteria were: 1. Commonalities > .400; 2. Factors loads > .400; 3. Items not loading more than one factor; and 4. At list 3-4 items were loading in each factor and had theoretical meaningful. The resulting matrix (Table 3) shows the factor weights of the 53 items and their properties, distributed in six factors that explained a total variance of 46.69%: F1. Critical events (Ce= 13 items) assess major unexpected life events; F2. Daily hassles (Dh =9 items) identifies everyday stressors; F3. Social exposure (Se=9), evaluate situations implying social exposure that usually produce stress; F4. Family concerns (Fc=9 items) makes reference to stressors related to family issues; F5. Academic stressors (As=7 items) identifies school related stressors; F6. Social pressure (Sp=6 items) reflects situations representing social pressure and social interaction limitations that could be a source of stress.
Table 3 Configuration matrix with factor weights and psychometrics properties of the ítems
| Ítems | F1 | F2 | F3 | F4 | F5 | F6 | M | SD | Skewness | Kurtosis |
|---|---|---|---|---|---|---|---|---|---|---|
| 84.Being kidnapped | .808 | 1.59 | 2.06 | .756 | -1.497 | |||||
| 96 Being arrested or arrested | .779 | 1.32 | 1.73 | 1.014 | -.410 | |||||
| 97. My friends pressure me to conduct criminal behavior | .739 | 1.89 | 1.60 | 1.256 | .235 | |||||
| 94. Expelled or suspended from school | .724 | 1.68 | 1.86 | .709 | -.971 | |||||
| 66 Being sexually harassed | .721 | 1.69 | 1.81 | .933 | -.676 | |||||
| 62.Death of any of the parents | .694 | 1.72 | 2.11 | .650 | -1.354 | |||||
| 103.Not getting a job | .654 | 1.27 | 1.64 | 1.066 | -.185 | |||||
| 104. Having one of my parents (mother or father) sick | .641 | 1.85 | 1.90 | .507 | -1.287 | |||||
| 82. Being a victim of an assault | .626 | 1.80 | 1.83 | .513 | -1.198 | |||||
| 93.Live in an unsafe or violent place | .570 | 1.62 | 1.61 | .678 | -.813 | |||||
| 95. Have to work | .542 | 1.20 | 1.46 | 1.015 | -.028 | |||||
| 89.Have a family member sick | .471 | 2.11 | 1.76 | .208 | -1.254 | |||||
| 87.Death of my pet | .459 | 2.03 | 1.80 | .402 | -1.184 | |||||
| 92. Not having enough time for my activities | .617 | 2.18 | 1.60 | .213 | -1.006 | |||||
| 83. Lose something valuable | .595 | 2.51 | 1.79 | -.019 | -1.327 | |||||
| 74. Fight with my friends | .589 | 1.85 | 1.52 | .506 | -.613 | |||||
| 65. Be in traffic while transporting | .540 | 1.92 | 1.56 | .432 | -.774 | |||||
| 91.Not getting enough sleep | .531 | 1.90 | 1.64 | .506 | -.857 | |||||
| 54.Loss money | .523 | 2.33 | 1.63 | .165 | -1.043 | |||||
| 67.Not having internet | .516 | 2.09 | 1.77 | .373 | -1.150 | |||||
| 75. Fight with my brother(s) | .513 | 1.81 | 1.50 | .465 | -.693 | |||||
| 99.Not getting transportation | .499 | 1.51 | 1.57 | .749 | -.497 | |||||
| 73.Get out alone to buy something to store | .616 | 1.48 | 1.46 | .787 | -.384 | |||||
| 105.Travel by plane, truck or car | .584 | 1.48 | 1.43 | .815 | -.136 | |||||
| 106.Go to summer-course | .560 | 1.39 | 1.52 | .959 | -.100 | |||||
| 76.Transport me alone to school | .539 | 2.28 | 1.41 | 1.085 | ||||||
| 46.Go to parties or large gatherings | .521 | 1.48 | 1.38 | .793 | -.135 | |||||
| 57. Do work team at school | .521 | 1.99 | 2.11 | .630 | -.553 | |||||
| 49.Go to doctor | .486 | 1.52 | 1.37 | .797 | .048 | |||||
| 109. Staying to sleep in the house of a friend or partner | .483 | 1.16 | 1.31 | 1.121 | .596 | |||||
| 80. Attend to take extra classes | .452 | 1.49 | 1.54 | .806 | -.415 | |||||
| 51. That my brothers fight each other | .539 | 2.21 | 1.45 | 1.095 | .290 | |||||
| 19.That my father / mother drink too much alcohol | .523 | 1.32 | 1.67 | .997 | -.331 | |||||
| 44. That my father / mother change jobs | .501 | 2.08 | 1.30 | 1.145 | .565 | |||||
| 43.Changing my home outside the city or country | .498 | 1.11 | 1.61 | 1.296 | .364 | |||||
| 39. Change or move from home | .498 | 1.19 | 1.48 | 1.072 | .107 | |||||
| 40. That my parents do not have money to pay the rent / mortgage | .449 | 1.36 | 1.72 | .922 | -.574 | |||||
| 17. Leaving the house by one of my parents | .447 | 1.27 | 1.63 | 1.033 | -.223 | |||||
| 47.Have stepmother/stepfather | .436 | 1.11 | 1.65 | 1.316 | .354 | |||||
| 71.My father / mother losed their job | .402 | 1.56 | 1.72 | .736 | -.766 | |||||
| 4. To take an exam | .594 | 2.58 | 1.42 | -.140 | -.609 | |||||
| 16.Have a lot of homework | .586 | 2.59 | 1.49 | -.152 | -.775 | |||||
| 22.Participate in class | .525 | 2.23 | 1.44 | .224 | -.663 | |||||
| 5. Get bad grades or notes | .514 | 2.63 | 1.61 | -.185 | -1.001 | |||||
| 24.Do not turn in homework | .479 | 2.23 | 1.42 | .129 | -.694 | |||||
| 12. Speak in public front many people | .478 | 2.09 | 1.59 | .312 | -.908 | |||||
| 1. That teacher asks me in class | .401 | 2.95 | 1.19 | .009 | -.297 | |||||
| 25.Not having friends | .604 | 1.45 | 1.48 | .842 | -.352 | |||||
| 26.Not having a boyfriend | .567 | 1.38 | 1.42 | 1.010 | .196 | |||||
| 27.Not having a cell phone | .525 | 1.71 | 1.62 | .610 | -.780 | |||||
| 37. That the boy I like rejects me | .479 | 1.41 | 1.57 | .771 | -.525 | |||||
| 20.Not having money to buy what I want | .471 | 2.02 | 1.58 | .370 | -.833 | |||||
| 36. Moken me on online | .421 | 1.06 | 1.44 | 1.340 | .820 | |||||
| Variance explained = 46.69% | 28.61 | 6.19 | 4.36 | 3.27 | 2.40 | 1.86 | ||||
| Total Cronbach's alpha = .962 | .765 | .756 | .807 | .788 | .799 | .763 |
Note: N=491. Extraction method: principal components. Rotation method: promax Kaiser’s normalization. F1. Critical events, F2. Daily hassles, F3. Social exposure, F4. Family concerns, F5. Academic stressors, F6. Social pressure
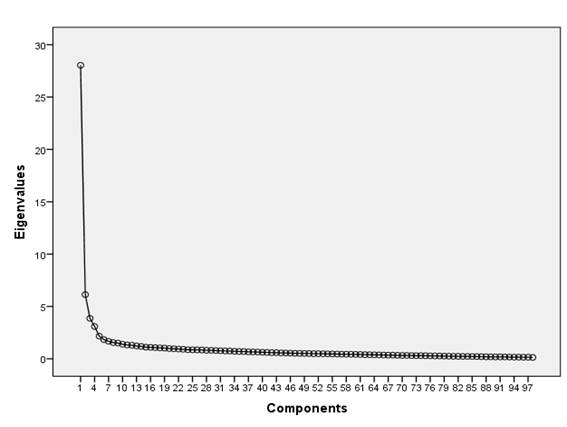
In addition, to proportion of variance explained, a scree-test were also used as criterion to choose the number of factors (Figure 1). The inflexion point in the scree plot indicates that six or seven factors could be maintained. Given that some theoretical assumptions, we decided retained six factors (Brown, 2009).
Internal consistency
The analysis of internal consistency of PSGS-A of each factor and entire scale (Table 3), showed high and moderate Chronbach’s alpha values (Hair et al., 2014). These factors were included in the CFA, after evaluating its means and correlations.
Descriptive data and intercorrelations among factors Table 4 shows that Critical events, Academic stressors and Daily hassles registered the highest scores. On the other hand, all correlations among the six factors of PSGS-A were positive and statistically significant; most of them moderate, which suggest a relative independence among scale factors. The highest correlation was between Critical events and Daily hassles and the lowest between Critical events and Social Exposure. No statistically significant differences by sex were observed in the comparative analyses with t-Student, except in Daily hassles with girls scoring higher than boys (M girls =2.76; M boys =1.98; p=.003).
Table 4 Means, standard deviations, and intercorrelations among factors of PSGS-A
| Factors | M | SD | F1 | F2 | F3 | F4 | F5 | F6 |
|---|---|---|---|---|---|---|---|---|
| F1. Critical events | 2.94 | 1.33 | 1 | .653** | .320** | .736** | .380** | .453** |
| F2. Daily hassless | 2.66 | 1.12 | 1 | .427** | .583** | .542** | .484** | |
| F3. Social exposure | 1.83 | .948 | 1 | .417** | 452** | .424** | ||
| F4. Family concerns | 2.60 | 1.11 | 1 | .419** | .566** | |||
| F5. Academic stressors | 2.71 | .950 | 1 | .393** | ||||
| F6. Social pressure | 2.36 | 1.03 | 1 |
N=497. * p≤0.05; ** p≤ 0.01.
Confirmatory factor análisis
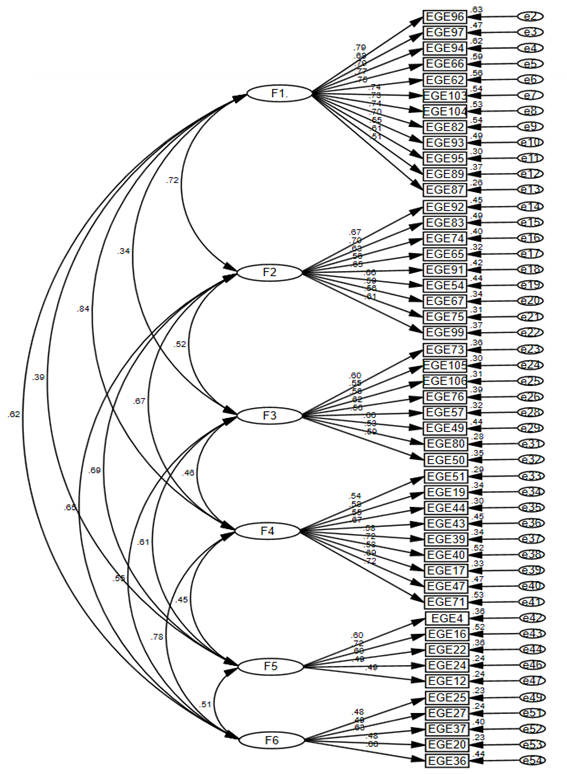
The confirmatory factor analysis (CFA), with sample 2 (S2=494) is shown in Figure 2. All the parameters were significant (p<.05), indicating an adequate fit of model with 48 items across the original six factors (Arburckle, 2012). According to the cutoff criteria for several fit indexes (Hair et al., 2014) absolute goodness of fit indexes can be considered acceptable: Square Chi (X 2=2911.260; gl=2064; p<.001); Goodness of Fit Index (GFI=.900); Root mean square error of approximation (RMSEA=.059) with interval of confidence < .06 to .08. Comparative fit with Incremental Fit Index (IFI=.914) was good, however, Tucker-Lewis Index (TLI=.895) and Compared Goodness of Fit Index (CFI=.898) can be considered marginal, as well as, Adjusted Goodness of Fit Index (AGFI=.879). and Parsimony Index (CMIN/DF=2.76) were, also under the umbral. All indexes can be considered marginals, except the GFE and the CFI were > .90 as it recommended (Thompson, 2004).
Discussion
From an eco-systemic and preventive perspective, multidimensional evaluation of life events and stress is the basis for designing intervention with adolescents, which involves the use of valid and reliable measures (Cicchetti, 2013). The purpose of this study was to develop a valid and reliable measure, to identifying potentially stressful major and minor events in multiple domains and the level of stress perceived by adolescents aged 13 to 18 years old. Previous skewness and kurtosis analyses indicated that items 72. “having a disabled sibling” and 84. “thinking about being kidnapped” were out of the recommended range (+ 1.500), so they should be deleted from the factor analysis however, in view of its potential significance for special groups, they were kept. In order to secure consistency with literature and assessment by judges, items were grouped as expected, since these are dimensions where adolescents often feel overwhelmed, pressed or stressed (Escobar & Cuervo, 2008).
Major or critical events were grouped in a first factor accounting for most of variance, which reveals that they continue to be a significant source of stress in most adolescents, even if they are not frequent (Compas et al., 1987; Grant et al., 2014; Jaureguizar et al., 2016). Items related with everyday stressor were integrated in the second factor named Daily Hassles (Hewitt et al., 2014; Morales, 2017) which are frequently associated with emotional and behavior problems (Hewitt et al., 2014; Sheidow et al., 2014). Despite the importance of everyday stressors in teenagers’ lives, stress measures for teenagers are not always included, or they are evaluated separately in a single instrument. The factorization of a third dominion called Social Exposure, in this study, seems to be changes in the social environment that make teenagers fearfully perceive “common” situations that did not produce stress in the past, such as “going to store to buy things” or “getting to school” (Persike & Seiffge-Krenke, 2016; Sheidow et al., 2014). A fourth factor, Family concern, identifies stressors related to family dynamics (e.g. fights between parents, with siblings) and families worries in general. This result is consistent with the family domain of EEP (González & Landero, 2007) and identifies everyday parent-children relationship (García-Linares et al., 2014; Persike & Seiffge-Krenke, 2016), as well as, family functioning issues overall (Yan et al., 2014). Family financial situation such as “no having enough money« or “one of my parents loses his/her job” frequently are considered as not affecting adolescents, on contrary, in this study report that economic pressures are source of stress. These findings show that family economic hardships, also are important to adolescents, and could be a potential negative influence on psychological adjustment, as depression or antisocial behavior (Santiago et al., 2016, 2017). The Academic Stressors factor assess school events in a way that is similar to SSI-S (Escobar et al., 2011; García-Ros et al, 2015), and also to ESSA (Sun et al., 2012), frequently reported by adolescents and related to academic performance and school desertion (García-Ros et al., 2015). The six factor Social pressure is related with stress from interpersonal relations (Persike & Seiffge-Krenke, 2016; Serrano & Vaillo, 2016), which evaluates issues similar to the Others’ Expectations domain in ESSA (Sun et al, 2012) and imply concerns in social interaction. Noticed that the scree-plot suggests a seven factors configuration, but the decision to retained six factors was on base of several statistical criteria and theoretical considerations (Brown, 2009; Izquierdo et al., 2014).
Regarding the CFE outcomes, a number of limitations could be noted of the PSGS-A. Some indexes of fit of goodness of model (e.g. TLI, CFI, and AGFI) can be considered marginal or slightly below stablish criteria (≥ 0.90). RMSEA index of fit results a little bit above the optimal cutting point, even though within the acceptable range (.05 - .08) according to Hair et al. (2014). On the other hand, the X 2 value was significative, may be, due it is a parameter particularly sensible to sample size.
In addition, the large sample size in this study could be increasing the indexes of internal consistency of PSGS-A, whereas the proportion of explained variance decreasing. These considerations indicate that it should be considered the first validated version of this measure and more tests concerning construct validity. Therefore, its structure may be evaluated though other programs, such as Factor, that could be provide other solution for the factor structure of PSGS-A.
Nevertheless, the factor analysis (PC) indicators and the overall fit of model resulting of CFE, a suggest that the PSGS-A is a multidimensional instrument with an adequate theoretical and empirical factor structure and acceptable reliability indicators. The PSGS-A could imply significant advantages as compared to general measurements that are more suitable for adults (Cohen et al., 1983), some of which have been validated with adolescents (e. g. González & Landero, 2007). PSGS-A assess life, major and daily events on multiple domains identifying the level of perceived stress by Mexican youth. The PSGS-A identify domains as basic adolescent interaction scenarios: school, family, and social, as have been reported previously (Anniko et al., 2018, 2019; Escobar et al., 2011; Rowe et al, 2016; Sun, et al 2012). Moreover, critical events, social exposure and daily hassles, are domains, particularly the first one, thatseems to reflect the perspective of Mexican adolescents in different contexts better than other instruments designed in other countries. In view of the importance of critical events like those occurring every day as part of adolescents’ development and adaptation, the PSGSA could be useful in comprehensively evaluating different sources and types of stressors and measuring how stressful they are for adolescents (Grant et al., 2014; Östberg et al., 2018).
These results suggest that the Perceived Stressors Global Scale for Adolescent (PSGS-A) is an updated and culturally relevant measure with acceptable psychometric properties to use with Mexican population. Nevertheless, given that some limitations, it is recommended testing the validity and reliability of PSGS-A with other samples, as well as, analyzing its concurrent validity and its test-retest reliability, in view of the changing nature of event perception during adolescence and according to sub-stages. It is also important to assess its capability to discriminate normative samples from clinical and subclinical ones.

